Large metals speculators raised their bullish net positions in the Copper futures markets this week, according to the latest Commitment of Traders (COT) data released by the Commodity Futures Trading Commission (CFTC) on Friday.
The non-commercial futures contracts of Copper futures, traded by large speculators and hedge funds, totaled a net position of 36,355 contracts in the data reported through Tuesday May 15th. This was a weekly lift of 2,903 contracts from the previous week which had a total of 33,452 net contracts.
Speculative positions rebounded this week after declining for two weeks in a row. The overall net position has remained above the +30,000 net contract level for five consecutive weeks.
Copper Commercial Positions:
The commercial traders position, hedgers or traders engaged in buying and selling for business purposes, totaled a net position of -41,277 contracts on the week. This was a weekly loss of -2,050 contracts from the total net of -39,227 contracts reported the previous week.
Over the same weekly reporting time-frame, from Tuesday to Tuesday, the Copper Futures (Front Month) closed at approximately $305.60 which was a decline of $-0.30 from the previous close of $305.90, according to unofficial market data.
*COT Report: The COT data, released weekly to the public each Friday, is updated through the most recent Tuesday (data is 3 days old) and shows a quick view of how large speculators or non-commercials (for-profit traders) as well as the commercial traders (hedgers & traders for business purposes) were positioned in the futures markets. The CFTC categorizes trader positions according to commercial hedgers (traders who use futures contracts for hedging as part of the business), non-commercials (large traders who speculate to realize trading profits) and nonreportable traders (usually small traders/speculators). Find CFTC criteria here: (http://www.cftc.gov/MarketReports/CommitmentsofTraders/ExplanatoryNotes/index.htm).
RoboForex, an international financial company, introduces an opportunity to buy Bitcoin (BTC) for fiat money. This innovation will allow the Company’s clients to buy BTC, perform trading operations with this asset, and convert the cryptocurrency back to fiat money. Along with an opportunity to buy Bitcoin, RoboForex clients can benefit from the difference of BTC exchange rates. Clients are not obliged to trade cryptocurrency – they can merely deposit funds to their Bitcoin accounts and receive profits in case of the asset growth.
As a matter of fact, this innovation from RoboForex is similar to the exchange Bitcoin wallet, but has several essential advantages:
Depositing/withdrawing funds via many payment systems, including bank cards.
Guarantee of funds security. RoboForex is a regulated broker, which has been successfully operating on the market for more than 8 years.
Quick funds withdrawal.
Opportunity to trade any currency pairs on Pro-Standard, ECN-Pro NDD, and Prime accounts using Bitcoin.
With these new opportunities to buy the cryptocurrency and deposit funds to Bitcoin Wallets, providing access to a new product to RoboForex clients which allows to investment in Bitcoin quickly and securely.
However, it should be clear that the new product is not intended for conversion of the cryptocurrency into fiat money. A client, who deposited in his account in BTC, can not withdraw funds from the account in fiat currency. This is only available to the assets, which were acquired from the Company when deposited to the account or earned when trading on it.
Denis Golomedov, Chief Marketing Officer at RoboForex, believes this is a positive step towards adapting the revolutionary currency in today’s market: “Providing the ability for clients to deposit into their accounts in Bitcoin is not only an additional service, which expands clients’ opportunities, but also a standalone product, which significantly dominates over its market counterparts. Security has become very significant issue recently, as more and more information appears about hacking cryptocurrency exchanges and stealing users’ assets. Using the cryptocurrency is much more convenient and safer for clients within the framework of their trading and investment activities using products and services provided by a regulated broker”.
About RoboForex
RoboForex Ltd is a company, which delivers brokerage services on a world-wide basis. The company provides traders, who work on financial market, with access to its proprietary trading platforms. RoboForex Ltd has the brokerage license IFSC/60/271/TS/17. More detailed information about the Company’s activities and operations can be found on the official website at www.roboforex.com.
US Dollar net speculator positions leveled at $-9.82 billion as of Tuesday
The latest data for the weekly Commitment of Traders (COT) report, released by the Commodity Futures Trading Commission (CFTC) on Friday, showed that large traders and currency speculators continued to trim their aggregate bearish bets of the US dollar this week and raised their positions for the dollar against most of the major currencies. See full article
The non-commercial contracts of WTI crude futures totaled a net position of 644,444 contracts, according to data from this week. This was a slide of -35,484 contracts from the previous weekly total. See full article
The large speculator contracts of gold futures totaled a net position of 92,443 contracts. This was a weekly decline of -14,997 contracts from the previous week. See full article
The large speculator contracts of 10-year treasury note futures totaled a net position of -381,922 contracts. This was a weekly increase of 26,707 contracts from the previous week. See full article
The non-commercial contracts of silver futures totaled a net position of 658 contracts, according to data from this week. This was a weekly gain of 779 contracts from the previous totals. See full article
The large speculator contracts of copper futures totaled a net position of 36,355 contracts. This was a weekly boost of 2,903 contracts from the data of the previous week. See full article
The Commitment of Traders report data is published in raw form every Friday by the Commodity Futures Trading Commission (CFTC) and shows the futures positions of market participants as of the previous Tuesday (data is reported 3 days behind).
EURUSD is consolidating around 1.1818. If later the instrument breaks this range to the upside, the market may grow to reach 1.1876 and then fall towards 1.1857; if to the downside – resume falling inside the downtrend with the target at 1.1698.
GBPUSD, “Great Britain Pound vs US Dollar”
GBPUSD is still consolidating around 1.3535. Today, the price may reach 1.3595 and then fall towards 1.3440. If later the instrument breaks this range to the upside, the market may start another correction to reach 1.3750; if to the downside – resume falling with the target at 1.3333.
USDCHF, “US Dollar vs Swiss Franc”
USDCHF is still consolidating. Possibly, today the price may fall to reach 0.9940 and then grow towards 1.0000. If later the instrument breaks this range to the downside, the market may start another correction to reach 0.9820; if to the upside – resume growing with the target at 1.0110.
USDJPY, “US Dollar vs Japanese Yen”
USDJPY is moving upwards. Today, the price may reach 111.04 upwards and then fall towards 110.50. Later, the market may form another ascending structure with the target at 111.21.
AUDUSD, “Australian Dollar vs US Dollar”
AUDUSD continues consolidating below 0.7560. If later the instrument breaks this range to the upside, the market may start another growth to reach 0.7700; if to the downside – resume falling inside the downtrend with the target at 0.7310.
USDRUB, “US Dollar vs Russian Ruble”
USDRUB is moving downwards. Today, the price may fall towards 61.20, break it, and then continue forming the third descending wave with the target at 59.90.
XAUUSD, “Gold vs US Dollar”
Gold is consolidating near the lows. If later the instrument breaks this range to the upside, the market may start another correction to reach 1302.00; if to the downside – resume falling with the target at 1280.00.
BRENT
Brent has reached another upside target. Possibly, today the price may fall to reach 78.62 and then grow towards 81.60. Later, the market may start another decline with the target at 79.10.
Attention! Forecasts presented in this section only reflect the author’s private opinion and should not be considered as guidance for trading. RoboForex LP bears no responsibility for trading results based on trading recommendations described in these analytical reviews.
As we can see in the H4 chart, after forming several Hammer and Harami reversal patterns, USDCAD has rebounded from the support level once again and formed Shooting Star pattern at the top. Judging by the previous movements, it may be assumed that the correction may be over soon and then the instrument may continue falling.
AUDUSD, “Australian Dollar vs US Dollar”
As we can see in the H4 chart, AUDUSD is still forming a lot of Hammer, Doji, and Inverted Hammer reversal patterns. Judging by the previous movements, at the moment it may be assumed that these candlesticks indicate that the descending tendency may be over soon and the instrument may later resume trading upwards.
Attention! Forecasts presented in this section only reflect the author’s private opinion and should not be considered as guidance for trading. RoboForex LP bears no responsibility for trading results based on trading recommendations described in these analytical reviews.
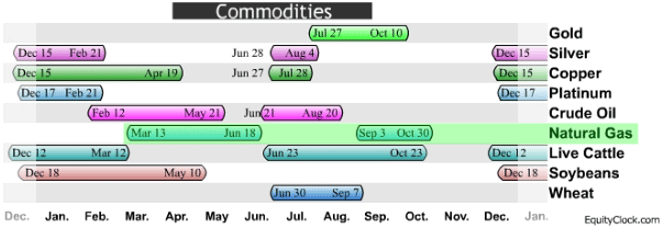
Our research team has been following the energy sector quite intensely with Oil and Natural Gas making an impressive move. A little known seasonal pattern in Natural Gas has setup recently and we have alerted our members to this play which is already up over 16%. Our advanced price modeling systems and Adaptive Dynamic Learning Cycles have recently triggered another buy entry point which we share in this article but first look at the seasonal chart showing the month which Natural Gas is generally strong.
This seasonality table refers to particular time frames when commodities are subjected to and influenced by recurring tendencies that produce patterns each year.
It is our belief that Natural Gas will continue to climb higher moving well above the $3.00 level before the end of this month as well as potentially pushing well above the $3.20 level on continued price advances in energy.
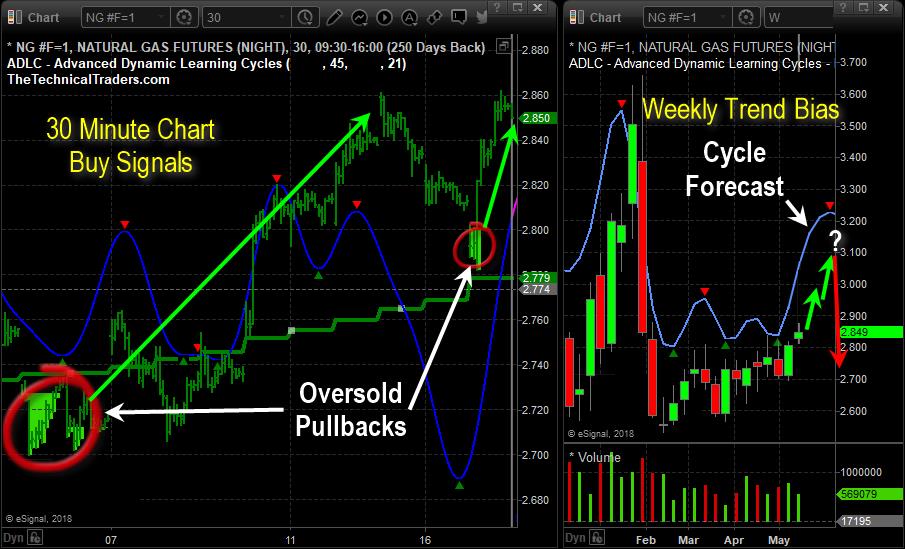
Quite a bit of concern globally is driving energy supply fear that is pushing energy prices higher. This unique seasonal pattern indicates the potential for some strong upside price moves. We believe smart traders were already positioned for this move weeks ago, yet there is still quite a bit of opportunity from the recent entry point. See the left side of chart; below with oversold pullbacks.
A price move from current levels to above $3.00 would reflect an additional 4~6% price gain and a advance above $3.20 would reflect a 11% price advance. Again, our predictive price modeling systems and cycle modeling systems are showing us this has the potential for quite a bit more, but we can only estimate the $3.00 to $3.20 level is a sufficient upside target for this initial move.
If you would like help finding trade triggers like this and help knowing what to expect each day in the markets visit us at www.TheTechnicalTraders.com. We’ll help you to understand the market dynamics as the markets move, we’ll provide you with a comprehensive daily market video to show you what to expect and we’ll continue to provide you with this simple yet highly effective market research and analysis to help you stay ahead of the market moves. Our current trade in UGAZ is up 16% and likely going much higher. It just takes one or two of these types of trades to pay for your membership for years.
Our 53 years experience in researching and trading makes analyzing the complex and ever-changing financial markets a natural process. We have a simple and highly effective way to provide our customers with the most convenient, accurate, and timely market forecasts available today. Our stock and ETF trading alerts are readily available through our exclusive membership service via email and SMS text. Our newsletter, Technical Trading Mastery book, and 3 Hour Trading Video Course are designed for both traders and investors. Also, some of our strategies have been fully automated for the ultimate trading experience.
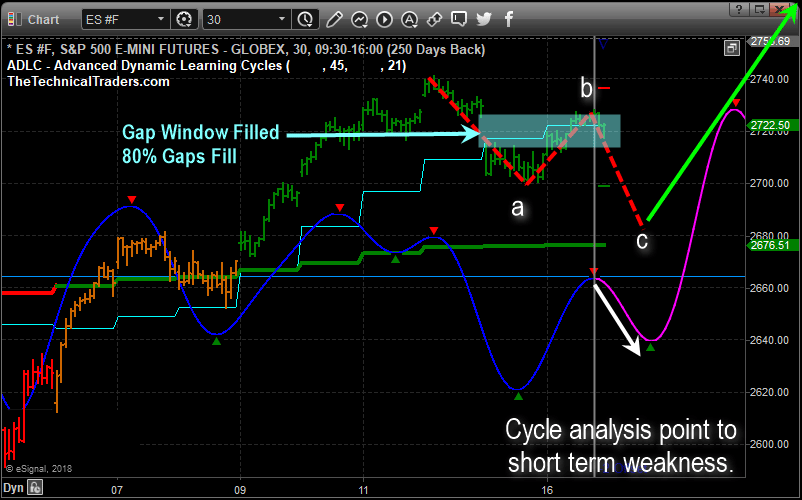
The 30-minute chart price pattern with a large gap down in price on Tuesday morning created what we call a “Gap Window”. Almost all gaps in the SP500 get filled eventually, and both the top and bottom areas of a gap window become short-term resistance or support.
A three-wave a-b-c correction is generally what causes stop orders to be run, panic selling, and creates a pivot low. This is displayed with a red line on the chart.
If this very short-term pattern unfolds it would create fantastic entry point because several different types of analysis come into play at the same time and price. The green 20-day simple moving average and our short-term cycle projection would act as support and a cycle low.
Our articles, Technical Trading Mastery book, and 3 Hour Trading Video Course are designed for both traders and investors to explore the tools and techniques that discretionary and algorithmic traders need to profit in today’s competitive markets. Created with the serious trader and investor in mind – whether beginner or professional – our approach will put you on the path to win. Understanding market structure, trend identification, cycle analysis, volatility, volume, when and when to trade, position management, and how to put it all together so that you have a winning edge.
EURUSD is consolidating near the lows. Possibly, today the price may reach 1.1875, fall towards 1.1755, and then grow to return to 1.1875. If later the instrument breaks this range to the upside, the market may start another correction to reach 1.2100; if to the downside – resume falling inside the downtrend with the target at 1.1600.
GBPUSD, “Great Britain Pound vs US Dollar”
GBPUSD is still consolidating around 1.3535. Today, the price may reach 1.3580 and then fall towards 1.3435. If later the instrument breaks this range to the upside, the market may start another correction to reach 1.3755; if to the downside – resume falling with the target at 1.3333.
USDCHF, “US Dollar vs Swiss Franc”
USDCHF is still consolidating. Possibly, today the price may fall to reach 0.9940 and then grow towards 1.0000. If later the instrument breaks this range to the downside, the market may start another correction to reach 0.9820; if to the upside – resume growing with the target at 1.0110.
USDJPY, “US Dollar vs Japanese Yen”
USDJPY has broken 110.00 upwards and right now is consolidating above it. If later the instrument breaks this range to the upside, the market may reach 111.11; if to the downside – start another correction with the target at 108.30.
AUDUSD, “Australian Dollar vs US Dollar”
AUDUSD continues consolidating below 0.7560. If later the instrument breaks this range to the upside, the market may start another growth to reach 0.7700; if to the downside – resume falling inside the downtrend with the target at 0.7310.
USDRUB, “US Dollar vs Russian Ruble”
USDRUB is moving downwards. Today, the price may fall towards 61.20, break it, and then continue forming the third descending wave with the target at 59.90.
XAUUSD, “Gold vs US Dollar”
Gold is consolidating near the lows. If later the instrument breaks this range to the upside, the market may start another correction to reach 1302.00; if to the downside – resume falling with the target at 1280.00.
BRENT
Brent is moving upwards and trying to break its consolidation range to the upside. Possibly, today the price may reach 80.20. Later, the market may start another correction with the target at 77.20.
Attention! Forecasts presented in this section only reflect the author’s private opinion and should not be considered as guidance for trading. RoboForex LP bears no responsibility for trading results based on trading recommendations described in these analytical reviews.
Recently, we authored an article about Fibonacci price levels in which we referred to a term called “Fibonacci Price Ladders”. This is our own term, as far as we know, and we used it as a way to attempt to explain how price operates within the Fibonacci theory. Our objective was to allow the reader to think of a standard ladder and how each ladder rung allows the climber to advance (move up) or decline (move down) using the ladder. We hope it helped all of our readers to better understand the concept of how price rotates within a trend to establish longer-term price trends.
Within this post, we are going to revisit this Fibonacci Price Ladder concept to show you how recent price rotation may be setting up for a new, and possibly historical, price advance in the near future. We urge our readers to revisit our earlier Fibonacci Price Ladder research to refresh your memory should you have any questions about this research.
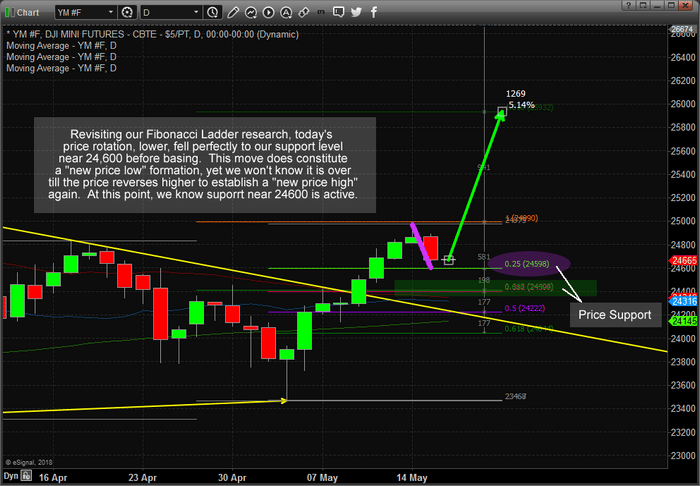
DAILY DOW INDEX CHART
This Daily YM Mini DOW Index chart shows the price rotation, downward, that moved directly to our Fibonacci support level near 24,600. Technically, this constitutes a “new price low” formation and could foretell the end of this price correction before a new price advance begins. If you remember, our prior analysis has indicated a very strong potential for a very strong price move higher from recent lows. Yes, we expected this move and actually protected ourselves and our members by pulling profits in some trades near the highs last week. Now that this move appears to be nearing completion with a proper Fibonacci price rotation, we believe a new price bottom will form quickly near the 24,600 level (with massive support existing above 24,400) driving a new price advance within days.
DAILY ES CHART
This Daily ES chart helps to confirm the Fibonacci Price Ladder analysis by showing an even deeper “new price low” price rotation recently forming. Massive price support exists in the ES between 2684 and 2700 and we believe this level will hold to form a price bottom/base before a new leg higher will advance price to new highs.
This Fibonacci Ladder process is simple to understand, once a new price high or low is established, any failure to continue to set new immediate higher highs or lower lows constitutes a potential failure of the current price trend. So, if this recent low price move is a move to near a market base/bottom, then we should expect an upside price rotation to set up fairly quickly over the next few days. We believe this will be the case and that traders should already be looking for new entry levels for the next leg higher.
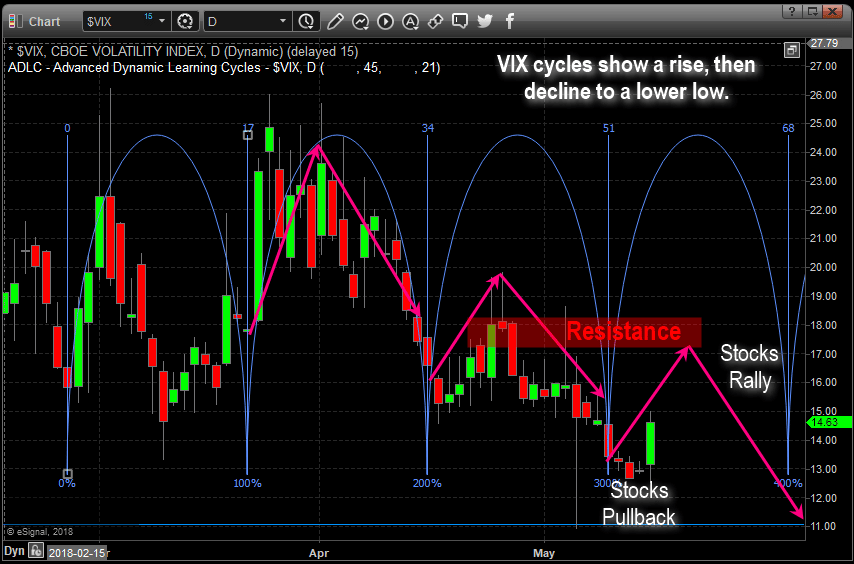
DAILY VIX CHART
This last Daily VIX chart showing Fibonacci Time/Price cycles shows that we are nearing a major cycle date, with resistance just above the current price of the vix. We should expect the current downside stock market price to possibly extend downward, briefly, to establish a low price rotation and then reverse higher to begin a new upside price leg.
It is our belief that the VIX will stall near the resistance level and fall back to near or below $11 as the new upside price advance in the US majors extends to near all-time highs.
Currently, we see this price rotation as a healthy normal price rotation that is essential to a further price advance. Price MUST attempt to rotate while establishing new price lows in order to establish new price highs. This is healthy, normal price rotation that we believe will result in a larger price advance in the immediate future.
We are already searching for new entry triggers to take advantage of the future price leg higher. If you are searching for ways to profit from this, and other future price moves, then visit TheTechnicalTraders.com to learn how we can help with Daily video content, extensive and proprietary research and price modeling, detailed trade triggers and analysis and more. Our job is to assist you in becoming a better and more successful trader.
Our 53 years experience in researching and trading makes analyzing the complex and ever-changing financial markets a natural process. We have a simple and highly effective way to provide our customers with the most convenient, accurate, and timely market forecasts available today. Our stock and ETF trading alerts are readily available through our exclusive membership service via email and SMS text. Our newsletter, Technical Trading Mastery book, and 3 Hour Trading Video Course are designed for both traders and investors. Also, some of our strategies have been fully automated for the ultimate trading experience.


