Author Archive for InvestMacro – Page 405

OIL Targeting $58 PPB Before Finding Support

By TheTechnicalTraders.com

With the G7 meeting concluding and the world about to start reacting to what was said and what was heard, it is time to take a look at the Crude charts with our Advanced Fibonacci price modeling system.

Our research team, at www.TheTechnicalTraders.com, believes Crude will continue to drift lower over the next few weeks testing the $60 ppb level before breaching this support level and ultimately targeting $58 or lower.  Lacking a real resolution to the trade and other global issues, we believe continue global economic pressures will drive oil prices dramatically lower over time – at least through the Summer months.

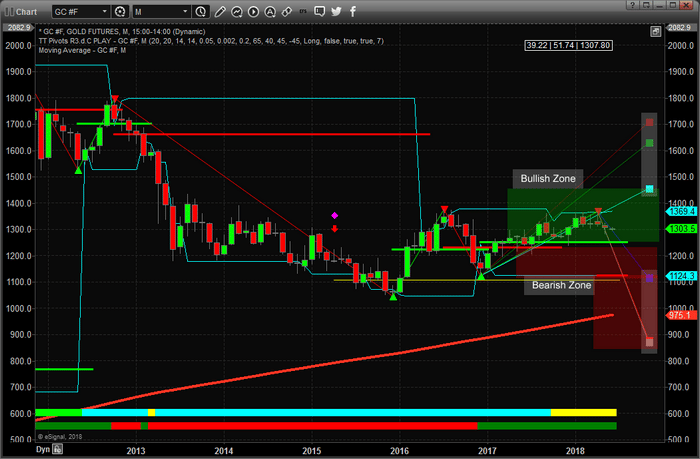
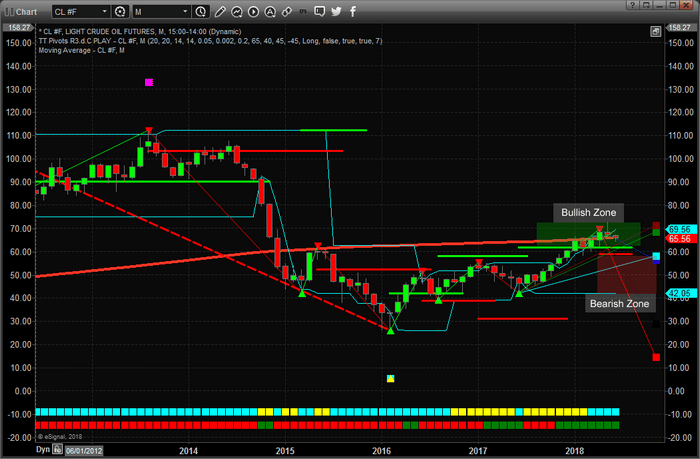
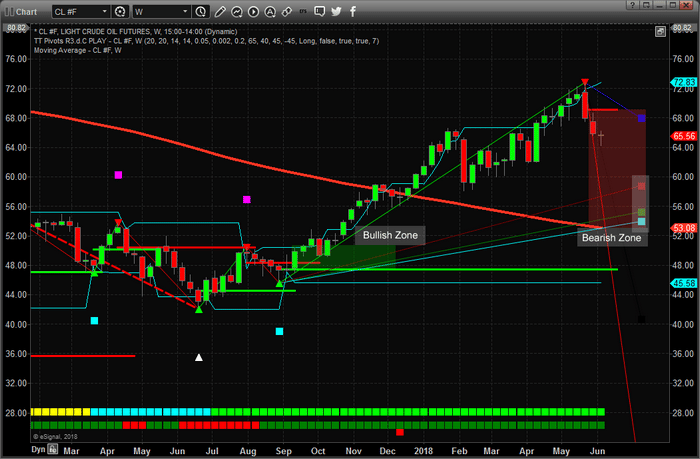
This Monthly Crude Light chart shows our Advanced Fibonacci price modeling system at work.  As of right now, we see a recent price rotation top (highlighted by the RED DOWN TRIANGLE) near the right edge of price as well as the RED and GREEN Fibonacci projection levels near $69.50.  These projection levels indicate that the $69.50 level is likely resistance.  Notice the BLUE and CYAN Fibonacci projection levels near $58.00 ppb.  The fact that these two levels nearly overlap one another indicates that the $58.00 ppb level is a key price level for current support.  Obviously, the ultimate downside target, near $14.00 ppb, is an extended downside level that could happen – but is not likely till all other levels a breached with downside price activity.

Currently, as long as the $60.00 ppb is not breached, the Monthly Fibonacci price modeling system trend is “Bullish” and a move to below $58.00 would change the trend to “Bearish”.  As we stated, the $60.00 price level is critical going forward on this Monthly chart.


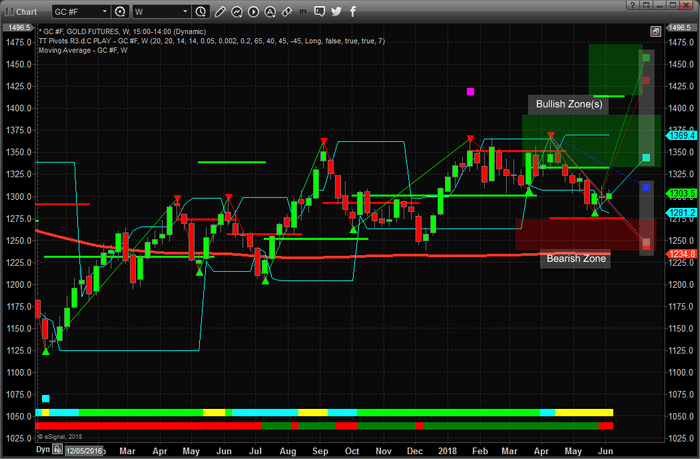
This Weekly Crude Light chart paints a shorter-term price picture and clearly highlights the most recent price decline with a clear sell trigger near $69.00.  Take special notice of the Fibonacci upside targets between $54 an $58 near the right side of the chart.  These upside targets, because the price is moving lower from above and has breached the Bearish Price Trigger Level (RED), are now downside target levels.  With no real support between the current price and the $58.00 level, we expect oil to continue to fall to near the $58.00 level before finding some support – possibly as low as $54.00.  Ultimately, if these levels don’t provide sufficient price support, oil prices could fall back to near $45 ppb before finding any real support – a -30% decrease from current price levels.


One thing that we find interesting is that the ERY (Energy Bear ETF) has yet to reflect any of this concern.  Yes, we can see some price support near the right edge of this Weekly ERY chart, yet it appears the general market is not factoring in the gap in support below the $58.00 price level – meaning ERY could see a big jump higher on any price breakdown in Crude prices.  How big?  Our research team believes this move could be greater than 70% ROI from current levels if our predictions are correct.  A breakdown from current levels to below $55.00 ppb in Crude would likely cause ERY to rocket above $60.00 per share from the current price levels near $32.50.


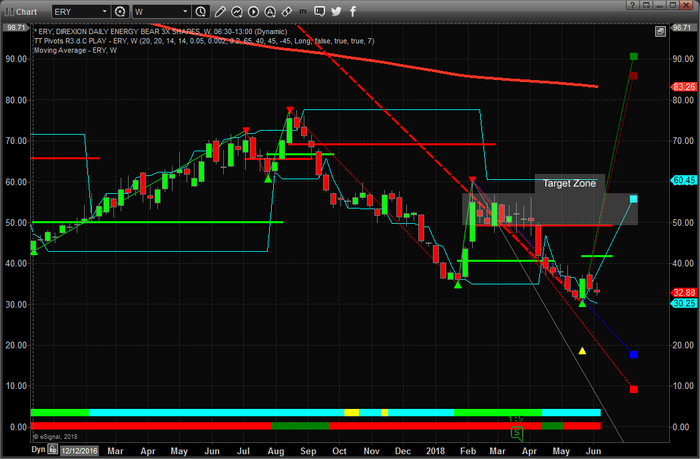
To be clear, Crude is poised to retest the $60.00 ppb level before attempting to find support near $58.00.  If this support fails, then expect Crude to fall to near $54.00 ppb before finding support.  This move will likely cause ERY to rocket upward to well above $50.00 on a short-term move (possibly higher).

Watch for news this week regarding oil supplies and the G7 aftermath.  We are certain the news cycles will provide some hints as to the future economic cycles and expectations for the Summer months.  We believe the supply glut and current trade issues are causing concerns in trade and transportation activities, thus we believe the downside move in Oil is almost inevitable at the moment.  Great supply, diminishing demand, and global trade/economic concerns will likely push Oil prices back below $55 within the next 30~45 days.

Stay aware of these fantastic trade opportunities by visiting www.TheTechnicalTraders.com and learning how we can help you stay ahead of the markets with our advanced predictive modeling systems, expert research, daily video content and detailed trading signals.  Our proprietary research is second to none – you won’t find these tools or capabilities anywhere else.

Visit www.TheTechnicalTraders.com to learn how we’ve called nearly every move in the markets this year and continue to astound our members with our detailed research.  Opportunities exist for profits every week – it is simply a matter of finding them and executing them.

By TheTechnicalTraders.com

Pound Reacts To Brexit Talks Again

By Dmitriy Gurkovskiy, Chief Analyst at RoboForex

After making a short pause in the middle of the week, the British Pound is back to falling. Investors are quite calm in estimating the statistics, but become rather nervous when it comes to the Brexit issue again.

The statistics published on Wednesday afternoon showed that the Inflation Rate in the United Kingdom remained unchanged in May at 2.4% y/y. In case of the Core Inflation Rate, the situation is similar – 2.1% y/y, the same as in the previous month. The HPI decreased from 4.2% y/y to 3.9% y/y. The PPI Input added 2.8% m/m, while the PPI Output expanded by 0.4% m/m, the same as the month before.

Prices are more or less stable in the United Kingdom and that’s good for the Pound. However, the Brexit issue is reviving once again and that’s not good at all.

Yesterday, the British Prime Minister Theresa May stole the limelight again when she was speaking about amendments to the Brexit bill. As a result, she managed to carry her point and the Pound moved upwards a little bit, but then fell again. Changes in the British government don’t make investors happy as well: earlier, the British Minister of Justice Phillip Lee resigned from his position due to his disagreement with the British Government on the Brexit issue.

This week, the Pound will depend on the USD behavior a lot. The USD, in its turn, is going to respond to the results of the US Federal Reserve and the European Central Bank meetings. On Thursday, investors should pay attention to the May report on the Retail Sales in the UK.

After falling for a long time, GBPUSD has broken the resistance line and formed the correctional uptrend channel. The short-term technical picture shows that the price broke the support line of the rising channel and started another downtrend, which may become a new mid-term impulse inside the long-term downtrend. The local downsides target is at 1.3290. After breaking it, the pair may continue falling to break the low at 1.3204. However, one shouldn’t exclude a possibility that the correction may yet continue. If the instrument breaks the resistance line at 1.3400, it may form a new ascending impulse to reach the next resistance level at 1.3498.

Disclaimer

Any forecasts contained herein are based on the authors’ particular opinion. This analysis may not be treated as trading advice. RoboForex bears no responsibility for trading results based on trading recommendations and reviews contained herein.


Fibonacci Retracements Analysis 13.06.2018 (GBPUSD, EURJPY)

Article By RoboForex.com

GBPUSD, “Great Britain Pound vs US Dollar”

As we can see in the H4 chart, GBPUSD is being corrected upwards; the pair has almost reached the retracement of 23.6% at 1.3482, but then started consolidating. The next targets of this rising correction may be the retracements of 38.2% and 50.0% at 1.3653 and 1.3791 respectively. The support level is the current low at 1.3204.

GBPUSD1
Risk Warning: the result of previous trading operations do not guarantee the same results in the future

In the H1 chart, the divergence made the pair reverse and start a new correction, which is heading towards the retracement of 50.0% at 1.3338. The next target may be the retracement of 61.8% at 1.3307.

GBPUSD2
Risk Warning: the result of previous trading operations do not guarantee the same results in the future


EURJPY, “Euro vs. Japanese Yen”

As we can see in the H4 chart, after being corrected to the downside by 38.2%, EURJPY has started a new ascending impulse, which is getting closer to the local high at 130.27.  After breaking it, the instrument may continue growing to reach the post-correctional extension area between the retracements of 138.2% and 161.8% at 131.08 and 131.57 respectively. However, the price may yet rebound from the high and continue the correction downwards. In this case, the target may be the retracement of 50.0% at 127.45.

EURJPY1
Risk Warning: the result of previous trading operations do not guarantee the same results in the future

The H1 chart shows more detailed structure of the current movement.

EURJPY2
Risk Warning: the result of previous trading operations do not guarantee the same results in the future

Article By RoboForex.com

Attention!
Forecasts presented in this section only reflect the author’s private opinion and should not be considered as guidance for trading. RoboForex LP bears no responsibility for trading results based on trading recommendations described in these analytical reviews.

Forex Technical Analysis & Forecast 13.06.2018 (EURUSD, GBPUSD, USDCHF, USDJPY, AUDUSD, USDRUB, GOLD, BRENT)

Article By RoboForex.com

EURUSD, “Euro vs US Dollar”

EURUSD has reached 1.1733 and completed the half of the third descending wave. Possibly, today the price may consolidate near the lows. If later the pair breaks this range to the downside, the market may fall towards 1.1700 and then grow to reach 1.1740. After that, the instrument may continue falling inside the downtrend with the short-term target at 1.1664.

EURUSD
Risk Warning: the result of previous trading operations do not guarantee the same results in the future


GBPUSD, “Great Britain Pound vs US Dollar”

GBPUSD is falling to reach 1.3300. After that, the instrument may grow towards 1.3390 and then start another decline with the target at 1.3244.

GBPUSD
Risk Warning: the result of previous trading operations do not guarantee the same results in the future


USDCHF, “US Dollar vs Swiss Franc”

USDCHF is growing towards 0.9900. Later, the market may fall towards 0.9845 and then grow to reach the short-term target at 0.9960.

USDCHF
Risk Warning: the result of previous trading operations do not guarantee the same results in the future


USDJPY, “US Dollar vs Japanese Yen”

USDJPY is still growing and expanding its range upwards. Possibly, the price may reach 110.75. After that, the instrument may fall towards 109.55, break it, and then continue this decline with the target at 107.90.

USDJPY
Risk Warning: the result of previous trading operations do not guarantee the same results in the future


AUDUSD, “Australian Dollar vs US Dollar”

AUDUSD has broken its consolidation range upwards. Possibly, the price may fall to reach 0.7542 and then grow towards 0.7582. Later, the market may continue falling inside the downtrend with the target at 0.7488.

AUDUSD
Risk Warning: the result of previous trading operations do not guarantee the same results in the future


USDRUB, “US Dollar vs Russian Ruble”

USDRUB is still consolidating around 62.00. Possibly, today the price may try to expand the range towards 63.21 and then form a new descending structure to reach 61.57. After that, the instrument may break this level and then continue trading to the downside with the short-term target at 60.00.

USDRUB
Risk Warning: the result of previous trading operations do not guarantee the same results in the future


XAUUSD, “Gold vs US Dollar”

Gold is being corrected and forming the Flag pattern. Today, the price may fall towards 1288.00, break it, and then continue this decline to reach the short-term target at 1275.00. However, the instrument may choose an alternative scenario to return to 1304.00 once again and then resume falling to reach 1240.00.

GOLD
Risk Warning: the result of previous trading operations do not guarantee the same results in the future


BRENT

Brent is consolidating around 76.18. Possibly, the price may fall to reach 74.92 and then resume growing to reach the first target at 78.30. Later, the market may form a new descending structure to return to 75.80 and then grow with the short-term target at 80.50.

BRENT
Risk Warning: the result of previous trading operations do not guarantee the same results in the future

Article By RoboForex.com

Attention!
Forecasts presented in this section only reflect the author’s private opinion and should not be considered as guidance for trading. RoboForex LP bears no responsibility for trading results based on trading recommendations described in these analytical reviews.

EURUSD: euro bulls all over the place in anticipation of the Fed decision and upcoming ECB meeting

By Gabriel Ojimadu, Alpari

Previous:

On Tuesday the 12th of June, trading on the euro closed down. This drop was brought about by the universal decline of the dollar following comments from Jerome Powell. He said that he plans to hold a press conference at the end of every central bank meeting. This is good news, as when Janet Yellen was chair, she only held press conferences after meetings in which interest rates were hiked. The euro has since dropped to 1.1734.

Day’s news (GMT+3):

  • 11:30 UK: PPI (May), CPI (May).
  • 21:00 USA: Fed interest rate decision, FOMC economic projections, Fed’s monetary policy statement.
  • 21:30 USA: FOMC press conference.

Fig 1. EURUSD hourly chart. Source: TradingView

Current situation:

We’ve had several false breakouts of the trend line recently. Our pair dropped below the trend line towards the end of the US session yesterday. The drop amounted to 67 degrees.

Today marks the end of the FOMC’s two-day meeting. Market participants are expecting a key rate hike of 0.25%. There will be a press conference with Chair Jerome Powell to follow. The ECB is meeting on Thursday. Volatility is set to be high during the US session.

I’ve decided not to make a forecast because I’m expecting movements in all directions. Traders expect the ECB to set out a timeframe for ending its bond-buying program, while the Fed is expected to raise interest rates. If we consider that a rate hike has already been factored in by markets, then we’ll most likely revisit the low from the 8th of June (1.1727) before returning to 1.1755. We won’t be able to move very far upwards without a decision from the ECB.

Gold and Silver Setting up for a Sleeper Breakout

By TheTechnicalTraders.com

As the world continues to see economic improvements, specifically within the US and major global markets, Gold and Silver are relegated to an after-thought by investors.   Why consider Gold or Silver when the NASDAQ or S&P leaders are rallying 2%+ per week?

Well, the recent G7 meeting and President Trump’s meeting with Kim Jung Un in Singapore may spark a little interest in these shiny metals as they setup a “rope-a-dope breakout” for those not paying attention.

One of the easiest components of Fibonacci price theory is the concept that “price must always attempt to establish new price highs or new price lows within price rotation – ALWAYS”.  For those of you that are familiar with our research, visit www.TheTechnicalTraders.com if you are not, you know that the lack of new price highs indicates a downward trend may have formed.  Conversely, a lack of new price lows indicated an upward price trend may have formed.  With this in mind, let’s take a look at this Monthly Gold chart.

Please notice that the recent price lows, originating near the start of 2016 all the way through current price activities, are continually higher.  Even the current price rotation, near the right edge of the chart, is still higher than the previous low price rotation near the middle of 2017.  Ladies and Gentlemen, we have an uptrend already in place in Gold.  The “rope-a-dope breakout” that we are suggesting is right around the corner is the potential for a $1370 price break that has been setting up since June 2016.

Our proprietary Fibonacci price modeling system is showing us the current price trend is BULLISH and that support is near $1250.  Additionally, the newest Bearish Price Trigger level, near $1124, is a result of extended price rotation and lack of clear price trend (the “rope-a-dope” setup).  This has lulled many metals investors into thinking any price breakout may never happen if the global economy continues to strengthen.


Well, we’re here to tell you that this price breakout may be less than 30 days away from now and the key to any potential move will originate in the global fear that may continue to grow as the world’s leading economies continue to spar over trade, economic cooperation and fair opportunities going forward.  Nearly 3 months ago, we authored a detailed research piece on China and the fact that China and SE Asia were entering an economic malaise cycle.  The recent elections in Malaysia may have changed this perspective a bit, but the core economic cycles have not likely changed much.  We believe Gold and Silver are setting up for breakout of the $1370 price level with the potential to rally to near $1430~$1463 within the next 3~5 months – +11.5% or more.


Silver, the other shiny metal, is the one investment that many have overlooked and the chart proves why this is the case.  This Monthly Silver chart shows that silver has been trapped in a sideways trend for months.  The price low, set in early 2016, is a critical low point regarding future price analysis.  From this point, we are able to establish price waves, counts and other key factors of future price activities.  Our proprietary Fibonacci price modeling system is showing use that the price of Silver MUST rally above $19.50 to qualify for a new BULLISH price trend.  Currently, the price of Silver is $16.82.  This means the price of Silver MUST rise by more than 16% to establish a new BULLISH trend.  Hmm…


Think about that for a minute..  Gold has already shown a Fibonacci Bullish price trend is in place and a breakout is nearly upon us.  Silver is showing a similar setup, but is telling us that price has to move upward by more than 16% to establish a new bullish price trend whereas Gold only needs to move higher by about 8% for the same outcome.  Either way, if Gold moves higher by greater than 8% and Silver moves higher by greater than 16% from current levels) – that is a GREAT TRADE.  The upside potential after that is even better.

The price rotation required to achieve this upside breakout is likely to play out over the next 30~45 days or more.  Remember, we’re calling this a “rope-a-dope breakout” because we believe this will be a sleeper move to the upside.  Gradually climbing over the next 30+ days and gradually building up momentum till a massive upside breakout move takes place.  By then, these lower price levels will be gone and the upside move will already be taking place – catching many traders flat-footed.


There has been talk that many big players are setting up short positions in the US markets (financials and others). We believe this could be a disaster waiting to unfold should the global markets play out as we expect.  Yes, fear of some economic issues will continue to drive Gold and Silver higher, but we believe the US market is somewhat immune from this debt concern because it is really the only game on the planet to generate returns and opportunities.  Things can change, but for right now, expect Gold and Silver to continue to rotate higher and watch for Silver to start moving at 1.5x or 2.x that of gold as the breakout takes place.  This “rope-a-dope breakout” is setting up to be a fantastic trading opportunity for those able to see it unfolding.

Stay aware of these fantastic trade opportunities by visiting www.TheTechnicalTraders.com and learn how we can help you stay ahead of the markets with our advanced predictive modeling systems, expert research, daily video content and detailed trading signals.  Our proprietary research is second to none – you won’t find these tools or capabilities anywhere else.  Visit our Wealth Building Newsletter today to learn how we’ve called nearly every move in the markets this year and continue to astound our members with our detailed research.  Opportunities exist for profits every month – it is simply a matter of finding them (that’s what we do) and you just execute the trade setups.

By TheTechnicalTraders.com

Are ICO-Chaser Lawyers the New Ambulance-Chasers?

By Amie Parnaby

“Have you bought into an ICO in the past 3 years? Were you disappointed with the result? No win, No Fee…”

Have you ever heard “Have you had an accident in the past 3 years? No win, No Fee…” on a TV or radio advertisement? With the recent rash of civil lawsuits and class-action suits against some of the biggest cryptocurrency providers, I can’t help but feel it could soon change to “Have you bought into an ICO in the past 3 years…?”

It sounds silly, and maybe it is a little, but it’s not that far from the truth. With the number of people who bought into the crypto-craze that happened in 2017, investing in ICO’s without thorough research, and losing out when the bubble burst in late December.

This is only the beginning

There are a lot of people out there that bought into ICOs using Bitcoin or Ether and then sold at a loss when they didn’t get the return on their investment that they expected.

While a lot of people would probably think along the lines of “You sold too early” or “You didn’t do your research”, the litigation lawyers are making the most of ICOs that are operating in the grey area of financial law. In truth, the area is only grey because the cryptocurrency market is so new that no one has really thought to review these 80-year-old laws to reflect the current digital climate.

The majority of recent lawsuits have occurred in the U.S. (not really surprising), but there have been others in Norway (which they lost) and Australia. Unfortunately for the coin producing companies, there are set to be several more.

The recent class-action lawsuit served to Ripple means that the civil litigation lawyers are upping their game to the major leagues of cryptocurrency.

There will be a point when the number of civil cases won or lost will determine what the law-makers do to bring cryptocurrency into the fold of regulation. Will they try to make them fit the old pre-tech laws or will new ones be created? Whichever way it goes the effect will trickle down through the crypto community, affecting everything as it goes.

Not all bad news

The fact that most of the cases raised have been in the U.S. makes a difference. While there have been reports of financial litigation firms making lists of ICO’s to sue, their interest lies entirely on what they will get back from it. Much like the “No win, No Fee” personal injury lawyers, these financial litigation experts will recoup much of their costs from the ICOs they sue, plus a whole lot more to swell their coffers.

One of these lawyers, David Silver, has gone on record saying:

“I said into a camera that I planned on filing 30 (class actions against ICOs) in 30 days.”

He’s since retracted that number because there is less likelihood of suing and collecting from ICOs not based in the U.S. Consequently, there is less value in suing. There are significantly more non-U.S. based and registered ICOs than U.S. based. As a result, the trickle-down effect will have more impact on the U.S. based companies that had an initial ICO than those in other countries.

This is bad news for ICOs based in or strongly linked to the U.S. (they make perfect targets), but it is better news for all the rest. Assuming of course that the rest of the world doesn’t take its lead from America.

There is a shift happening already, with companies postponing their ICO’s until legislation is settled and moving their businesses away from the U.S., due to the litigious culture inherent there.

About the Author:

Amie Parnaby is a professional writer with an experience in a broad range of industries, from I.T to training, from optics to banking. Within these settings, Amie has provided quality web content, training materials and technical documentation. She is currently an in-house Content Writer at Leverate.


June 2018 bitcoin forecast

By Tina Pham, Alpari

Since the beginning of the year, market capitalisation has fallen by 44.3% from the level of 611bn USD. At the moment, the cryptocurrency market is estimated at 340bn USD. The shares of the top three leaders are 61.41% and are shown in Figure 1.

Fig.1

On the 29th of March, bitcoin’s market cap made some astonishing gains to reach 45.79%, which is the highest value since the beginning of the year, according to data from coinmarketcap. Now, the share of the cryptocurrency market leader has dropped to 38.15%. Also, from the 1st of January to today, the daily trading volume of bitcoin has fallen 2.8 times – from 12.4bn USD to 4.29bn USD, and its price plummeted 47%, dropping from 14,317 USD to 7,581 USD.

Fig. BTC daily

On the 5th of May, the price of bitcoin reached a Q2 high of 9,948 USD, while a low of 6,561 USD was recorded on 1 April.

If we examine the bitcoin chart from a technical analysis point of view, we can draw the following conclusions.

On the daily chart (D1), we can see that bitcoin is trading below the 23.6 Fib retracement level. Several bullish attempts to gain a foothold above this level have fallen short. Bitcoin underwent lateral movement after its February fall to 6,000 USD. The situation isn’t expected to change very much in June. The crypto-asset market is awaiting the G20 summit in July this year, where the fundamentals of the global regulation of digital currencies will be discussed. In my opinion, Q3 may prove successful for bitcoin holders, since newly enacted legislation may lead to certain big players, mainly institutional investors as mentioned earlier, entering the market.

Fig. bitcoin graph

It is expected that bitcoin will continue its lateral movement in June. Local support and resistance levels are at 6,300 USD and 9,600 USD respectively.

Source: June 2018 bitcoin forecast


Japanese Candlesticks Analysis 12.06.2018 (GOLD, NZDUSD)

Article By RoboForex.com

XAUUSD, “Gold vs US Dollar”

As we can see in the H4 chart, after reaching the support level, XAUUSD is still moving sideways and forming Harami, Hammer, Inverted Hammer, and Doji reversal patterns. Judging by the previous movements, it may be assumed that after finishing this sideways movement the price may try to break the support level and then continue moving downwards.

GOLD
Risk Warning: the result of previous trading operations do not guarantee the same results in the future


NZDUSD, “New Zealand vs. US Dollar”

As we can see in the H4 chart, after reaching a new high, NZDUSD has formed several Shooting Star, Engulfing, and Doji reversal patterns, and right now is trading sideways. At the moment, it may be assumed that the instrument may complete the correction, update its closest high, and then continue the uptrend.

NZDUSD
Risk Warning: the result of previous trading operations do not guarantee the same results in the future

Article By RoboForex.com

Attention!
Forecasts presented in this section only reflect the author’s private opinion and should not be considered as guidance for trading. RoboForex LP bears no responsibility for trading results based on trading recommendations described in these analytical reviews.

Ichimoku Cloud Analysis 12.06.2018 (AUDUSD, NZDUSD, USDCAD)

Article By RoboForex.com

AUDUSD, “Australian Dollar vs US Dollar”

AUDUSD is trading at 0.7613; the instrument is moving above Ichimoku Cloud, which means that it may continue growing. The markets could indicate that the price may test the upside border of the cloud at 0.7605 and then continue moving upwards to reach 0.7720. Another signal to confirm further ascending movement is the price’s rebounding from the support level. However, the scenario that Implies further growth may be cancelled if the price breaks the downside border of the cloud and fixes below 0.7560. In this case, the pair may continue falling towards 0.7440.

AUDUSD
Risk Warning: the result of previous trading operations do not guarantee the same results in the future


NZDUSD, “New Zealand Dollar vs US Dollar”

NZDUSD is trading at 0.7037; the instrument is moving above Ichimoku Cloud, which means that it may continue growing. The markets could indicate that the price may test the upside border of the cloud at 0.7030 and then continue moving upwards to reach 0.7100. However, the scenario that implies further growth may be cancelled if the price breaks the downside border of the cloud and fixes below 0.6960. After breaking the resistance area and fixing above 0.7055, the price may continue moving upwards.

NZDUSD
Risk Warning: the result of previous trading operations do not guarantee the same results in the future


USDCAD, “US Dollar vs Canadian Dollar”

USDCAD is trading at 1.2995; the instrument is moving above Ichimoku Cloud, which means that it may continue growing. The markets could indicate that the price may test the upside border of the cloud at 1.2965 and then continue moving upwards to reach 1.3165. Another signal to confirm further ascending movement is the price’s rebounding from the channel’s downside border. However, the scenario that implies further growth may be cancelled if the price breaks the downside border of the cloud and fixes below 1.2905. In this case, the pair may continue falling towards 1.2845. After breaking the resistance level and fixing above 1.3040, the price may continue moving upwards.

USDCAD
Risk Warning: the result of previous trading operations do not guarantee the same results in the future

Article By RoboForex.com

Attention!
Forecasts presented in this section only reflect the author’s private opinion and should not be considered as guidance for trading. RoboForex LP bears no responsibility for trading results based on trading recommendations described in these analytical reviews.