By CountingPips.com – Get our weekly COT Reports by Email

US Dollar net speculator positions leveled at $-7.42 billion this week
The latest data for the weekly Commitment of Traders (COT) report, released by the Commodity Futures Trading Commission (CFTC) on Friday, showed that large traders and currency speculators increased their aggregate bearish bets for the US dollar again this week.
Non-commercial large futures traders, including hedge funds and large speculators, had an overall US dollar net position totaling $-7.42 billion as of Tuesday June 12th, according to the latest data from the CFTC and dollar amount calculations by Reuters. This was a weekly decline of $-1.88 billion from the $-5.54 billion total position that was registered the previous week, according to the Reuters calculation (totals of the US dollar contracts against the combined contracts of the euro, British pound, Japanese yen, Australian dollar, Canadian dollar and the Swiss franc).
The aggregate speculative bearish position increased for a second straight week after having six weeks of declining bearish levels that had brought the USD position to its second least bearish level all year. The overall bearish level remains under the $-10 billion threshold for a fifth straight week.

Weekly Speculator Contract Changes:
This week saw just one substantial changes (+ or – 10,000 contracts) in the individual currency contract level for the speculators category.
Mexican peso speculative bets continued to decline sharply and dropped by over -10,000 contracts for a fifth consecutive week. Overall, the speculator peso bets have now decreased for nine weeks in a row and the MXN spec position is in a bearish position for a second straight week.
Overall, the major currencies that improved against the US dollar this week were the British pound sterling (3,624 contracts), Japanese yen (8,489 contracts), Swiss franc (1,971 contracts), Canadian dollar (1,051 contracts), Australian dollar (4,973 contracts) and the New Zealand dollar (2,623 contracts).
The currencies whose speculative bets declined this week versus the dollar were the euro (-1,011 weekly change in contracts) and the Mexican peso (-10,590 contracts).
Table of Weekly Commercial Traders and Speculators Levels & Changes:
| Currency | Net Commercials | Comms Weekly Chg | Net Speculators | Specs Weekly Chg |
| EuroFx | -97,526 | -2,924 | 88,225 | -1,011 |
| GBP | -180 | -3,979 | 10,969 | 3,624 |
| JPY | 11,776 | 2,029 | 5,052 | 8,489 |
| CHF | 61,344 | -1,107 | -37,245 | 1,971 |
| CAD | 20,041 | -320 | -14,988 | 1,051 |
| AUD | 29,066 | -7,536 | -15,235 | 4,973 |
| NZD | -3,621 | -2,946 | 7,006 | 2,623 |
| MXN | 25,007 | 11,055 | -21,700 | -10,590 |
This latest COT data is through Tuesday and shows a quick view of how large speculators or non-commercials (for-profit traders) as well as the commercial traders (hedgers & traders for business purposes) were positioned in the futures markets. All currency positions are in direct relation to the US dollar where, for example, a bet for the euro is a bet that the euro will rise versus the dollar while a bet against the euro will be a bet that the dollar will gain versus the euro.
Weekly Charts: Large Trader Weekly Positions vs Price
EuroFX: 
British Pound Sterling: 
Japanese Yen: 
Swiss Franc:

Canadian Dollar: 
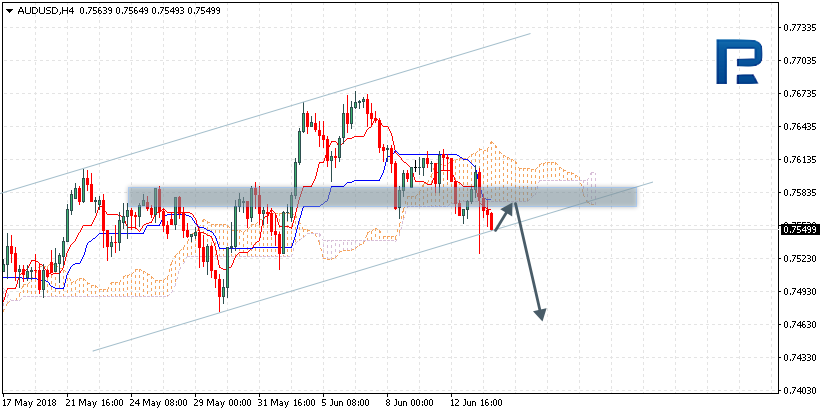
Australian Dollar: 
New Zealand Dollar: 
Mexican Peso: 
*COT Report: The weekly commitment of traders report summarizes the total trader positions for open contracts in the futures trading markets. The CFTC categorizes trader positions according to commercial hedgers (traders who use futures contracts for hedging as part of the business), non-commercials (large traders who speculate to realize trading profits) and nonreportable traders (usually small traders/speculators). Find CFTC criteria here: (http://www.cftc.gov/MarketReports/CommitmentsofTraders/ExplanatoryNotes/index.htm).
The Commitment of Traders report is published every Friday by the Commodity Futures Trading Commission (CFTC) and shows futures positions data that was reported as of the previous Tuesday (3 days behind).
Each currency contract is a quote for that currency directly against the U.S. dollar, a net short amount of contracts means that more speculators are betting that currency to fall against the dollar and a net long position expect that currency to rise versus the dollar.
(The charts overlay the forex closing price of each Tuesday when COT trader positions are reported for each corresponding spot currency pair.) See more information and explanation on the weekly COT report from the CFTC website.
Article by CountingPips.com