The Australian Dollar is under pressure against the USD due to the market situation. On Tuesday afternoon, the Aussie is getting weaker mostly because investors are choosing “safe haven” assets, such as the USD and the Yen, in order to avoid risks.
At the time when everybody is running away from Chinese-American “trade wars” risks, it can be quite clearly seen that the demand for “safe haven” assets in significantly increasing. In this light, one may expect the Australian Dollar to continue trading downwards, at least until the balance of power on the market changes.
The Monetary Policy Meeting Minutes report published by Australia today says that the expensive national currency prevents the country’s economy and the Consumer Price Index from growing. Now, when the Australian Dollar is under pressure, the Australian GDP may boost a little bit. The report also says that the areas that require greater attention are still the labor market and the inflation. Expectations for the GDP growth are 3% while the inflation target remains at 2%.
A special focus in the RBA Minutes is put of “trade wars” risks. The regulator believes that the current tariff adjustment in world commerce implies many risks and may force the global economy to slow down. In the present context, such comments may be very essential, because the USA and China don’t seem to stop fighting without outside interference.
In general, the Australian Dollar would feel more stable and confident, if there weren’t so many emotions on the market right now.
Since the “market crowd” is usually driven by emotions instead of the common sense, one can see that the technical picture of AUDUSD is still showing the downtrend. If one takes a look at the previous correction to the upside, it can be seen that after breaking the support line, the pair has formed a new descending impulse and reached the projected support line. While forming the impulse to the downside, the instrument is moving towards the long-term fractal low at 0.7328. After breaking it, the price may test the support line of the long-term channel at 0.7275. This is exactly the area, which the price may rebound from.
Author: Dmitriy Gurkovskiy, Chief Analyst at RoboForex
Disclaimer
Any forecasts contained herein are based on the authors’ particular opinion. This analysis may not be treated as trading advice. RoboForex bears no responsibility for trading results based on trading recommendations and reviews contained herein.
As we all know a picture says 1000 words, which is one of the reasons why I gravitated to trading using technical analysis. I can look at a chart and in seconds understand what price has done and is likely to do in the near future, without knowing a single thing about the company, index, or commodity. Why spend time reading news, financial statements, and other opinions when you can fast-track the entire process with a chart.
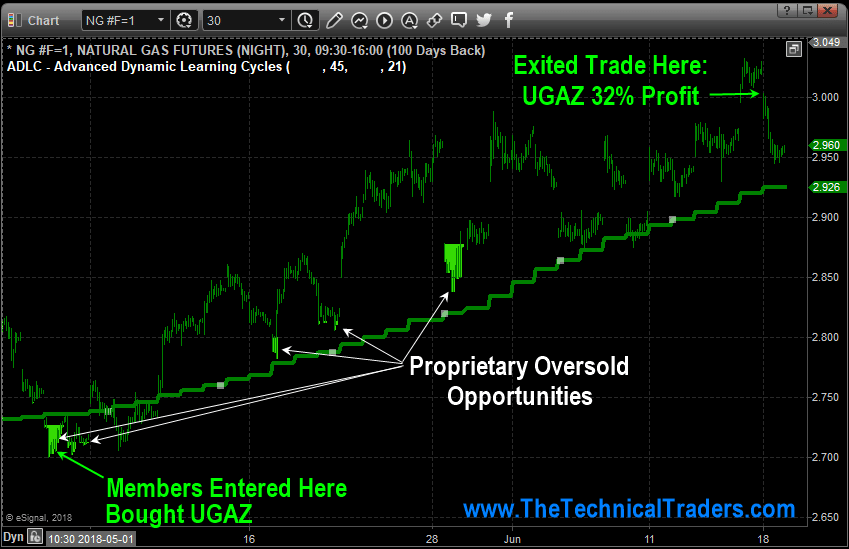
So, let’s just jump into the 30-minute chart of natural gas which shows the regular trading hours 9:30am – 4pm ET.
NATURAL GAS 30-MIN CHART WITH OVERSOLD AND TREND ANALYSIS
This chart could not be any more simple. Green bars and green line mean price is in an uptrend and you should only look to buy oversold dips. We got long a 3x natural gas ETN on May 3rd right near the dead low. After a few weeks, price action and longer term charts started to signal potential weakness, so we closed out the position for a simple 32% profit.
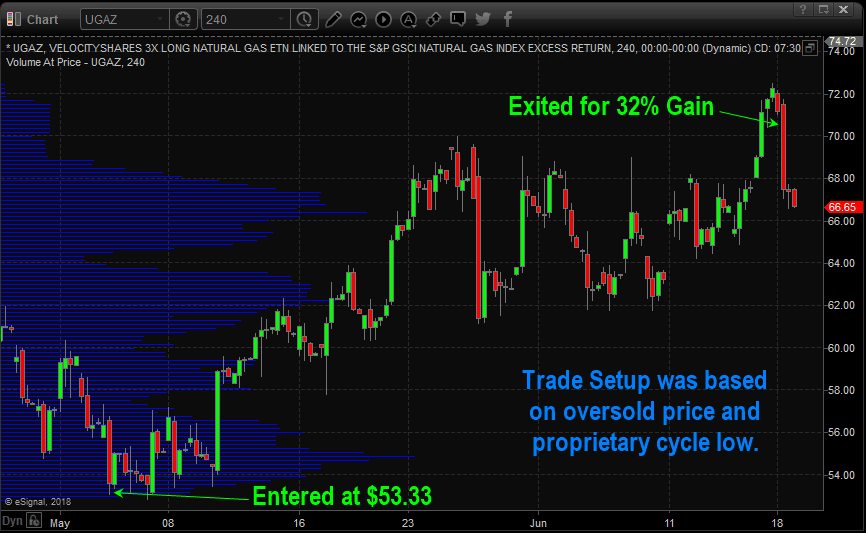
UGAZ 3X LEVERAGED NATURAL GAS FUND
Here is 240 minute (4-hour) candlestick chart of the natural gas fund.
53 years experience in researching and trading makes analyzing the complex and ever-changing financial markets a natural process. We have a simple and highly effective way to provide our customers with the most convenient, accurate, and timely market forecasts available today. Our stock and ETF trading alerts are readily available through our exclusive membership service via email and SMS text. Our newsletter, Technical Trading Mastery book, and 3 Hour Trading Video Course are designed for both traders and investors. Also, some of our strategies have been fully automated for the ultimate trading experience.
As we can see in the H4 chart, after falling, EURUSD has formed another correction with several Shooting Star reversal patterns at the top. At the moment, it may be assumed that the above-mentioned pattern indicate the completion of the correction and a further descending movement.
USDJPY, “US Dollar vs. Japanese Yen”
As we can see in the H4 chart, after falling from the resistance level, USDJPY has formed Hammer reversal pattern. Judging by the previous movement, it may be assumed that the instrument is about to start a new uptrend.
Attention! Forecasts presented in this section only reflect the author’s private opinion and should not be considered as guidance for trading. RoboForex LP bears no responsibility for trading results based on trading recommendations described in these analytical reviews.
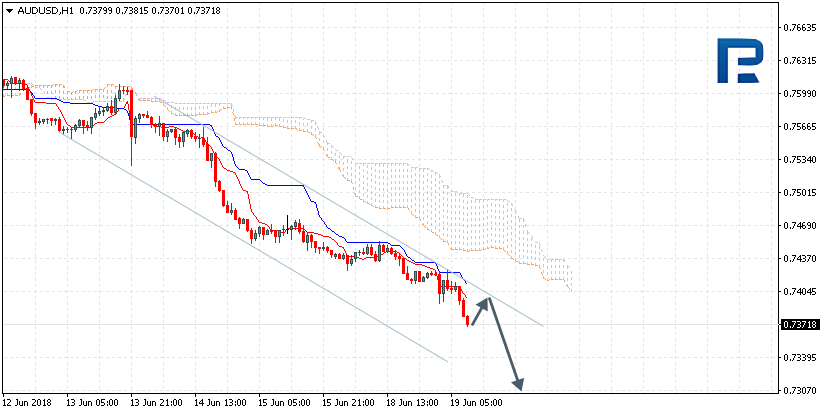
AUDUSD is trading at 0.7371; the instrument is moving below Ichimoku Cloud, which means that it may continue falling. The markets could indicate that the price may test Tenkan-Sen and Kijun-Sen at 0.7390 and then continue moving downwards to reach 0.7350. Another signal to confirm further descending movement is the price’s rebounding from the channel’s upside border. However, the scenario that Implies further decline may be cancelled if the price breaks the upside border of the cloud and fixes above 0.7460. In this case, the pair may continue growing towards 0.7565.
NZDUSD, “New Zealand Dollar vs US Dollar”
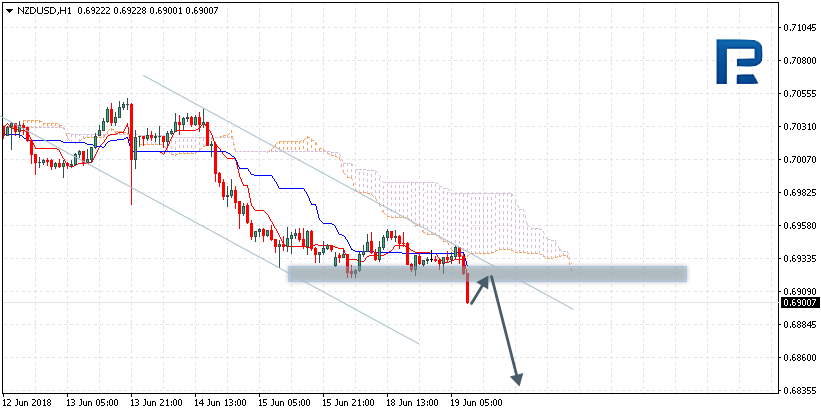
NZDUSD is trading at 0.6900; the instrument is moving below Ichimoku Cloud, which means that it may continue falling. The markets could indicate that the price may test Tenkan-Sen and Kijun-Sen at 0.6910 and then continue moving downwards to reach 0.6835. Another signal to confirm further descending movement is the price’s rebounding from the resistance level. However, the scenario that implies further decline may be cancelled if the price breaks the upside border of the cloud and fixes above 0.6955. In this case, the pair may continue growing towards 0.7040.
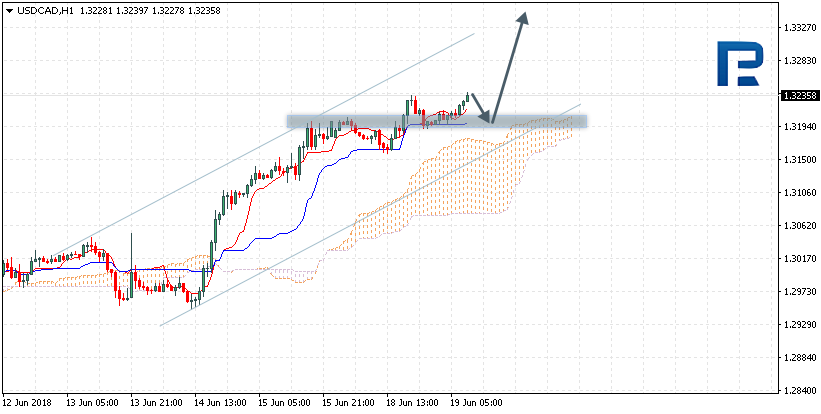
USDCAD, “US Dollar vs Canadian Dollar”
USDCAD is trading at 1.3235; the instrument is moving above Ichimoku Cloud, which means that it may continue growing. The markets could indicate that the price may test Tenkan-Sen and Kijun-Sen at 1.3195 and then continue moving upwards to reach 1.3345. Another signal to confirm further ascending movement is the price’s rebounding from the support level. However, the scenario that implies further growth may be cancelled if the price breaks the downside border of the cloud and fixes below 1.3130. In this case, the pair may continue falling towards 1.3050.
Attention! Forecasts presented in this section only reflect the author’s private opinion and should not be considered as guidance for trading. RoboForex LP bears no responsibility for trading results based on trading recommendations described in these analytical reviews.
Since the euro’s collapse on Thursday during Mario Draghi’s press conference, the daily candlesticks have closed up two days in a row. At the beginning of yesterday’s European session, the euro slid to 1.1565. It then recovered to 1.1620 in the US session, and climbed higher to reach 1.1645 in today’s (Tuesday’s) Asian session. The market’s fluctuations yesterday occurred against the backdrop of an escalation in the trade dispute taking place between the US and China.
US President Donald Trump intends to impose additional tariffs of 10% on 200bn USD of Chinese goods. The Japanese yen and Swiss franc have been enjoying increased demand.
Day’s news (GMT+3):
11:00 Eurozone: current account (Apr), ECB President Draghi’s speech.
11:30 Eurozone: ECB’s Praet speech.
12:00 Eurozone: construction output (Apr).
14:00 Eurozone: ECB’s Praet speech.
15:30 USA: building permits (May), housing starts (May).
23:30 USA: API weekly crude oil stock.
Fid 1. EURUSD hourly chart. Source: TradingView
Current situation:
In today’s Asian session, the euro rose to 1.1645. The trade dispute between the US and China remains the day’s key focus. China has vowed to respond in kind to this new set of US tariffs. The two governments’ inability to find a compromise is pushing investors towards safe haven assets; namely the yen and franc.
The euro didn’t remain at 1.1645 for long. By the opening of today’s European session, the rate had dropped to 1.1603. The euro is under pressure from disagreements over immigration policy in the German coalition government, as well as delays in curtailing the Eurozone’s QE program.
I missed a good entry point this morning. I decided not to try and jump on the moving train. It should turn out as it did yesterday; a 28-pip rebound from the 67th degree and a new high. Moreover, the rate has reached the LB balance line. The 45th degree is at 1.1591, which is getting support from the trend line of the correctional movement. A breakout of the trend line (if the hourly candlestick closes below the line) would open the way towards 1.15.
As we can see in the H4 chart, after being corrected to the upside by 38.2%, XAUUSD has broken the low and started a new descending impulse. The main target of the current downtrend is the post-correctional extension area between the retracements of 138.2% and 161.8% at 1271.90 and 1265.60 respectively.
In the H1 chart, the pair is trading towards the post-correctional extension area between the retracements of 138.2% and 161.8% at 1271.90 and 1265.60 respectively.
USDCHF, “US Dollar vs Swiss Franc”
As we can see in the H4 chart, the convergence made USDCHF complete the downtrend, reverse, and start a new rising impulse, which has already reached the retracement of 76.0% at 0.9992. After breaking the high at 1.0056, the price may reach the post-correctional extension area between the retracements of 138.2% and 161.8% at 1.0106 and 1.0224 respectively. The support level is at 0.9817.
In the H1 chart, the pair is trading towards the retracement of 76.0% at 0.9992. Later, the price may break this level and continue growing to reach the high at 1.0056.
Attention! Forecasts presented in this section only reflect the author’s private opinion and should not be considered as guidance for trading. RoboForex LP bears no responsibility for trading results based on trading recommendations described in these analytical reviews.
Closing out a big week in the markets, we see the US markets rotating a bit lower after a number of news events. Some of these were very positive and others were negative. The take away from last week can be condensed into the following:
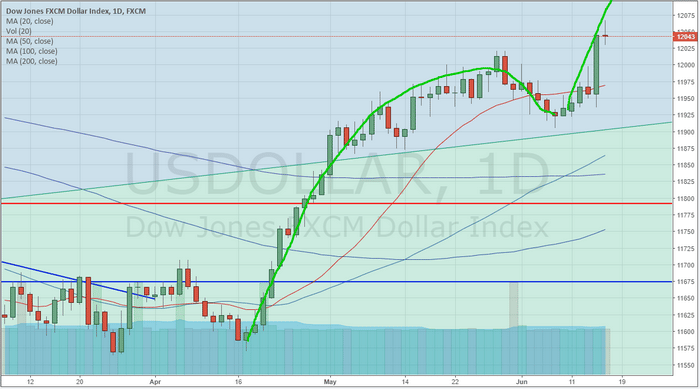
_ The US Dollar strengthened all week and shot up above $120 near the end of the week
_ Crude Oil tanked on Friday – falling nearly 3% to just below $65.00 ppb
_ EURUSD fell nearly 2% on QE concerns in Europe as well as trade issues that are mounting
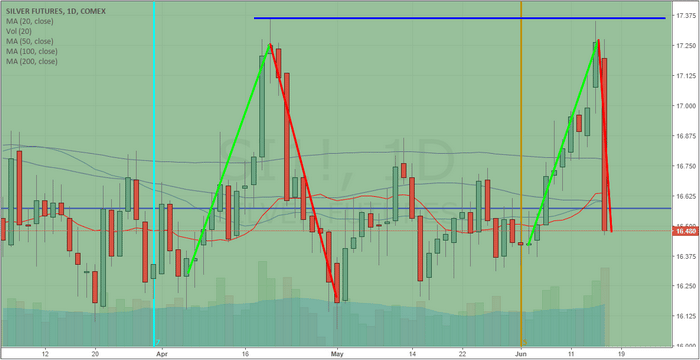
_ Silver rotated lower on Friday (-4.5%) as new tariff announcements between the US and China hit
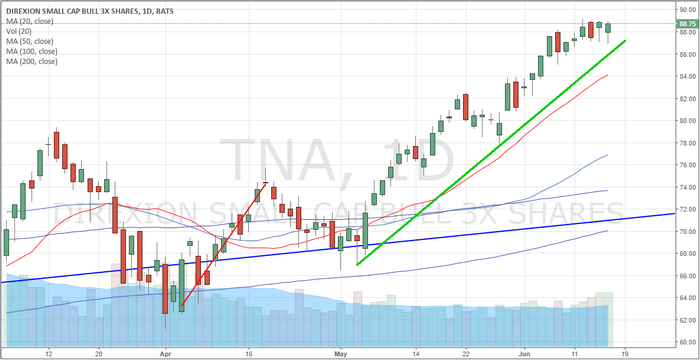
_ US Small Caps held up quite well throughout most of the week ignoring these news events
_ The NQ closed higher for the week while the ES (flat) and YM (lower) were mixed to lower overall
_ China appears to have already entered a downward economic cycle and we’ll have to watch to see how deep this move can actually go before getting too far ahead with our analysis.
When we take into consideration the currency and commodity moves last week, there are two things we can assume headed into this week and beyond.
First, the US Dollar strength will create certain levels of havoc for emerging markets and foreign manufacturing firms, yet the strong US dollar will likely act as a magnet for global investors to continue to pile into the US Equity market rally.
Secondly, the downward rotation in Oil and Metals may create some broad economic pressures in foreign markets that could play out over the next few weeks as fantastic opportunities for skilled investors.
Lower Oil prices puts pressure on foreign oil suppliers, foreign currencies and many emerging markets. The supply glut throughout the world right now is something that will not likely vanish any time soon. This extended pressure on foreign markets may present a potential for some bigger price moves in ETF and certain global markets over the next few weeks or months.
Gold and Silver, on the other hand, appear to be running what we have termed a “rope-a-dope” pattern. Our analysis shows the Metals are poised for a bigger upside breakout move – but this move would likely coincide with some bigger news event that creates broader concern in the global markets. The move high last week started us thinking that this could be a new upside leg forming to create a new near-term price high. But Friday’s pullback was just enough to neutralize the momentum of the upside move (for now). We would not be surprised to see another upside move early over the next few weeks as this pullback may be reactionary in nature and not fundamental.
There are so many dynamics at play right now with trade issues, economic fundamentals, Fed/Central Bank moves and commodities moves all rotating in broad ranges. Our recent analysis has been almost perfect in terms of the Oil moves, the Metals moves and the US Majors price advance. As of right now, nothing has really changed with our analysis and we believe most of the price swings this week were purely reactionary in nature.
Our continued belief is that the US market is really the only game on the planet with a strong US Dollar and a strong/growing economy. Oil pricing concerns will likely result in emerging market and currency issues that could continue to drive investment into the US markets. Gold and Silver will likely continue to play the “rope-a-dope” congestion pattern with a slightly upward price bias until some massive news event sends it skyrocketing higher. US Blue Chips and Small Caps will likely resume their upward trends quickly by taking out recent price highs and stunning the shorts/top-callers again. When you get down to the bottom line of these big news weeks, after all the dust settles – most of the time the core economic fundamentals are the real momentum of the markets. These news events are ripples in price caused by an external force. They go away after a short period of time and the fundamentals kick back in to drive future price moves.
Assuming nothing big hits the news wires to cause any further external events, we believe the US markets will quickly begin to recover their previous trends (higher) and oil will continue to drift lower (to near $60 first, then lower) while Gold and Silver begin to form a new price base for another attempted move higher (again). World leaders are attempting to do all they can to keep the train on the tracks and are stunned at the growth and success of the US economy/markets. Their biggest issue is that they may become second or third tier economies in comparison to the US. All of these dynamics, which are actively playing out right before our eyes, currently are driving capital into the US in an effort to avoid what appears to be a bottomless pit of economic uncertainty in many other nations. This, we believe, is the core dynamic at play in the global markets and we are watching for any signs that some new contagion may set in to change this dynamic.
Our suggestion is to take advantage of the opportunities that are currently available to skilled traders and try not to be too greedy. As we learned, recently, from the EURUSD price drop – these events can unfold very quickly and foolish trading can sometimes put you in very risky positions. We believe it is more suitable for skilled traders to take advantage of larger swing trading opportunities right now and to avoid the high-risk trades. There will be lots of time for those types of trades when the global economic environment settles down a bit more.
53 years experience in researching and trading makes analyzing the complex and ever-changing financial markets a natural process. We have a simple and highly effective way to provide our customers with the most convenient, accurate, and timely market forecasts available today. Our stock and ETF trading alerts are readily available through our exclusive membership service via email and SMS text. Our newsletter, Technical Trading Mastery book, and 3 Hour Trading Video Course are designed for both traders and investors. Also, some of our strategies have been fully automated for the ultimate trading experience.
After a significant decline, EURUSD has started consolidating. Possibly, today the price may reach 1 .1570 and then grow towards 1.1640. Later, the market may fall to break 1.1535 and then continue falling inside the downtrend with the short-term target at 1.1430.
GBPUSD, “Great Britain Pound vs US Dollar”
GBPUSD has broken 1.3300 downwards and is still falling inside the downtrend. The first target is at 1.3160. After that, the instrument may return to 1.3300 and then start another decline with the short-term target at 1.3022.
USDCHF, “US Dollar vs Swiss Franc”
USDCHF has reached the predicted target of the third ascending structure. Today, the price may form a new consolidation range around 0.9966. If later the pair breaks this range to the downside, the market may start another correction towards 0.9904; if to the upside – continue trading upwards to reach 1.0020 or even 1.0108.
USDJPY, “US Dollar vs Japanese Yen”
USDJPY is falling. Today, the price may reach 110.02 and then grow towards 110.45, thus forming a new consolidation range. If later the pair breaks this range to the upside, the market may grow towards 111.11; if to the downside – continue trading to the downside to reach 109.00.
AUDUSD, “Australian Dollar vs US Dollar”
AUDUSD is consolidating around 0.7450. If later the pair breaks this range to the upside, the market may grow towards 0.7540; if to the downside – continue trading to the downside to reach 0.7400.
USDRUB, “US Dollar vs Russian Ruble”
USDRUB is consolidating around 62.56. Possibly, the price may reach 63.52 and then fall towards 62.25. If later the pair breaks this range to the downside, the market may reach 61.57, break it, and then continue trading downwards to reach 59.85.
XAUUSD, “Gold vs US Dollar”
Gold has broken 1288.00 downwards and may continue falling to reach the short-term target at 1252.00. Right now, the price is consolidating. If later the pair breaks this range to the downside, the market may continue falling to reach the above-mentioned target; if to the upside – start another correction to return to 1288.00 and then resume trading to the downside.
BRENT
Brent is falling. Possibly, the price may continue the correction to reach 72.30 and then form a new ascending structure towards 74.88. Later, the market may resume falling towards 71.80 to finish the correction and then start another growth with the target at 82.30.
Attention! Forecasts presented in this section only reflect the author’s private opinion and should not be considered as guidance for trading. RoboForex LP bears no responsibility for trading results based on trading recommendations described in these analytical reviews.
On Friday the 15th of June, trading on the euro closed slightly up. After reaching a new low of 1.1543, prices recovered to 1.1627. The euro corrected on the back of technical factors, which came into play after the publication of mixed US data. The New York and Michigan indices exceeded expectations. Meanwhile, the industrial production index posted a decline.
The US and China haven’t managed to reach an agreement on tariffs. US President Donald Trump announced his decision to impose tariffs on up 50bn USD of Chinese goods. This caused a dip in US10Y bond yields. China intends to respond by imposing its own sanctions on the same value of US products.
Industrial production: -0.1% (forecast: 0.2%, previous reading revised from 0.7% to 0.9%).
NY Empire State manufacturing index: 25 (forecast: 19.1, previous: 20.1).
Day’s news (GMT+3):
13:00 Germany: German Buba monthly report.
17:00 USA: NAHB housing market index (Jun).
20:00 USA: FOMC member Bostic speech.
20:30 Eurozone: ECB president Draghi’s speech.
22:45 USA: FOMC member Williams speech.
Fig 1. EURUSD hourly chart. Source: TradingView
Current situation:
The euro hit a new low in Friday’s European session, but didn’t continue downwards in a sawtooth model. The correction from 1.1543 amounted to 67 degrees. The rate returned to the MA channel. At the time of writing, the euro is trading at 1.1594. Under the current pricing model, there remains a risk of dropping below 1.1543.
In Asia, the US dollar showed mixed dynamics. As trading opened in Europe, a lot of the majors have moved into positive territory. The euro is currently trading down due to the dynamics of the euro crosses.
Considering that the hourly stochastic indicator has returned to the sell zone, my forecast has the euro dropping from 1.1612 to 1.1546 (67 degrees).
Europe’s economic calendar is virtually empty today. A speech from ECB President Mario Draghi is planned for this evening. His speeches at press conferences following ECB meetings tend to have a profound influence in the euro. He’s unlikely to affect the euro today, unless he says that his words on the 14th of June were misinterpreted. In order for us to see a correction across the market, we need to revisit the low of 1.1543.
US Dollar net speculator positions leveled at $-7.42 billion as of Tuesday
The latest data for the weekly Commitment of Traders (COT) report, released by the Commodity Futures Trading Commission (CFTC) on Friday, showed that large traders and currency speculators increased their aggregate bearish bets for the US dollar again this week. See full article
The non-commercial contracts of WTI crude futures totaled a net position of 595,293 contracts, according to data from this week. This was a lift of 11,717 contracts from the previous weekly total. See full article
The large speculator contracts of gold futures totaled a net position of 120,240 contracts. This was a weekly advance of 8,824 contracts from the previous week. See full article
The large speculator contracts of 10-year treasury note futures totaled a net position of -335,994 contracts. This was a weekly increase of 61,552 contracts from the previous week. See full article
The non-commercial contracts of silver futures totaled a net position of 49,730 contracts, according to data from this week. This was a weekly gain of 30,296 contracts from the previous totals. See full article
The large speculator contracts of copper futures totaled a net position of 70,537 contracts. This was a weekly boost of 22,830 contracts from the data of the previous week. See full article
The Commitment of Traders report data is published in raw form every Friday by the Commodity Futures Trading Commission (CFTC) and shows the futures positions of market participants as of the previous Tuesday (data is reported 3 days behind).