In the H4 chart, USDCHF is expected to test the resistance at the 8/8 level, break it, and then continue falling to reach the support at the 5/8 level.
The lines in the H4 and H1 charts are completely the same and confirm the scenario described above.
XAUUSD, “Gold vs US Dollar”
In the H4 chart, XAUUSD is trading below the consolidation range. In this case, the price may continue falling towards the support at the 0/8 level.
The lines in the H4 and H1 charts are completely the same and confirm the scenario described above.
As we can see in the M15 chart, the pair has broken the downside line of the VoltyChannel indicator and, as a result, may continue moving downwards.
Attention! Forecasts presented in this section only reflect the author’s private opinion and should not be considered as guidance for trading. RoboForex LP bears no responsibility for trading results based on trading recommendations described in these analytical reviews.
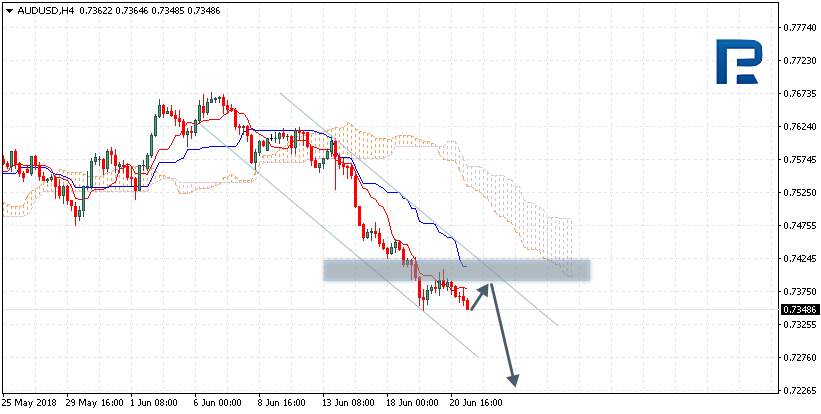
AUDUSD is trading at 0.7348; the instrument is moving below Ichimoku Cloud, which means that it may continue falling. The markets could indicate that the price may test Tenkan-Sen and Kijun-Sen at 0.7385 and then continue moving downwards to reach 0.7265. Another signal to confirm further descending movement is the price’s rebounding from the channel’s upside border. However, the scenario that Implies further decline may be cancelled if the price breaks the upside border of the cloud and fixes above 0.7480. In this case, the pair may continue growing towards 0.7585.
NZDUSD, “New Zealand Dollar vs US Dollar”
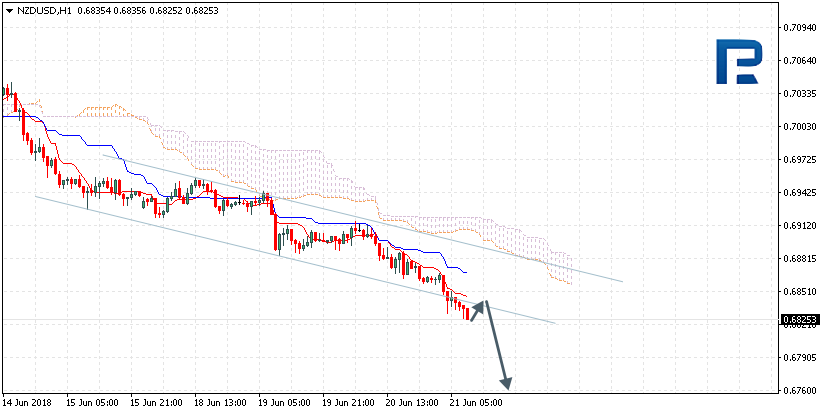
NZDUSD is trading at 0.6825; the instrument is moving below Ichimoku Cloud, which means that it may continue falling. The markets could indicate that the price may test Tenkan-Sen and Kijun-Sen at 0.6845 and then continue moving downwards to reach 0.6760. Another signal to confirm further descending movement is the price’s rebounding from the channel’s downside border. However, the scenario that implies further decline may be cancelled if the price breaks the upside border of the cloud and fixes above 0.6910. In this case, the pair may continue growing towards 0.7050.
USDCAD, “US Dollar vs Canadian Dollar”
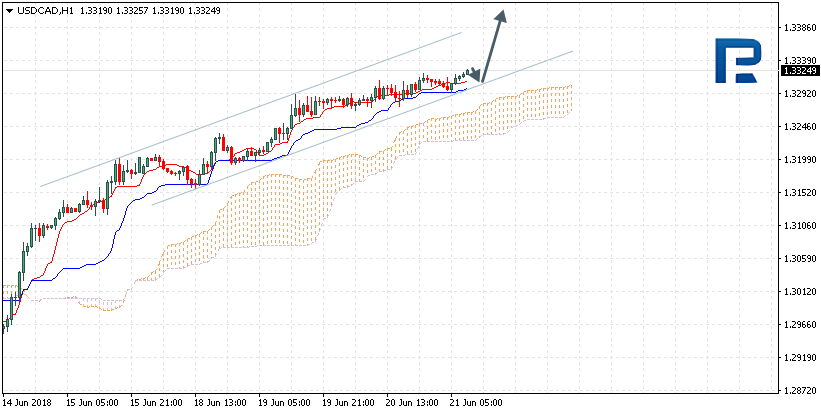
USDCAD is trading at 1.3324; the instrument is moving above Ichimoku Cloud, which means that it may continue growing. The markets could indicate that the price may test Tenkan-Sen and Kijun-Sen at 1.3315 and then continue moving upwards to reach 1.3435. Another signal to confirm further ascending movement is the price’s rebounding from the channel’s downside border. However, the scenario that implies further growth may be cancelled if the price breaks the downside border of the cloud and fixes below 1.3200. In this case, the pair may continue falling towards 1.2990.
Attention! Forecasts presented in this section only reflect the author’s private opinion and should not be considered as guidance for trading. RoboForex LP bears no responsibility for trading results based on trading recommendations described in these analytical reviews.
On Wednesday the 20th of June, trading on the euro closed slightly down at 1.1570. In general, the statements of the heads of the Central Bank at the conference in Portugal did not have a noticeable effect on major currencies. During the European session, the euro fell to 1.1537. When the US session came around, the price corrected to 1.1600.
US data:
Existing home sales (May): 5.43m (forecast: 5.52m, previous reading revised from 5.46 to 5.45).
Current account (Q1): 124.1bn (forecast: 129bn, previous reading revised from 128.2bn to 116.2bn).
Day’s news (GMT+3):
10:30 Switzerland: SNB interest rate decision.
11:30 Switzerland: SNB press conference.
11:30 UK: Public sector net borrowing (May).
14:00 UK: BoE interest rate decision.
16:30 US: Philadelphia Fed manufacturing survey (Jun).
23:15 UK: BoE’s Governor Carney speech.
OPEC+ meeting.
Fig 1. EURUSD hourly chart. Source: TradingView
Current situation:
The euro/dollar pair is maintaining lateral movement in a channel with a range of 116 pips. A local channel has formed inside the main channel. The balance line is acting as a resistance for buyers at 1.16.
Given that the US dollar is trading up against major currencies in Asia, I expect the euro to fall to 1.1553 ahead of the announcement of the BoE’s monetary policy decision. The British pound will be shaken if the number of votes for raising and keeping rates as they are changes. Moreover, the BoE meeting will affect the euro’s movements on the euro/pound cross. If the level of 1.1543 is successfully passed, then from there a drop to 1.1517 may occur.
Tensions in the US-China trade confrontation have temporarily eased, but keep an ear to the ground, as retaliatory measures from China are expected.
An Open House insight from our Currency Pro Service editor
By Elliott Wave International
Every week, our Currency Pro Service editor, Jim Martens, records a new video focusing on EURUSD, USDJPY and other markets. Learn why “the next day or two” should determine the next move in the euro in this clip from Jim’s June 17 video.
Pro Services Open House – June 18-24
We’re opening the doors to our entire line of our trader-focused Pro Services.
During our Open House, you’ll get our most nimble, opportunity-rich, professional-grade forecasts for 50 of the world’s top markets — many 24 hours a day, complete with Elliott-wave charts and analysis to help you time your market moves with precision.
This article was syndicated by Elliott Wave International and was originally published under the headline EURUSD: Why the “Next Day or Two” are Critical. EWI is the world’s largest market forecasting firm. Its staff of full-time analysts led by Chartered Market Technician Robert Prechter provides 24-hour-a-day market analysis to institutional and private investors around the world.
Well over a month ago we warned our followers of a “capital market shift” that was taking place in the global markets. Nearly 3 months before that time, we warned that China’s economy was about to enter a sustained economic downtrend cycle that could be dangerous to the global markets. Today, we offer further evidence that the global markets are, in fact, shifting away from a price correlation to the US stock market and this move could be a warning sign that emerging markets and global markets could lead the world into an extended stagflation cycle.
Think about this for a minute, as we briefly discussed in our last article, what would happen if the US markets continued to rally on a strong economy with strong consumer participation while the US Fed was slow to raise interest rates while supporting a transitional shift of the US economy towards more manufacturing, technology, and expectations? How would the world’s economies react to such a shift given their current economic cycles and opportunities? Would they be able to keep up with the US or would they start to trail further and further behind the US?
It is our belief that any continued strengthening of the US economy could, in fact, present real dangers for many of the world’s economies simply because they may fall completely out of sync with the US stock market as their currencies, economies and consumer expectations fail to keep up with the US capabilities. How all of this will play out over the next few months/years is our concern. We know it will result in some tremendous trading opportunities for investors, but it could also create a new class of undervalued assets that could present some real long-term opportunity over the next 20+ years.
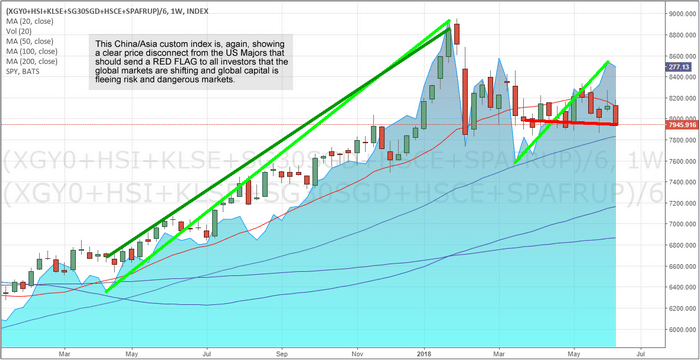
Let’s start by taking a look at our China/Asia custom index to show how the past 60+ days have more clearly shown this price disconnect happening. When you look at this chart, pay attention to how closely this custom index (the candles) have moved in relation to the SPY (the blue area chart overlaid onto the candles). Notice how the moves in the SPY were relatively closely mirrored by the custom index. This is a direct price correlation to the SPY over an extended period of time.
Now, focus on the last 6~9 bars on this chart and take a really close look at how the SPY has rallied higher while this custom index has stayed flat to lower over the same time frame. The only answer for this type of price disconnect is that a global capital shift could be underway that is driving capital out of certain markets and away from risk and danger. In other words, it is our opinion that the China/Asia markets are starting to be perceived as riskier and more dangerous in relation to the US market and other more mature markets.
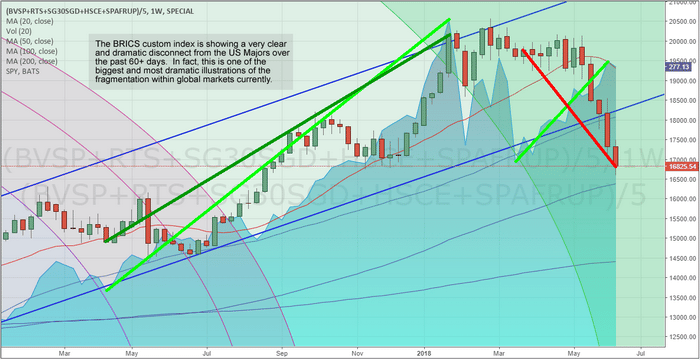
Now, let’s take a look at the BRICS custom index. YIKES!! What happened here? Through most of 2017, a price correlation can be seen where the BRICS index moved somewhat in unison with the SPY price activity – although in some cases a bit delayed. Yet, after March 2018, something dramatic happened. When the SPY rotated lower in late March 2018, the BRICS index stayed relatively flat near the highs. Then in May 2018, a price disconnect became very evident as the SPY began to rally while the BRICS index began to sell-off – very dramatically. The BRICS index also broke through the BLUE price channel recently which is another sign that price trends/activities have shifted.
You should now be starting to see what we have been warning you about for months – the global capital market shift that is taking place. This is happening because mature nations and economies are capable of achieving great economic growth and stability than many foreign markets and because many foreign markets have squandered the last 10+ years attempting to expand externally and not support their fundamental economic needs. As we have used this example before, a flower only has two modes of operation – flower mode (expand) or survive (keep the core plant alive). We believe these foreign markets have been in “flower mode” for the past 10+ years and have failed to support the core elements of their economies.
Now, onto more examples, this time Western Europe. Again, this custom index is weighted with the SPY, so it should reflect some of the price support of the recent uptrend. Yet, we see the most recent few weeks of this chart have shown a dramatic downtrend? This would indicate that the European markets/currencies are disconnecting from the US majors at a much more dramatic pace, recently, that they have been over the past few years. Yikes!
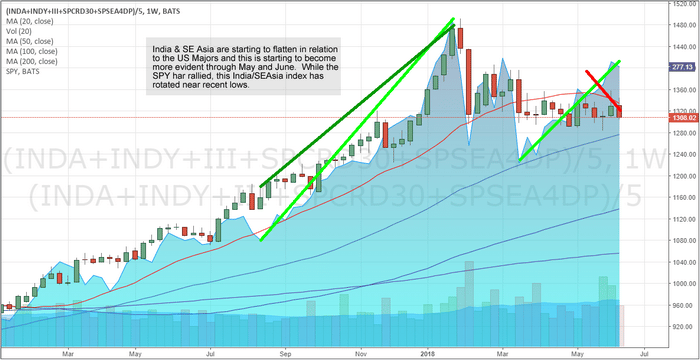
What about India & SE Asia? Our custom India index has shown relatively FLAT recent price activity compared to the SPY. Overall, our opinion is that India has yet to completely diverge from the US majors and we urge all investors to be aware that any further price breakdown in this India custom index will warn that the Indian/SE Asian economies are losing their battle to stay correlated to the US markets going forward. Right now, there is evidence of weakness in the India custom index – yet there are limited signs of a broken correlation to the US markets. It certainly shows that this price disconnect could be happening and likely is happening – yet we don’t have clear signs that this custom index is breaking to new lows (yet).
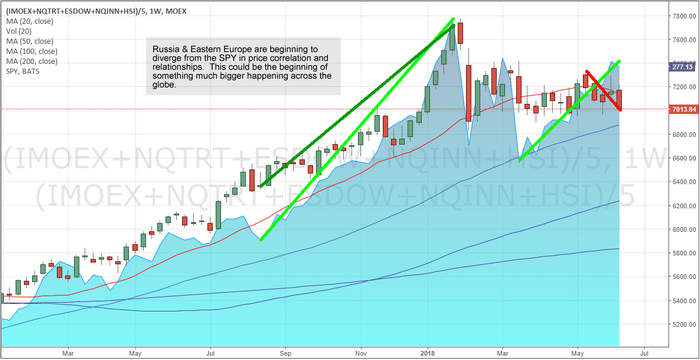
Lastly, lets take a look at our Russia/Eastern Europe custom index for signs of a price disconnect. This chart is somewhat similar to the India chart (above). There are signs of weakness and downside price rotation while the SPY has been rallying, yet there is not massive disconnect evident on the right edge of the chart. We believe the recent downside price rotation within this custom index are the early warning signs of a price disconnect in the early stages of setting up (just like in the India chart). We believe these charts clearly show that the US market (and other mature economies) are advancing beyond the functional capabilities of many emerging and foreign markets. What will come from this, if it continues to play out as we expect, is a huge number of opportunities for traders and investors.
The next 3 to 5 years are likely to be very interesting and exciting for traders and investors. These types of moves don’t happen too often and should these markets continue to rotate as we are expecting, we could see some very big currency and foreign market moves over the next few months and years. You owe it to yourself to stay ahead of this move and learn how to profits from the extended volatility that will likely result from this price disconnect.
We believe we have nailed this analysis as we have correctly called the weakness in China/Asia as well as the global capital shift that is starting to play out in the global markets. We already know what will likely move and when we should expect these opportunities to set up. We are preparing our valued subscribers for this move and protecting them by providing them even more detailed research and analysis than you are seeing here. Visit www.TheTechnicalTraders.com to learn how this could be the biggest opportunity of your trading and investing life and how you need a qualified and dedicated team of researchers to help you stay ahead of these moves over the next 2+ years with our long-term discounted subscription plan and Save 39%. There will come a time when you will be wishing you had access to our proprietary research and member-only trade alerts and investment positions. Become a technical trader today and prosper with us!
As we can see in the H4 chart, GBPUSD has broken the short-term low and right now is still being corrected downwards. The targets of this decline may be inside the post-correctional extension area between the retracements of 138.2% and 161.8% at 1.3102 and 1.3040 respectively. The resistance level is at 1.3480.
In the H1 chart, the pair is falling towards the post-correctional extension area between. At the same time, the convergence is being formed, which indicates a possible pullback after the price reaches its targets.
EURJPY, “Euro vs. Japanese Yen”
As we can see in the H4 chart, EURJPY has already been corrected by 61.8% and may continue trading towards the retracement of 76.0% at 126.00, the short-term upside targets are at 128.15 and 129.00.
In the H1 chart, the convergence made the pair reverse and start a new correction to the upside, which has already reached the retracement of 23.6%. In the future, this growth may continue towards the retracements of 38.2%, 50.0%, and 61.8% at 128.97, 128.50, and 128.93 respectively.
Attention! Forecasts presented in this section only reflect the author’s private opinion and should not be considered as guidance for trading. RoboForex LP bears no responsibility for trading results based on trading recommendations described in these analytical reviews.
After reaching 1.1535, EURUSD has completed the correction to the upside and returned to 1.1595. Possibly, today the price may form another descending structure. The next target is at reach 1.1480. Later, the market may grow towards 1.1535 and then fall with the target at 1.1430.
GBPUSD, “Great Britain Pound vs US Dollar”
GBPUSD is moving downwards. Possibly, the pair may be corrected towards 1.3255 and then fall to reach 1.3066. After that, the instrument may start another correction to return to 1.3160 and then resume its decline with the target at 1.3022.
USDCHF, “US Dollar vs Swiss Franc”
USDCHF is consolidating again. Possibly, the pair may fall to reach 0.9900. Later, the market may break the range to the upside and then continue trading upwards to reach 1.0020.
USDJPY, “US Dollar vs Japanese Yen”
USDJPY is trading to rebound from 109.58; it is consolidating in the center of the range. If later the pair breaks this range to the downside, the market may fall towards 109.40; if to the upside – continue trading upwards to reach 111.11. According to the main scenario, the price is expected to continue trading downwards with the target at 107.90.
AUDUSD, “Australian Dollar vs US Dollar”
AUDUSD is falling. Possibly, the pair may reach the short-term target at 0.7345 and then start another correction towards 0.7480. After that, the instrument may resume trading to the downside to reach the main target of this wave at 0.7292.
USDRUB, “US Dollar vs Russian Ruble”
USDRUB has expanded its consolidating channel upwards. Possibly, today the price may fall towards 62.56 and then form another ascending structure to reach 64.24. Later, the market may continue trading downwards with the target at 62.56.
XAUUSD, “Gold vs US Dollar”
Gold has formed another consolidation range around 1277.00. According to the main scenario, the price is expected to continue trading downwards to reach 1240.00 and then start a new correction with the target at 1304.00.
BRENT
Brent is still being corrected inside the Flag pattern. Today, the price may form another descending structure to reach 71.80 and then resume growing towards the first target at 76.90.
Attention! Forecasts presented in this section only reflect the author’s private opinion and should not be considered as guidance for trading. RoboForex LP bears no responsibility for trading results based on trading recommendations described in these analytical reviews.
Our articles, Technical Trading Mastery book, and 3 Hour Trading Video Course are designed for both traders and investors to explore the tools and techniques that discretionary and algorithmic traders need to profit in today’s competitive markets. Created with the serious trader and investor in mind – whether beginner or professional – our approach will put you on the path to win. Understanding market structure, trend identification, cycle analysis, volatility, volume, when and when to trade, position management, and how to put it all together so that you have a winning edge.
On Tuesday the 19th of June, trading on the euro closed down. After an upwards correction to 1.1645, the euro slid to 1.1531 (-114 pips) during the European session. The greenback climbed across the board on the back of an escalation to trade dispute taking place between China and the US, piling further pressure on the EURUSD pair. Mario Draghi’s comments also weighed on the euro, although this news is playing second fiddle to the trade war. When the US session came around, the rate corrected to 1.1596.
16:30 Australia: RBA’s Governor Philip Lowe speech.
17:00 USA: existing home sales (May).
17:30 USA: EIA crude oil stocks (15 Jun).
Fig 1. EURUSD hourly chart. Source: TradingView
The euro dropped to the 90th degree in the space of 6 hours. The rebound from the 45th degree amounted to 45 degrees. Growth was held up by the horizontal Gann level along with the balance line. At the time of writing, the euro is trading at 1.1581.
I think that pressure on the euro is going to remain in place. The real question is whether it’s going to start declining straight away or a few days from now. I also considered that the pair might consolidate within the channel (dashed lines) in a range of 1%. On the current hour, its boundaries are at 1.1523 and 1.1638.
Today (Wednesday), it’s worth keeping an eye on all the speeches from the heads of central banks; with Powell, Kuroda, Lowe, and Draghi all set to speak. Their words could turn out to have no influence on markets, but it’s better to be prepared for a surge in volatility just in case.
Considering that the euro crosses were all declining when I made my forecast, I expect the euro to drop to 1.1518. The lower line of the channel will act as a support.
The hourly stochastic indicator is in the buy zone. This means that the drop may be delayed for 4 – 5 hours. The AO and CCI are both in neutral territory, so the euro will follow the lead of other currencies. At the moment, most currencies are trading down against the US dollar. The dollar is recouping its losses against the yen and franc.
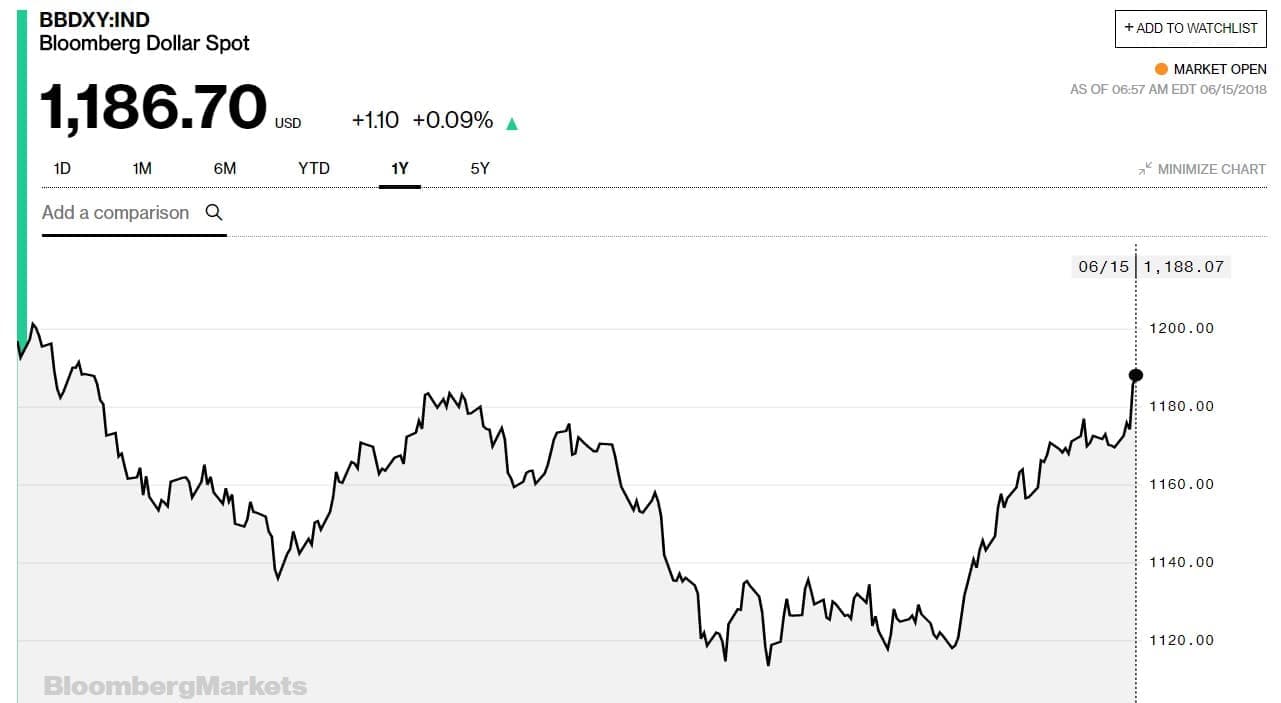
The U.S. dollar has jumped to its strongest level in nearly a year, raising questions about how a strong greenback could act as a drag on debt and oil demand in much of the world.
The U.S. Federal Reserve announced another rate hike a few days ago, which helped edge up the dollar to a new high for the year.
The greenback has “a little room to run,” Kathy Jones, a New York-based chief fixed-income strategist at Charles Schwab, said in a Bloomberg interview. “We have seen softer numbers out of Europe and firmer numbers out of the U.S.” The U.S. Federal Reserve is unwinding its extraordinary monetary intervention after a decade of near-zero interest rates. The Fed has announced quarter-point interest rate hikes twice and is planning on at least two additional increases this year.
Meanwhile, the European Central Bank is heading in the other direction in an effort to keep sovereign bond yields from spiraling out of control, particularly after the recent political turmoil in Italy unnerved bond markets on the continent. The ECB said it would keep interest rates low through at least next summer.
The diverging policy paths for the two central banks points to a further strengthening of the dollar relative to the euro. The Bloomberg Dollar Spot Index jumped to 1,187 in early trading on Friday, the highest level since July 2017. The greenback has strengthened about 6 percent in the past two months.
Source: Bloomberg
“(ECB President Mario) Draghi came out a little bit more dovish than people thought he was going to be. And that really caused the euro to take a dip and the (U.S.) dollar to go up, which is putting downward pressure on prices,” Phil Flynn, analyst at Price Futures Group in Chicago, told Reuters.
There are plenty of factors influencing oil prices right now, and the OPEC+ decision expected in a few days will be the single most important driver in the near-term. But the U.S. dollar is one important variable influencing oil prices. A stronger dollar helps push down prices because it makes oil, which is priced in dollars, much more expensive in much of the world.
Moreover, emerging markets now account for a majority of oil demand, and nearly all of the growth in oil demand. More specifically, additional consumption over the next few decades is expected to overwhelmingly come from China and India. In 2018, the two countries have accounted for nearly 70 percent of oil demand growth.
As a result, actions from the Fed reverberate through the oil markets. Higher oil prices act as a drag on demand, but a stronger greenback magnifies the expense in local currency.
Some governments are desperate to shield their economies from higher prices. As Reuters notes, the price of a liter of diesel in India is up 27 percent from a year ago, which, while costly, is actually subdued given the 70 percent increase in Brent prices over that time period. The Indian government is stepping in to blunt the impact of higher fuel prices, at great expense to public coffers.
The IEA said last week that oil demand is set to grow by 1.4 million barrels per day (mb/d) in each of 2018 and 2019, although that forecast was vulnerable to several potential pitfalls. “Of course, there are downside risks: these include the possibility of higher prices, a weakening of economic confidence, trade protectionism and a potential further strengthening of the US dollar,” the IEA wrote.
We have already seen some flashpoints flare up this year as a result of both higher fuel prices and currency problems, and while there are always multiple causes to such events, the strength of the U.S. dollar cannot be discounted. In Argentina, the peso lost nearly a quarter of its value relative to the dollar, forcing the government to seek a financial rescue from the IMF. In Brazil, crippling protests over high fuel prices paralyzed the country – prices were particularly painful for the truckers staging the strikes because Brazil’s currency lost nearly 15 percent of its value relative to the dollar, exacerbating the rise in oil prices.
“Currency risks are also mounting for several emerging market economies and some OECD countries,” the IEA wrote in its report. “For example, between the start of April and the end of May, the Argentinian peso has depreciated by 24% versus the US Dollar, the Brazilian real by 12.6%, the Mexican peso by 9.7%, the Russian ruble by 9.2%, the Turkish lira by 14.4%, the South African rand by 7.3% and the euro by 5.4%.”
This currency turmoil threatens oil demand growth. “These depreciations forced some countries to increase interest rates to defend their currency, which could weigh on growth in due course,” the IEA concluded.