Author Archive for InvestMacro – Page 401

Small Caps, Technology and Pharma to drive a renewed market rally

By TheTechnicalTraders.com

We’ve been warning our followers not to become frightened by price rotation in the US majors for months.  Our predictive analysis has been showing us the upside in this market is far from over and our most recent analysis of the global markets is showing us that emerging markets and many global markets may be “disconnecting” from the US majors in a dramatic price move.  See our most recent research posts for more on this potential crisis in the making.

Today, we want to alert you to the fact that the move in the US majors may not be over and we could be looking at many weeks or months of upside price bias with some 3~6% price rotations going forward.  As we’ve been trying to warn our followers, there are a bunch of “top sellers” in this market because many believe this market is well overextended and has already reached an Elliot Wave 5 completion.  Our analysis is saying this is simply incorrect and these professionals are failing to see the alternative perspective in the markets.  What if their “completed wave 5” is really just a larger “Wave A” formation or a completed Wave 3 or 5 – which would lead to much higher and longer upside price potential than anyone has imagined.

Still, with a bit of a chuckle, we read the news that some of these professionals were taking larger positions as “short sellers” and read their comments about “this is it – this is the top of the market”.  We posted our analysis and stood by our belief that this market continues to have upside potential and the reasoning behind our belief is relatively clear.  The global markets have been primed by more than $16 trillion in quantitative measures and many foreign and emerging markets have squandered the opportunity to secure solid fundamental economic opportunities for their future.  Very few global economies have the capacity for growth that the US and other mature/major markets have.  It is because of this current economic situation that the US and other mature/major markets will be viewed as the “only suitable economic investment on the planet” for a while and capital will continue to run into these markets as a source of protection and returns.

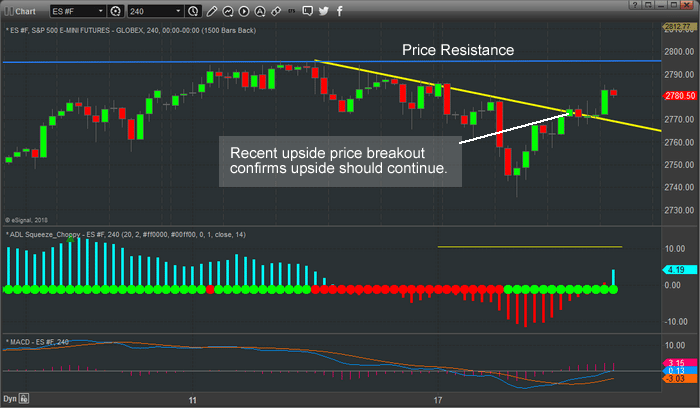
This ES (E-Mini S&P) chart (240 minute) shows the recent price decline over the past week that had many people very worried about a massive top formation.  You can see this decline was relatively muted compared to the previous upside move.  Over the past few days, the ES retested and broke above the downward resistance channel (in yellow) and is headed back towards the Price Resistance level just below 2800.  This price level is likely to be reached within a few days and breached as the ES, YM, and Transportation related markets should push dramatically higher over the next few weeks.


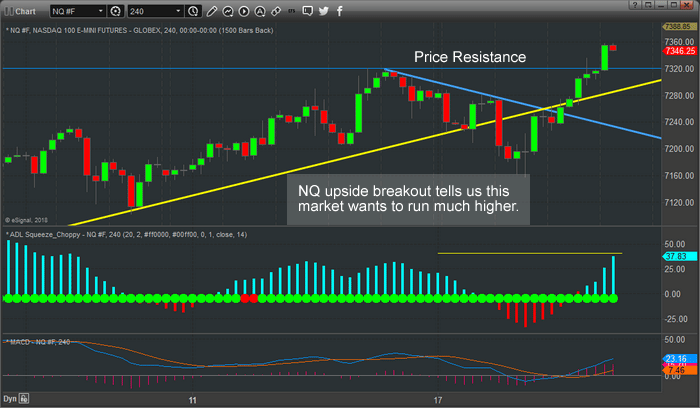
This NQ 240 minute chart shows the same time-span, yet it shows the dramatic upside price breakout in the technology, pharma, and small-cap related indexes.  Why are these markets a large driving force in this upside rally?  Because capital is searching for suitable investments in US equities for protection and gains.  Many of the FANGS and other major market symbols have already seen huge gains over the past 4+ year, yet there are hundreds of other suitable, less pricey symbols available in the realm of Small Caps, Technology and Biotech/Pharma and others.  Simply put, money is hunting for US based investment in suitable companies for simple reasons – protection from currency devaluations, protection from political turmoil and potential returns.  There is only one place to go, the US stock market.


Lastly, we want to warn our followers that the NQ may stall a bit in an upside bias over the next few days or weeks while the ES, YM, and Transport related equities see bigger gains over the same time-span.  It is our opinion that as this rally continues, the NQ will likely see a bit slower price acceleration as the DOW, S&P and Transport stocks pick up momentum.  We are not saying the upside move in the NQ is over.   We are suggesting that it may be a bit more muted going forward while other symbols pick up the slack and rally higher.

Our valued members get access to clear and direct predictive analysis using our proprietary Adaptive Learning price modeling systems.  This helps them know what to expect Days, Weeks and even Months in advance.  Our ADL price modeling system is telling us that our analysis future NQ price activity consists of 17 instances of correlative price data that average between 80% to 97% predictive probability of success going forward 20 price bars.  To simplify this for our readers, we have a future price analysis with an 85% to 95% probability of success given 17 instances of similar price data.


Our members are uniquely positioned right now to take advantage of this without excessive risk.  We will continue to evaluate new trades with regards to the potential for success while considering risk.  Our objective is to not overweight our positions too heavily into one aspect of the market.

Although, we will add that once confirmation of this move is evident, we may find multiple opportunities for quick profitable trades for our members.  Get ready for some exciting price action and for this next move which most people are not expecting.

Our articles, Technical Trading Mastery book, 3 Hour Trading Video Course, and our Trade Alert Newsletter are designed for both traders and investors to explore the tools and techniques that discretionary and algorithmic traders need to profit in today’s competitive markets. Created with the serious trader and investor in mind – whether beginner or professional – our approach will put you on the path to win. Understanding market structure, trend identification, cycle analysis, volatility, volume, when and when to trade, position management, and how to put it all together so that you have a winning edge.

JOIN US THIS WEEKEND AND TRADE YOUR WAY TO WEALTH THIS SUMMER!

By TheTechnicalTraders.com


COT Report: Speculators move huge in favor of USD. Crude, Gold, VIX bets fall more

By CountingPips.com – Receive our weekly COT Reports by Email

Here is a short summary and this week’s links (below) to the latest Commitment of Traders changes that was released on Friday.


Forex Speculators sharply raised US Dollar bets into new bullish position

US Dollar net speculator positions leveled at $8.64 billion as of Tuesday

The latest data for the weekly Commitment of Traders (COT) report, released by the Commodity Futures Trading Commission (CFTC) on Friday, showed that large traders and currency speculators sharply boosted their bets for the US dollar into the first bullish aggregate position in over a year. See full article


WTI Crude Oil Speculators continued to reduce their bullish bets this week

The non-commercial contracts of WTI crude futures totaled a net position of 580,947 contracts, according to data from this week. This was a slide of -14,346 contracts from the previous weekly total. See full article


Gold Speculators cut back on their bullish bets again this week

The large speculator contracts of gold futures totaled a net position of 96,512 contracts. This was a weekly decline of -23,728 contracts from the previous week. See full article


10-Year Note Speculators raised their bearish bets for 1st time in 3 weeks

The large speculator contracts of 10-year treasury note futures totaled a net position of -359,463 contracts. This was a weekly reduction of -23,469 contracts from the previous week. See full article


S&P500 Mini Speculators upped their bullish bets for 3rd week

Speculative bets increased for the third straight week this week to the highest level in five weeks. See full article


Silver Speculators cut back on bullish net positions for 1st time in 7 weeks

The non-commercial contracts of silver futures totaled a net position of 40,902 contracts, according to data from this week. This was a weekly fall of -8,828 contracts from the previous totals. See full article


Copper Speculators sharply dropped bullish bets after 2 strong weeks

The large speculator contracts of copper futures totaled a net position of 56,311 contracts. This was a weekly shortfall of -14,226 contracts from the data of the previous week. See full article


Article by CountingPips.com – Receive our weekly COT Reports by Email

The Commitment of Traders report data is published in raw form every Friday by the Commodity Futures Trading Commission (CFTC) and shows the futures positions of market participants as of the previous Tuesday (data is reported 3 days behind).

To learn more about this data please visit the CFTC website at http://www.cftc.gov/MarketReports/CommitmentsofTraders/index.htm


Forex Speculators sharply raised US Dollar bets into new bullish position

By CountingPips.comGet our weekly COT Reports by Email

US Dollar net speculator positions jumped to $8.64 billion this week

The latest data for the weekly Commitment of Traders (COT) report, released by the Commodity Futures Trading Commission (CFTC) on Friday, showed that large traders and currency speculators sharply boosted their bets for the US dollar into the first bullish aggregate position in over a year.

Non-commercial large futures traders, including hedge funds and large speculators, had an overall US dollar net position totaling $8.64 billion as of Tuesday June 19th, according to the latest data from the CFTC and dollar amount calculations by Reuters. This was a weekly rise of $16.06 billion from the $-7.42 billion total position that was registered the previous week, according to the Reuters calculation (totals of the US dollar contracts against the combined contracts of the euro, British pound, Japanese yen, Australian dollar, Canadian dollar and the Swiss franc).

This week’s rise in US dollar bets brought the aggregate position out of forty-eight straight weeks of bearish positions into the highest bullish level for the dollar since May 16th of 2017 when the aggregate level was $13.5 billion. The turn into a dollar bullish level was made possible by speculators sharply bailing out of (and/or turning more bearish on) many of the major currencies by the tens of thousands this week (see more below).

Weekly Speculator Contract Changes:

This week represented a gigantic week of swings in the major currency futures positions. We saw six substantial changes (+ or – 10,000 contracts) in the individual currency contract levels for the speculators category.

EuroFX bets dropped extremely sharply by over -50,000 contracts this week and by the most on record. The euro bets have now fallen for nine straight weeks and by a total of -115,358 contracts over that time-frame after making a record high bullish level on April 17th

Pound Sterling bets fell by more than -30,000 contracts this week and the standing fell into a new bearish position. This is the first bearish position for the GBP since November of 2017

Japanese yen bets dropped by over -40,000 bets this week and also fell into a bearish position. This brings the JPY to the most bearish level since March 13th of this year

Australian dollar contracts plunged by over -27,000 contracts this week and pushed the current position (12 straight weeks of bearish levels) to the most bearish spot since December 1st of 2015

New Zealand dollar positions decreased by over -22,000 net contracts this week and fell back into a bearish standing for first time in four weeks

Mexican peso speculative bets rose by over +10,000 contracts this week following sharp declines for nine straight weeks. The peso position remains in bearish territory for a third straight week

Overall, the major currencies that declined against the US dollar this week were the euro (-52,107 weekly change in contracts), British pound sterling (-30,175 contracts), Japanese yen (-40,614 contracts), Australian dollar (-27,864 contracts) and the New Zealand dollar (-22,946 contracts).

The currencies whose speculative bets improved this week versus the dollar were the Swiss franc (5,288 weekly change in contracts), Canadian dollar (974 contracts) and the Mexican peso (10,435 contracts).


Table of Weekly Commercial Traders and Speculators Levels & Changes:

CurrencyNet CommercialsComms Weekly ChgNet SpeculatorsSpecs Weekly Chg
EuroFx-42,90354,62336,118-52,107
GBP33,79233,972-19,206-30,175
JPY45,01733,241-35,562-40,614
CHF55,128-6,216-31,9575,288
CAD-6,284-26,325-14,014974
AUD60,54831,482-43,099-27,864
NZD20,33123,952-15,940-22,946
MXN15,311-9,696-11,26510,435


This latest COT data is through Tuesday and shows a quick view of how large speculators or non-commercials (for-profit traders) as well as the commercial traders (hedgers & traders for business purposes) were positioned in the futures markets. All currency positions are in direct relation to the US dollar where, for example, a bet for the euro is a bet that the euro will rise versus the dollar while a bet against the euro will be a bet that the dollar will gain versus the euro.


Weekly Charts: Large Trader Weekly Positions vs Price

EuroFX:


British Pound Sterling:


Japanese Yen:


Swiss Franc:


Canadian Dollar:


Australian Dollar:


New Zealand Dollar:


Mexican Peso:

*COT Report: The weekly commitment of traders report summarizes the total trader positions for open contracts in the futures trading markets. The CFTC categorizes trader positions according to commercial hedgers (traders who use futures contracts for hedging as part of the business), non-commercials (large traders who speculate to realize trading profits) and nonreportable traders (usually small traders/speculators). Find CFTC criteria here: (http://www.cftc.gov/MarketReports/CommitmentsofTraders/ExplanatoryNotes/index.htm).

The Commitment of Traders report is published every Friday by the Commodity Futures Trading Commission (CFTC) and shows futures positions data that was reported as of the previous Tuesday (3 days behind).

Each currency contract is a quote for that currency directly against the U.S. dollar, a net short amount of contracts means that more speculators are betting that currency to fall against the dollar and a net long position expect that currency to rise versus the dollar.

(The charts overlay the forex closing price of each Tuesday when COT trader positions are reported for each corresponding spot currency pair.) See more information and explanation on the weekly COT report from the CFTC website.

Article by CountingPips.com


Fibonacci Retracements Analysis 22.06.2018 (BITCOIN, ETHEREUM)

Article By RoboForex.com

BTCUSD, “Bitcoin vs US Dollar”

As we can see in the H4 chart, BTCUSD is trading upwards; after the correction reached the retracement of 38.2%, the pair has started moving sideways. After completing this sideways movement, the price may trade towards the retracements of 50.0% and 61.8%. In case the pair breaks the low at 6120.30, the instrument may fall to reach the retracement of 261.8% at 5860.00.

BTCUSD1
Risk Warning: the result of previous trading operations do not guarantee the same results in the future

The H1 chart shows the sideways correction, which has already reached the retracement of 38.2%. The next target may be the retracement of 50.0%.

BTCUSD2
Risk Warning: the result of previous trading operations do not guarantee the same results in the future


ETHUSD, “Ethereum vs. US Dollar”

As we can see in the H4 chart, the convergence made ETHUSD start a new pullback, which has already reached the retracement of 23.6%. The next upside target is the retracement of 38.2%. After that, the instrument may continue trading towards the post-correctional extension area between the retracements of 138.2% and 161.8%.

ETHUSD1
Risk Warning: the result of previous trading operations do not guarantee the same results in the future

In the H1 chart, ETHUSD is being corrected downwards to reach the retracements of 50.0% and 61.8%.

ETHUSD2
Risk Warning: the result of previous trading operations do not guarantee the same results in the future

Article By RoboForex.com

Attention!
Forecasts presented in this section only reflect the author’s private opinion and should not be considered as guidance for trading. RoboForex LP bears no responsibility for trading results based on trading recommendations described in these analytical reviews.

Forex Technical Analysis & Forecast 22.06.2018 (EURUSD, GBPUSD, USDCHF, USDJPY, AUDUSD, USDRUB, GOLD, BRENT)

Article By RoboForex.com

EURUSD, “Euro vs US Dollar”

EURUSD has failed to fix below 1.1530; it has formed a new ascending impulse and may choose an alternative scenario to continue the correction. Possibly, today the price may be corrected towards 1.1570. After breaking 1.1623, the instrument may continue trading upwards with the first target at 1.1744.

EURUSD
Risk Warning: the result of previous trading operations do not guarantee the same results in the future


GBPUSD, “Great Britain Pound vs US Dollar”

GBPUSD has formed a new ascending impulse and may choose an alternative scenario to start another correction.  Today, the price may fall to reach 1.3190 and then resume its growth with the first target at 1.3433.

GBPUSD
Risk Warning: the result of previous trading operations do not guarantee the same results in the future


USDCHF, “US Dollar vs Swiss Franc”

USDCHF is still being corrected. Possibly, today the price may reach 0.9950 and then continue trading downwards with the target at 0.9894.

USDCHF
Risk Warning: the result of previous trading operations do not guarantee the same results in the future


USDJPY, “US Dollar vs Japanese Yen”

USDJPY has finished the descending impulse. Today, the price may reach 110.30. Later, the market may fall to break 109.44 then continue trading downwards with the target at 107.90.

USDJPY
Risk Warning: the result of previous trading operations do not guarantee the same results in the future


AUDUSD, “Australian Dollar vs US Dollar”

AUDUSD is consolidating near the lows. If later the pair breaks 0.7410 to the upside, the market may continue trading upwards with the first target at 0.7480.

AUDUSD
Risk Warning: the result of previous trading operations do not guarantee the same results in the future


USDRUB, “US Dollar vs Russian Ruble”

USDRUB has completed the descending impulse along with the correction. Today, the price may break the low of this impulse and reach 62.56. After that, the instrument may form another ascending structure to reach 63.40 and then resume trading downwards with the target at 59.90.

USDRUB
Risk Warning: the result of previous trading operations do not guarantee the same results in the future


XAUUSD, “Gold vs US Dollar”

Gold has finished the ascending impulse. Today, the price fall towards 1264.00 and then grow to break the high of the above-mentioned impulse. Possibly, the pair may be corrected with the target at 1276.00 and then continue trading downwards to reach 1240.00.

GOLD
Risk Warning: the result of previous trading operations do not guarantee the same results in the future


BRENT

Brent has broken 74.45 downwards and may continue falling towards 72.30. Later, the market may start another growth towards the first target at 77.00.

BRENT
Risk Warning: the result of previous trading operations do not guarantee the same results in the future

Article By RoboForex.com

Attention!
Forecasts presented in this section only reflect the author’s private opinion and should not be considered as guidance for trading. RoboForex LP bears no responsibility for trading results based on trading recommendations described in these analytical reviews.

EURUSD: euro bulls trying to turn the tide

By Gabriel Ojimadu, Alpari

Previous:

  • On Thursday the 21st of June, trading on the euro closed up. Buyers recovered their morning and afternoon losses during the US session. The decline on the EURGBP pair stopped buyers in their tracks at around 1.1545. The euro cross came under pressure after the Bank of England meeting. The euro then followed the pound upwards, and recovered against the dollar from a low of 1.1508 to 1.1634.
  • The main catalyst behind the growth of the majors was the general decline of the dollar, which was brought about by the release of weak US data and a drop in US bond yields. The Philadelphia Fed manufacturing index came out at its lowest value since November 2016. The leading economic index did rise, but still fell short of expectations.

US data:

  • Initial jobless claims (15 Jun): 218,000 (forecast: 220,000, previous reading revised from 218,000 to 221,000).
  • Philadelphia Fed manufacturing index (Jun): 19.9 (forecast: 29.0, previous: 34.4).
  • Leading economic index (May): 0.2% (forecast: 0.4%, previous: 0.4%).

Day’s news (GMT+3):

  • 10:00 France: Markit services PMI (Jun), Markit manufacturing PMI (Jun).
  • 10:30 Germany: Markit services PMI (Jun), Markit manufacturing PMI (Jun).
  • 11:00 Eurozone: Markit services PMI (Jun), Markit manufacturing PMI (Jun).
  • 15:30 Canada: CPI (May), retail sales (Apr).
  • 16:45 USA: Markit services PMI (Jun), Markit manufacturing PMI (Jun).
  • 20:00 USA: Baker Hughes US oil rig count.

Current situation:

  • There’s no chart in today’s review because the rate hit a new high in the last hour, which has messed up all the Gann lines. If we go based on yesterday’s chart, we have the rate trading inside a channel with a 1% range since the 15th of June. Sellers tested the strength of the lower boundary on Thursday, but failed to push below it. The pair subsequently rebounded upwards on the back of a broadly weakening dollar.
  • In Friday’s Asian session, the dollar is trading down against all the majors. At the time of writing, the euro is trading against it at 1.1633; around the 112th degree. Buyers are attempting to exit the range of 1.1515 – 1.1630. This will be difficult from a technical point of view as the hourly indicators are overloaded. An unsuccessful attempt at this will widen the channel, meaning that bulls will have to break the resistance, for which they will need to build up some momentum.
  • Keep an eye on the resistance zone of 1.1642 – 1.1650. If buyers don’t manage to slip through here at the beginning of the European session, this will confirm a false breakout of the channel. In that case, we can expect to see a correctional movement to 1.1590 (balance line, reinforced from below by the 45thdegree).
  • A reversal candlestick has formed on the daily timeframe. Bulls are trying to take advantage of this and push the euro up. As the rate exits its range, the immediate targets will be 1.1670 and 1.1706.


Trouble Spotting Market Trends? This Can Help

Learn How You can Spot a Market Trend – Before it Starts

By Elliott Wave International

Let it be stated upfront that there is no perfect way to analyze and forecast financial markets. No crystal balls.

Yet, let’s be just as quick to add that in Elliott Wave International’s review of market analysis methods, none approach the utility of the Elliott wave model.

The reason for the Elliott wave model’s usefulness is easily explained: Elliott waves are reflections of the repetitive patterns of investor psychology, which is the real driver of prices, not news or events.

And, what could be more useful to an investor than a method which helps to identify a financial market’s trend — especially before it gets underway? Well, mastering the Elliott wave model helps you to do just that.

The Wall Street classic book, Elliott Wave Principle: Key to Market Behavior by Frost & Prechter, says:

…action in the same direction as the one larger trend develops in five waves.

Here are illustrations:

TrendUpDown

Let’s now learn how the Elliott wave model identifies countertrend moves within the main trend by returning to Elliiott Wave Principle and additional illustrations:

… reaction against the one larger trend develops in three waves.

Countertrend

Lastly, let’s learn how Elliott wave analysis signals the resumption of the main trend.

Elliott Wave International analyst Jeffrey Kennedy says:

A complete Elliott wave cycle consists of eight waves. Upon its completion, a similar cycle ensues….

Again, here are illustrations of the point:

Eightwaves

The reason that a market’s basic form is five waves followed by three waves is that this is the most efficient method of achieving both fluctuation and progress in linear movement.

Think of it as a variation of nature’s “two steps forward, one step back” model of achieving progress.

After all, humans are a part of the natural world, so it only follows that the financial markets, a product of human interaction, would carry the same imprint.

As you might imagine, there are many more details in applying the Elliott Wave Principle to financial markets, and it took an entire book to lay them all out.

The purpose of this article is to simply show you that the price patterns of financial markets unfold according to a repetitive, predictable structure. Familiarity with that structure can help you determine what’s next.

Jump on once-in-a-lifetime opportunities and avoid dangerous pitfalls that no one else sees coming. We can help you prepare for opportunities and side step risks that will surprise most investors. You can get deeper insights in Elliott Wave International’s new free report: 5 “Tells” that the Markets Are About to Reverse. The insights that you’ll gain are especially applicable to the price patterns of key financial markets, including the stock market, now.

Read the free report now.

This article was syndicated by Elliott Wave International and was originally published under the headline Trouble Spotting Market Trends? This Can Help. EWI is the world’s largest market forecasting firm. Its staff of full-time analysts led by Chartered Market Technician Robert Prechter provides 24-hour-a-day market analysis to institutional and private investors around the world.


Tied Agent of RoboMarkets in Spain

21 June 2018

Limassol, Cyprus

RoboMarkets is announcing that its Tied Agent in Spain has been approved by the regulator.

In June 2018, La Comisión Nacional del Mercado de Valores (CNMV) approved the Tied Agent of RoboMarkets Ltd. This status means that the local company is the official representative of RoboMarkets and is able to act on behalf of the investment firm. The top priorities of the RoboMarkets’ Spanish Tied Agent is exploring the market, providing Spanish clients with quality services, developing the existing services, and increasing the number of active clients in the country.

The new office is located in the capital of Spain, Madrid. The Tied Agent is headed by Alfonso Franco, who has a great experience in managing large financial organizations in Europe. Alfonso is responsible for researching and promoting the brand in Spain.

Alfonso Franco, Head of RoboMarkets Tied Agent in Spain, is positive about the welcoming news: “RoboMarkets is committed to its customers in Spain and is investing in the launch of the Tied Agent office to represent its brand locally. We are very excited to achieve this new milestone. It will permit us to provide additional and better services to our clients and to achieve a more in touch relationship with all our customers in Spain. We are convinced that it will be a great step forward for the growth of the company in the Spanish market and expand on its high potential. We are positive all our clients will celebrate this step“.


About RoboMarkets

RoboMarkets is an investment company with the CySEC license No. 191/13. RoboMarkets offers investment services in many European countries by providing traders, who work on financial market, with access to its proprietary trading platforms.


Trump’s Tariffs Undermining America’s Economic Future

By Dan Steinbock

As President Trump is again suspending the opportunity for trade compromise, new US tariffs are not only alienating US allies and partners but undermining America’s own future prospects.

On Monday, US President Donald Trump threatened to impose a new 10 percent tariff on $200 billion of Chinese goods. That will not only re-escalate the trade war with China but contribute to new risks of collateral damage to the US economy.

And make no mistake: While China is the first target; the next ones will include some of the largest trading economies in Europe, East Asia and Americas.

US tech giants will not be immune

US semiconductor chipmakers, including as Intel and Qualcomm, generate $15 billion each in annual revenue in China. The two are amid a great unease as US government is considering tariffs on chips imported from China, which has a critical place in their supply chains.

Due to increasing global interdependency, US unilateral moves are undermining the profitability and future prospects of not just US and Chinese companies, but other companies that are held up by the trade war. While Qualcomm needs China’s approval for its $44 billion buy of NXP Semiconductors, the latter is linked with US relief for Chinese telecom giant ZTE, which Trump supports but US Congress may oppose. That means uncertainty to the Dutch NXP’s workers, suppliers and buyers.

The leading global technology companies have an estimated $100-150 billion at stake in the US-China trade war.

For Apple and Intel, China accounts almost a fourth of revenues (read: $45 billion and $15 billion, respectively). In Broadcom and Microsoft each, a tenth of revenues ($9-$10 billion in each) come from China. After Google shut down its Chinese search engine in 2010, it has dreamed about a return. In turn, Facebook’s CEO Mark Zuckerberg hopes to launch his site in the mainland. Trump’s message to both is: Dream on.

The greater is the Chinese segment in US multinationals’ revenues, the greater headwinds they now expect. Boeing’s shares are down, as the US giant seeks for a cut in the $1.1 trillion that China will spend in the next 20 years to buy new airplanes. After all, Beijing could also purchase its planes from France.

How the trade wars will hurt America

The new Trump tariffs threaten to increase barriers to Chinese markets, while alienating Chinese consumers from US products and services, thus penalizing US export potential, investment projects and low-cost advantages.

Without a compromise, US businesses may lose $70 billion in energy, agriculture and manufacturing that China has offered to purchase, if the Trump administration will suspend tariffs on Chinese products. The energy story alone is alarming. When Washington in 2015 lifted its 40-year export ban for crude oil, China’s imports of US crude soared to 450,000 barrels a day. It is now one of the largest US markets. But as Trump tariffs will result in proportionate Chinese retaliation, those profits could dissipate.

In 2017, US exports to China soared to $130 billion. In the absence of a trade compromise, the most lucrative export groups, including civilian aircraft and engines, soybeans, passenger cars and semiconductors, industrial machines, crude oil, and plastic materials, are likely to feel new pressures in the coming months.

China could also defer the huge trade and investment deals that were signed during Trump’s visit to Beijing. As the US is erecting new barriers against Chinese investments in the US, China can respond in kind, while launching restrictions on imports of US services.

The worst is still ahead

Trump’s trade wars have only begun. The White House’s ultimate objective is to target America’s largest trade-deficit partners in Asia (China, Japan, and South Korea), Americas (Canada, Mexico) and Europe (Germany, Italy).

Misled by his trade-hawk advisors, Trump has opted for tariffs that the White House hopes will “break” China’s resistance, which will then serve as a warning to US NAFTA partners and allies in Europe and East Asia. Yet, wishful dreams aren’t economic realities.

What these tariffs could (and should) achieve is a united front of world’s major economies that support global trading regime that has ensured sustained global growth prospects since 1945. That’s why China, China, along with major European and Asian economies, is likely to challenge the US in the WTO dispute mechanism. That’s also why these countries plan to counter every Trump blow with proportionate retaliation.

In the US, that means accelerated economic erosion, volatility in global markets and new uncertainty as clouds are darkening over the post-global crisis recovery.

About the Author:

The author is the founder of Difference Group and has served at the India, China and America Institute (USA), the Shanghai Institutes for International Studies (China) and the EU Center (Singapore).

The original commentary was released by China Daily on June 21, 2018


Is Affiliate Marketing a Sure-Fire Strategy?

By Amram Margalit – Leverate

Digital marketing – along with Google algorithms and other online phenomena – has constantly evolved to fit the needs of consumers. With billions of active internet users, the empty spaces of websites leave so much room for marketing and advertising opportunities that, today, marketers and businesses are paying thousands of dollars to see results.

While many digital marketers have an arsenal of techniques ready to use for their best clients, none has seen the same rise as affiliate marketing. It attracts businesses because they get to expand their reach with it, and affiliates because they get to live off of the passive income they receive from it. It is a win-win situation for both parties; something not a lot of strategies can provide.

But with all the benefits it holds, is affiliate marketing truly worth the effort? For many, the numbers show a positive outcome. With the right purpose and use, affiliate marketing is enabling businesses to achieve the customers and revenue they need.

Understanding Affiliate Marketing

For those who are not familiar with the strategy, affiliate marketing involves taking a company’s product or service and using a third party or affiliate to promote the product. The company increases its visibility online and receives the support of the affiliate network. In turn, the affiliate gets to publish promotions in exchange for a commission, which is based on either the company’s earnings from the affiliate’s promotion, also known as CPA (Cost per Acquisition), or the generation of leads, known as CPL (Cost per Lead).

According to Entrepreneur, this is different from a marketing strategy that uses a similar process: influencer marketing. Influencer marketing also involves a company and a third party promoting a product, service, or brand, but the latter is usually not a network and act as unbiased ambassadors for a brand, rather than a straight out promoter. Influencers are popular online figures with an amassed amount of followers, who can help bring your brand closer to consumers.

Affiliate marketing is available in a broad range of industries and channels and provides a good ROI for different businesses. If the numbers become ideal and all parts of a long-term affiliate marketing plan come together, businesses can see up to 200 percent increase in figure. Affiliates can increase the number of new customer acquisitions by 30 percent and create over 90 percent of the revenue paid.

Affiliate marketing can also increase the channels where it promotes products. The numbers demonstrate the effective use of affiliate marketing. In fact, the total price of commission for affiliates is only a sixth of the total potential earnings of companies.

However, if companies, networks, or even individuals are looking at affiliate marketing as easy money, they are looking at it the wrong way. Like any marketing strategy, it requires investing time and money to gain traffic and remarkable results.

Affiliates must sell the products’ unique selling points, while businesses need to find the appropriate affiliates who will help them reach their marketing and financial goals. If all sections of affiliate marketing do their part, they will eventually see better results, such as increased online traffic and revenue for all parties.

So, is affiliate marketing a sure-fire strategy? If done right, you bet. With its high returns and countless avenues and opportunities, affiliate marketing is a scheme that businesses should put their money on if they want to expand their customer reach and increase profitability.

About the Author:

Amram Margalit is a professional writer who has worked in a wide range of settings, including technology companies, nonprofits, and the entertainment industry. Within these positions, Amram has provided quality content and advertising services and is currently the Content Manager at Leverate.