On Tuesday the 26th of June, trading on the euro closed down. Euro bulls lost all of the gains made following the surge witnessed yesterday. The strengthening of the USD forced buyers to lock in profits. As for the weakening of the single currency, I see more technical factors at play than fundamental ones.
Yesterday, I turned my attention to how China is devaluing the yuan to mitigate the impact of US tariffs. The EU will have to follow suit. In this regard, it might be preferable to sell the euro than to buy it. I’m talking about a period of three months. During the US session, the euro fell to 1.1635.
Yesterday’s expectations for the weakening of the euro were fully justified. Sellers reached 67 degrees, but did not reach the target of 1.1635.
In the Asian session, sellers made a fresh attempt to revisit yesterday’s low, but were stopped at 1.1640. A support passes through this level, which was formed from the lows of 1.1618 and 1.1635.
At the time of writing, the euro stands at 1.1660. The pair is trading at the 22nd degree from 1.1635. From above it is covered by the balance line, which is at the level of 1.1670. The balance line is strenghtening the resistance at 1.1640.
From a technical standpoint, I see the euro exchange rate at 1.1614, so I expect the price to fall to the 90thdegree.
The US Equities markets rotated over 1.35% lower on Monday, June 25, after a very eventful weekend full of news and global political concerns. Much of this fear results from unknowns resulting from Europe, Asia, China, Mexico and the US. Currently, there are so many “contagion factors” at play, we don’t know how all of it will eventually play out in the long run.
Europe is in the midst of a moderate political revolt regarding refugee/immigration issues/costs and political turmoil originating from the European Union leadership. How they resolve these issues will likely be counter to the populist demands from the people of Europe.
Asia is in the midst of a political and economic cycle rotation. Malaysia has recently elected Prime Minister Dr. Mahathir Mohamad, the 92-year-old previous prime minister (1981~2003) as a populist revolt against the Najib Razak administration. In the process, Mahathir has opened new and old corruption and legal issues while attempting to clean up the corruption and nepotism that has run rampant in Malaysia. Most recently, Mahathir has begun to question the established relationship with Singapore and the high-speed rail system that was proposed to link the two countries.
China is experiencing a host of issues at the moment. Trade concerns, capital market concerns, corporate debt concerns and an overall economic downturn cycle that started near the beginning of 2018. What will it take to push China over the edge in terms of a credit/consumer market crash is anyone’s guess? Our assumption is that continued inward and outward pressures will not abate quickly – so more unknowns exist.
Mexico will have new Presidential elections on July 1, 2018. What hangs in the balance of this election cycle is just about everything in terms of North American economic cooperation and future success. It is being reported that a populist “anti-neoliberal” movement is well underway in Mexico and the newly elected leader may begin a broader pushback against President Trump regarding NAFTA, immigration, US corporations operating in Mexico and more. We won’t know the full outcome of this election till well after July 2018.
Meanwhile, back in the USA, our political leaders in Congress and the House of Representatives seem hell-bent on opposing everything President Trump and many American’s seem to want – clean up the mess in our government and get a handle on the pressing issues before us. The US has a growing and robust economy. The last thing anyone wants right now is anything to disrupt this growth. Yet, it seems the political divide in the US is so strong that it may take some crisis event to push any resolution forward.
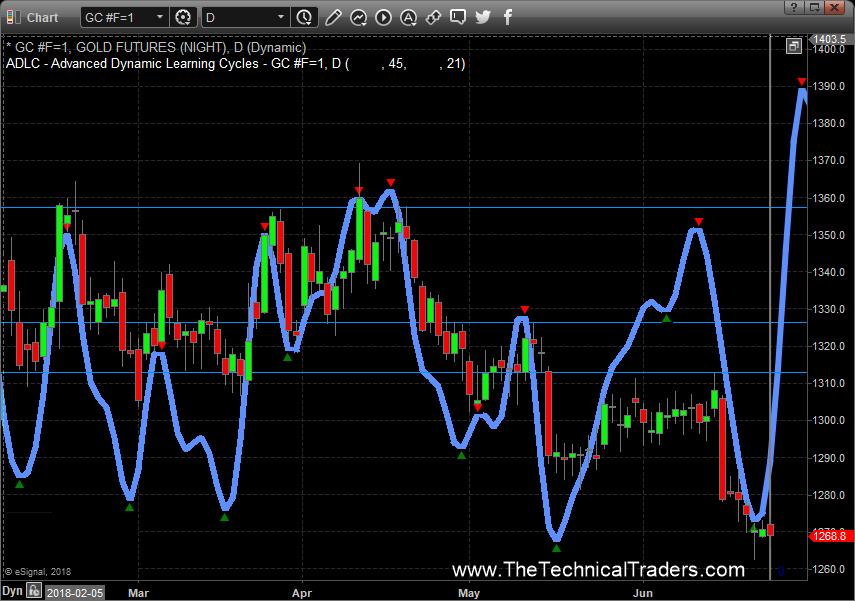
What does this mean for investors and traders? Fear typically appears in one place before it appears anywhere else – the Metals markets (Gold, Silver, Platinum, and Palladium). This Daily Gold Chart shows our predictive cycle analysis pointing to a near-term bottom formation as well as a strong likelihood of immediate upside price action. These cycles do not represent price levels. So the cycle peak does not represent where price will go – it simply indicates future cycle trends and direction.
Given this information, it is very likely that Gold will recover to near 1320 within the next couple weeks and possibly push higher on global concerns. For traders, this means we are sitting near an ultimate bottom in the metals and this could be an excellent buying opportunity.
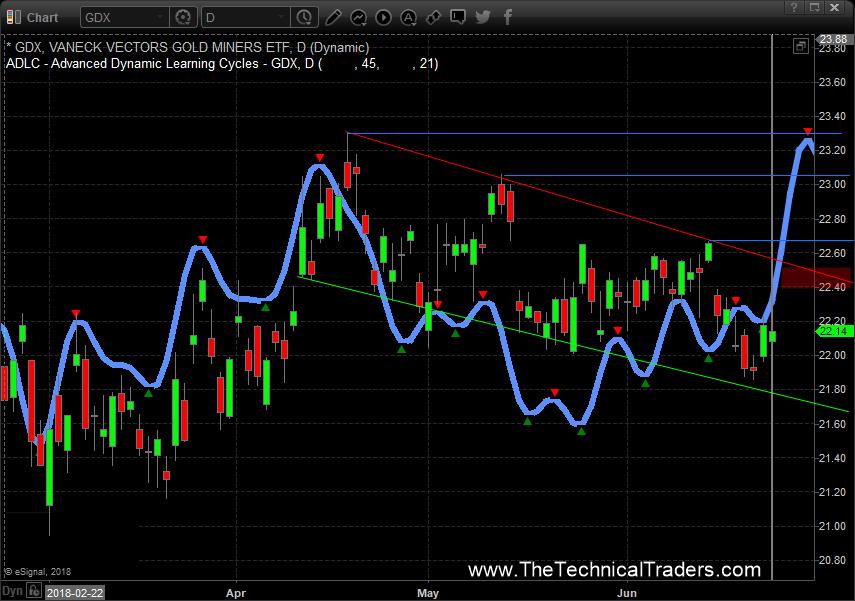
The Gold Miners ETF shows a similar cycle pattern but notice how prices in the Miners ETF have diverged from the Gold chart, above, by not resorting to a new price low as deep as seen above. This could be interpreted as the Gold market reacting to global concerns in an exaggerated way while the miners ETF is showing a more muted reaction. Additionally, notice how the ADL cycle analysis is pointing to similar price peaks in the future with near-term bottoms forming. This is key to understanding what we should be expecting over the next few weeks in Gold.
Our interpretation is that the global fear will manifest as a renewed upside trend in Gold and Gold Miners over the next few weeks with the potential for a 5~8% rally in Gold. The long-term upside is incredible for these trades but that is if you look years into the future.
As these fear components and unknowns continue to evolve, the metals markets should find support and push higher as fear continues to manifest and global markets continue to weaken.
As we have been stating since the beginning of this year, 2018 is setting up to be a trader’s dream. Bigger volatility. Bigger swings. Bigger profits if you are on the right side of these moves. Our proprietary predictive modeling systems and price analysis tools help us to stay ahead of the markets.
We help our members understand the risks and navigate the future trends by issuing research posts, providing Daily video analysis complete with cycle projections and by delivering clear trading signals that assist all of our members in finding profits each year. We are showing you one of our proprietary tools right now, our ADL Predictive Cycle tool and what we believe will be the start of a potential upside move in the metals markets. Get ready for some great trading over the next few months!
This week, the British Pound is looking rather weak. Investors’ attention is focused on the GDP numbers over the first quarter 2018 to be published by the United Kingdom on Friday and although investors aren’t expecting any surprises, they are trying to avoid any risks. Apart from this, the European Union Economic Summit will take place at the end of this week and the UK promised to announce its updated vision of the Brexit procedure there.
Official Brexit talks between the European Union and the United Kingdom have been going on for a year now as they started on June 19th 2017. Over this period of time, the parties have been completed the first stage of negotiations, which was mostly about legislative and law matters. They have also discussed the amount of fees and penalties to be paid by the United Kingdom for wrecking agreements. Several times, the talks were put on hold due to some serious conflicts and tensions. On paper, the negotiations will have to be completed by December this year, but there are some reasons to assume that they may linger on for a bit longer.
All this time, the Pound has been extremely “sensitive” to changes in investors’ sentiment, who were following the Brexit talks. No one expected the negotiations to be easy: there were no such cases in Europe before, that’s why the procedure may really take much time and be very complicated.
Investors, manufacturers, and businesses themselves can’t decide on how to deal with the Brexit procedure and future outlooks. The latest news said that BMW, a German multinational company that currently produces luxury automobiles and motorcycles, may decide to close its facilities, which are located in the UK, if the negotiations take much time and the company suffers losses. It’s not the first news that due to the Brexit the British economy may lose a lot of jobs offered by foreign companies. Earlier, the same was announced by Airbus. If manufacturers really decide to abandon the United Kingdom, it will extremely hurt the British economy and the Pound.
However, right now there are no reasons to expect an “exodus” of business structures from the UK. The Bank of England is doing its best to stabilize the country’s monetary system; consumer demand is high and stable and the companies and enterprises have no problems with capital.
From the technical point of view, the H4 chart shows both mid-term and short-term downtrends. However, when analyzing these different downtrends, one may assume that the dominating tendency may change soon. This is mostly because the price is testing the resistance line of the major downtrend. If the price breaks the resistance line at 1.3290, it may continue trading towards the upside projected channel. The target of this possible new uptrend may be at 1.3545. Still, there might be another scenario, according to which the pair may rebound from the resistance level and start forming a new impulse to the downside with the target at 1.3070, which is the short-term support line. If this line is broken as well, the instrument may move towards the downside projected channel and its support level at 1.2720.
Author: Dmitriy Gurkovskiy, Chief Analyst at RoboForex
Disclaimer
Any forecasts contained herein are based on the authors’ particular opinion. This analysis may not be treated as trading advice. RoboForex bears no responsibility for trading results based on trading recommendations and reviews contained herein.
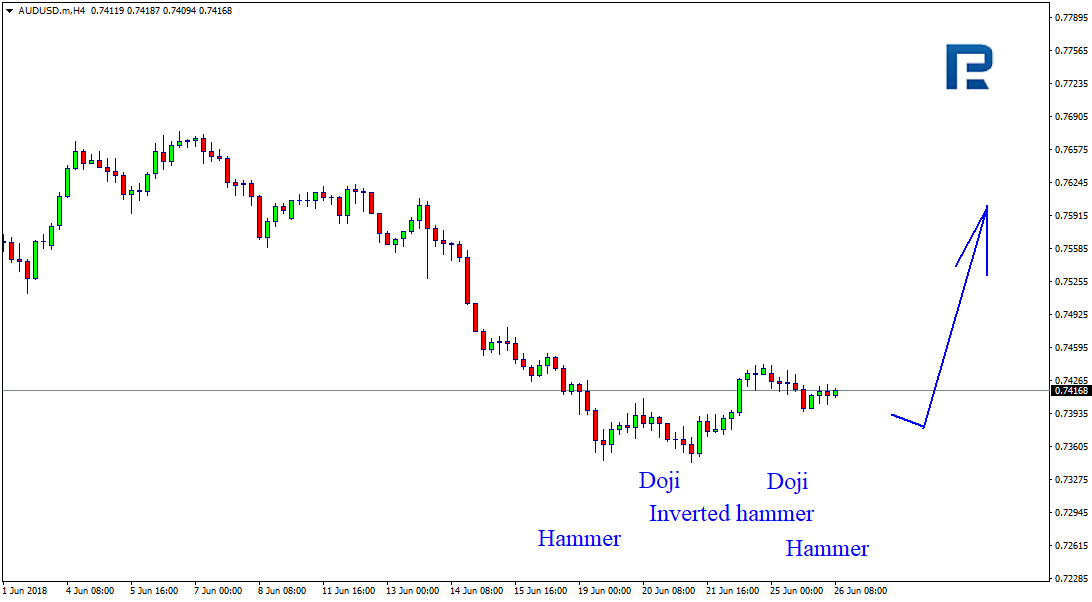
AUDUSD is trading at 0.7414; the instrument is moving below Ichimoku Cloud, which means that it may continue falling. The markets could indicate that the price may test the downside border of the cloud at 0.7425 and then continue moving downwards to reach 0.7295. Another signal to confirm further descending movement is the price’s rebounding from the resistance level. However, the scenario that Implies further decline may be cancelled if the price breaks the upside border of the cloud and fixes above 0.7480. In this case, the pair may continue growing towards 0.7585. After breaking the downside border of the channel and fixing below 0.7370, the price may continue moving downwards.
NZDUSD, “New Zealand Dollar vs US Dollar”
NZDUSD is trading at 0.6889; the instrument is moving below Ichimoku Cloud, which means that it may continue falling. The markets could indicate that the price may test Tenkan-Sen and Kijun-Sen at 0.6905 and then continue moving downwards to reach 0.6790. Another signal to confirm further descending movement is the price’s rebounding from the channel’s upside border. However, the scenario that implies further decline may be cancelled if the price breaks the upside border of the cloud and fixes above 0.6945. In this case, the pair may continue growing towards 0.7050.
USDCAD, “US Dollar vs Canadian Dollar”
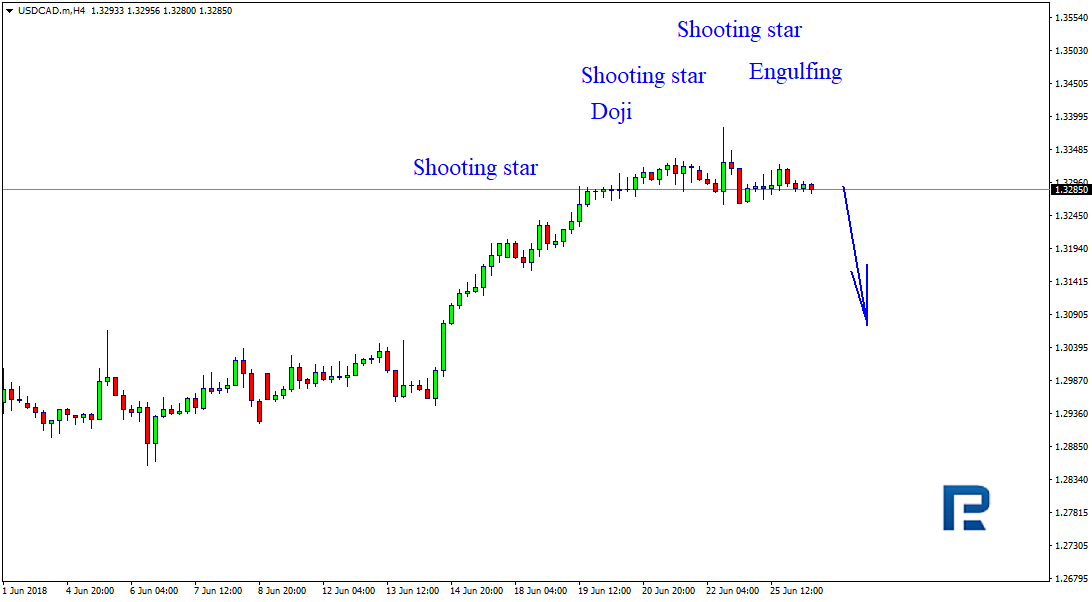
USDCAD is trading at 1.3285; the instrument is moving above Ichimoku Cloud, which means that it may continue growing. The markets could indicate that the price may test Tenkan-Sen and Kijun-Sen at 1.3250 and then continue moving upwards to reach 1.3465. Another signal to confirm further ascending movement is the price’s rebounding from the channel’s downside border. However, the scenario that implies further growth may be cancelled if the price breaks the downside border of the cloud and fixes below 1.3110. In this case, the pair may continue falling towards 1.2990.
Attention! Forecasts presented in this section only reflect the author’s private opinion and should not be considered as guidance for trading. RoboForex LP bears no responsibility for trading results based on trading recommendations described in these analytical reviews.
As we can see in the H4 chart, USDCAD is testing the resistance level and forming Shooting Star, Engulfing, and Doji reversal patterns. Judging by the previous movements, at the moment it may be assumed that the instrument may form several more reversal patterns and then continue falling.
AUDUSD, “Australian Dollar vs US Dollar”
As we can see in the H4 chart, AUDUSD is still testing the support level and forming several Hammer, Doji, and Inverted Hammer reversal patterns. Judging by the previous movements, it may be assumed that the instrument may complete this sideways movement and rebound from the level again.
Attention! Forecasts presented in this section only reflect the author’s private opinion and should not be considered as guidance for trading. RoboForex LP bears no responsibility for trading results based on trading recommendations described in these analytical reviews.
On Monday the 25th of June, trading on the euro closed up. After falling to 1.1628, buyers returned it to the resistance of 1.1675. Against the backdrop of a decline in US Treasury yields, they successfully overcame it to close the day’s candlestick at 1.1713.
Donald Trump continues to shake up the markets with plans to raise tariffs on Chinese and European goods. Yesterday it was announced that he is planning to place limits on Chinese investment in US technology companies. He also wants to introduce a 20% tariff on car imports from the EU. The topic of trade relations with the US will be front and center at the EU summit of leaders on the 28th and 29th of June.
Day’s news (GMT+3):
11:30 UK: BBA mortgage approvals (May).
12:00 UK: MPC member Haskel speech.
12:30 UK: MPC member McCafferty speech.
16:00 USA: S&P/Case-Shiller home price indices (YoY) (Apr).
17:00 USA: Richmond Fed manufacturing index (Jun).
20:00 USA: FOMC member Bostic speech.
Fig 1. EURUSD hourly chart. Source: TradingView
Current situation:
The euro recovered by 210 pips in 66 hours. The single currency on the hourly timeframe is showing a bullish trend with support at 1.1690. Quotes rose to 1.1720 today during the Asian session.
Against the backdrop escalating trade conflicts, risky assets may incur losses by closing time. Taking into account that an ending diagonal has been formed on the euro, I’m forecasting a drop to 1.1632 today.
Perhaps today my view of the euro is a bit too optimistic, but the bearish trend will persist throughout intraday trading, and after 66 hours of upwards movement, we can anticipate a price drop. Moreover, the ending diagonal along with the divergences on the AO indicator are bearish signals. The euro now is already at 1.1693. Sellers need to pass through 1.1690 and the fall will accelerate.
The European calendar for today is almost empty. We can now direct our attention to Haskel and McCafferty’s speeches to gain an understanding of whether the BoE will raise rates. In the American session, speeches by Fed members Bostic and Kaplan are planned.
As we can see in the H4 chart, XAUUSD is trading to the downside and has already reached the post-correctional extension area between the retracements of 138.2% and 161.8%. In the nearest future, the instrument may start a new pullback towards the resistance level at 1282.09.
In the H1 chart, the convergence made the pair reverse and start a new correction to the upside, which has already reached the retracement of 23.6%. The next targets may be the retracements of 38.2% and 50.0% at 1279.70 and 1285.30 respectively.
USDCHF, “US Dollar vs Swiss Franc”
As we can see in the H4 chart, USDCHF has been corrected upwards by 76.0%. The current movement, which is getting closer towards the support level at 0.9852, may be described as a pullback to the downside. However, if the instrument breaks 0.9993, it may continue growing to reach the high at 1.0056.
In the H1 chart, the pair has been corrected downwards by 61.8%. At the same time, one can see the convergence being formed, which may indicate a new rising impulse towards the short-term high in the nearest future.
Attention! Forecasts presented in this section only reflect the author’s private opinion and should not be considered as guidance for trading. RoboForex LP bears no responsibility for trading results based on trading recommendations described in these analytical reviews.
Over the past few months, our research team has authored many articles regarding the weakness in China/Asia as well as the recent rotation in the global markets as trade issues, debt issues, the G7 meeting and, more recently, concerns in the US and Europe regarding immigration and political issues create chaos in what was, just 18 months ago, a relatively calm global market. Yes, there have been some concerns over the past few year with regards to debt issues and other concerns, but the recent shakeup in the status-quo of the global markets seems to be presenting a massive opportunity for investors.
The recent news is that the European leaders are convening an Emergency Meeting to discuss immigration issues and other issues. This emergency meeting is warning us that other issues are at play here and immigration issues are the result of many failed policies and management by the EU to protect and distribute diversity to EU members.
We believe this emergency meeting could result in a big fat “nothing” from the EU which will expand additional pressures on EU member nations to find solutions on their own regarding immigration, costs, debt and others. In other words, if our assumption is correct that this meeting will result in the EU leaders saying “well, it’s just the way it is right now – we’ll have to come together to find a way to deal with it” will result in a massive backlash revolt from other EU members.
Additionally, concerns originating from within China and Asia are indicating that massive debt issues, defaults and margin calls. We warned of this economic contagion cycle back in late March 2018 and early April 2018 with our detailed multi-part research post. This is just beginning as China has been an economic leader for most of Asia, thus as China deals with a contracting economy and some levels of economic contagion, so will the rest of Asia.
We expected to see an explosion in defaults and reduced foreign capital investment as China attempts to curtail this credit crisis event. This means many of the emerging markets will see some extended weakness while pricing attempt to find support in the face of unknowns and unpredictable outcomes.
Lastly, in the US, with mid-term elections only about 3 months away, and with Mexico having elections only a few days away (July 1, 2018) a number of key factors for North America are unknown.
Right now, Andres Manuel Lopez Obrador (ALMO) appears to be a potential winner of these elections, yet from news we see that Mexico is moving away from new-liberalism and towards a more populist leader that could expand tensions with the US President. Just recently, ALMO urged Mexican citizens to overwhelm the US with illegal immigrants while attempting to move Mexico away from reliance on the US for economic support.
Our opinion of this is that ALMO is walking a very fine line given everything that is going on throughout the globe at the moment and although it may sound good to his people – there may be some very tough situations ahead in making this a reality.
We, the research team at www.TheTechnicalTraders.com, have recently released a Members Only update to our valued members that shows our predictive modeling systems expectations over the next 2~4 weeks for the US equity markets. We can’t show these to you because this is a free article to help you see what is happening and that the markets are about to have some big moves.
What will happen? That is only for our subscribers at the Wealth Building Newsletter. But, what we can show you is what we believe are critical charts for the next few weeks in regards to the global markets and the expectations ahead.
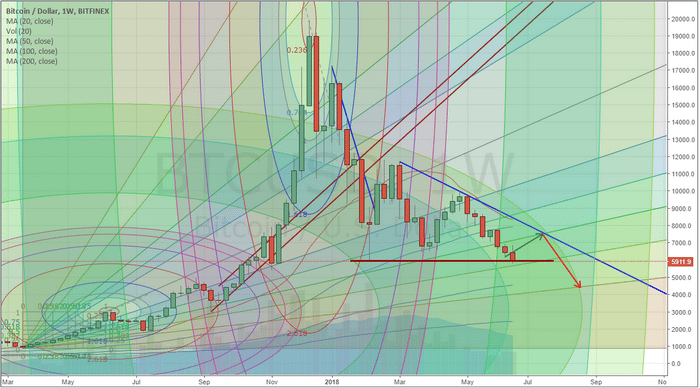
First, Bitcoin recently broke below the $6k level on a breakdown move that could be a sign that no strength really exists near this $6k level. Please understand that if this $6k level is broken and no real support is found near this level to keep prices above $6k, then $4k or lower is an immediate downside target. Below $4k, we are talking about $1600 price levels. This represents a 70% price decrease from recent level if it happens. So, pay attention to Bitcoin as we believe the meltdown in cryptos could present real issues in the global markets as a derivative market risk factor.
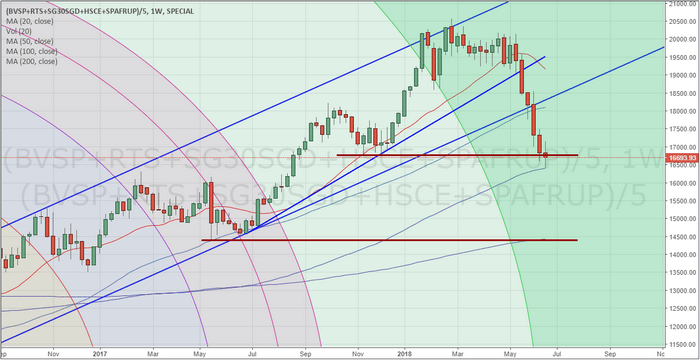
Next, this Weekly BRICS chart (emerging market custom index) is clearly showing the weakness in price levels extending much lower over the past few months. Remember, the BRICS markets are a basket of major emerging markets and this price channel breakdown could be an early warning of a much larger downside price trend setting up. Weakness below immediate support may result in an additional price decline of -20% or more from current levels.
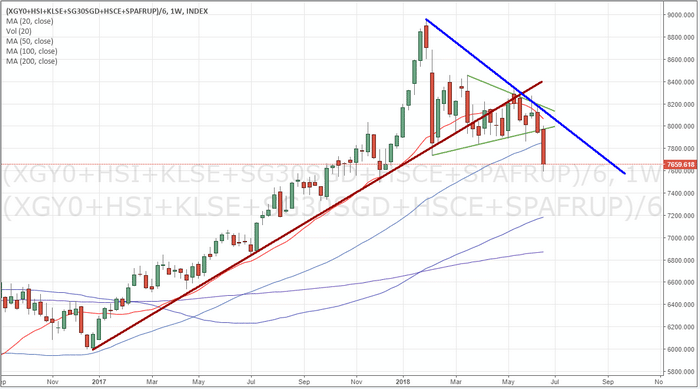
This Weekly China/Asia custom index is showing us that recent price weakness has recently broken a FLAG/PENNANT formation that tells us price weakness could accelerate as debt issues, defaults and margin calls expand. Somewhat similar to what happened in the US 10 years ago, when this debt bubble continues to collapse, the issue is how do the Chinese contain this collapse event while continuing to support their global efforts and multi-national efforts to become a global economic leader? Think about it and understand that China has expanded quite extensively over the past 12+ years on the support of the global central banks and US Fed. The recovery efforts throughout most of the world have created an environment where China could attempt to expand with ease and allow their credit markets to expand without much risk. Well, not that the world is changing direction and President Trump is attempting to settle trade and other issues – it’s a completely new playing field for the Chinese and for most of the world. We believe the next few months could show further signs of weakness in the Chinese and Asian economies as well as, potentially, lead to an emerging market collapse before the end of this year.
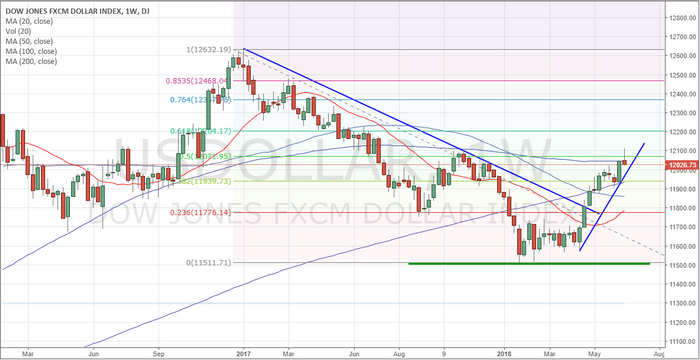
Lastly, the US Dollar. Yes, the trusty old GREENBACK. It is not very difficult to explain or understand why the US Dollar will likely stay above 110~115 over the next few years and likely push a bit higher over the next few months. All of the preparation by global economies to bring multiple national economies near par with the US economy (think the European Union and the efforts of China to bring the Yuan into the global market as a suitable currency), have resulted in what we have today – an expansive effort to bring foreign economies to near par basis levels against the US Dollar. The attempt to accomplish this was based on a bias that existed 8+ years ago during the global economic recovery efforts and was based on the ability for “all economies” to achieve great success and develop renewed balance as a result of such efforts.
In other words, the intent was to create multiple base currencies that could be used in global transactions that were near par to the US Dollar – ideally removing the US Dollar as the only real stable currency for such transactions.
Yet, here we are – on the cusp of what could become a global divergence from these “best-laid plans” and on the verge of a greater level of debt contagion, credit defaults, margin calls, global political issues and global immigration issues as a result of these globalist biases. Europe, China, Asia and dozens of emerging markets and European markets are having to defend themselves from the seemingly out of control liabilities and expenses with these globalist biases. Just as we are seeing in Mexico right now, this defense is resulting in a populist/nationalist movement that could push the unraveling of these biases even further.
And what happens to the US Dollar through all of this? Our belief is that the US Dollar will, again, attain and secure itself as the leading global currency with continued strength and security. We believe a massive capital flight mechanism has already been active where foreign capital is rushing into the US markets in an attempt to avoid devaluation and risk factors. We believe this will continue for at least the next 6~12 months as global issues continue to be resolved.
Please take a moment to review some of our other, older, research posts by visiting www.TheTechnicalTraders.com and seeing how we can help you stay ahead of the market and find greater success while trading. Our members love our research, our predictive price modeling systems, our Daily video forecasts, ETF trade alerts, and more. Our job is to help you become a more informed, and better trader. We know you will be satisfied with our efforts and we urge you to become one of our valued subscribers today.
EURUSD is still growing. Possibly, today the price may reach 1.1680 and then fall towards 1.1590, thus forming a new consolidation range. If later the pair breaks this range to the upside, the market may continue the correction to reach 1.1744; if to the downside – resume trading downwards with the target at 1.1425.
GBPUSD, “Great Britain Pound vs US Dollar”
GBPUSD is falling towards 1.3200 and forming a new consolidation range. If later the pair breaks this range to the upside, the market may continue the correction to reach 1.3433; if to the downside – resume falling with the target at 1.3080.
USDCHF, “US Dollar vs Swiss Franc”
USDCHF is still being corrected. Possibly, today the price may reach 0.9850 and then grow towards 0.9916. After that, the instrument may form another descending structure with the target at 0.9842 and then continue trading upwards to reach 1.0020.
USDJPY, “US Dollar vs Japanese Yen”
USDJPY is falling again; it has reached 109.44. Today, the price may consolidate around this level. Later, the market may break the range downwards and continue trading downwards with the target at 108.65.
AUDUSD, “Australian Dollar vs US Dollar”
AUDUSD is being corrected towards 0.7470. After that, the instrument may fall to reach 0.7335 and then form another ascending structure to return to 0.7470. Later, the market may continue trading downwards with the main target of еры descending wave at 0.7286.
USDRUB, “US Dollar vs Russian Ruble”
USDRUB is still falling with the target at 62.56. After that, the instrument may form another ascending structure to reach 63.40. Later, the market may resume trading downwards to break 62.00 and then continue falling with the target at 59.90.
XAUUSD, “Gold vs US Dollar”
Gold is moving downwards. Today, the price may fall to break 1260.00 and then continue trading downwards to reach 1240.00. After that, the instrument may start another correction with the target at 1304.00.
BRENT
Brent is still consolidating around 74.66. Possibly, the pair may grow towards 75.85 and then fall to return to 74.66, thus forming a new consolidation range. If later the pair breaks this range to the upside, the market may continue growing to reach 77.00; if to the downside – trade downwards with the target at 71.80.
Attention! Forecasts presented in this section only reflect the author’s private opinion and should not be considered as guidance for trading. RoboForex LP bears no responsibility for trading results based on trading recommendations described in these analytical reviews.
On Friday the 22nd of June, trading on the euro closed up. The US’ trade wars with China and the EU had a negative impact on US Treasury bond yields. The yield on 10-year bonds fell from 2.92% to 2.59%. This weakening had a positive impact on the euro.
The single currency also received support from statistics on Germany and the Eurozone, as well as assurances by Italian politicians that their country would not leave the EU, thus causing the euro to rise to 1.1675.
11:00 Germany: IFO business climate (Jun), IFO expectations (Jun), IFO current assessment (Jun).
15:30 US: Chicago Fed national activity index (May).
17:00 US: new home sales change (MoM) (May).
Fig 1. EURUSD hourly chart. Source: TradingView
Current situation:
Our pair lost steam at 1.1675. Buyers haven’t managed to overcome the 135th and 45th degrees from the respective lows of 1.1508 and 1.1618. After they passed the level of 1.1630 (the upper border of the channel) and the euro recovered to 1.1675, the bearish trend weakened.
At present, I see a strengthening of the euro against the US dollar as an upward correction. The trend line from the high of 1.2400 (16 April) runs through 1.1768 on the current day. If buyers can break through this level, then we can talk about a change in the trend.
At the time of writing, the euro is worth 1.1639 USD. The price has exited the channel, which is needed to confirm the beginning of a downwards correction in relation to the growth from 1.1508 to 1.1675. According to the forecast, first I expect a drop to 45 degrees – 1.1621.
If the price returns to this before 11:00-12:00 (GMT+3), sellers may demonstrate activity on it to rewrite a low of 1.1618. In this case, the double top model is activated. The target for it is at 1.1560. I did not put a mark on the chart, so keep it in mind.
If sellers can’t break through 1.1620, then there’ll be an increased risk of prices going up to 1.17.