Author Archive for InvestMacro – Page 406

Will 2018 Be A Repeat of 2002 Tariffs on Resource Heavy TSX, ASX and TSXV?

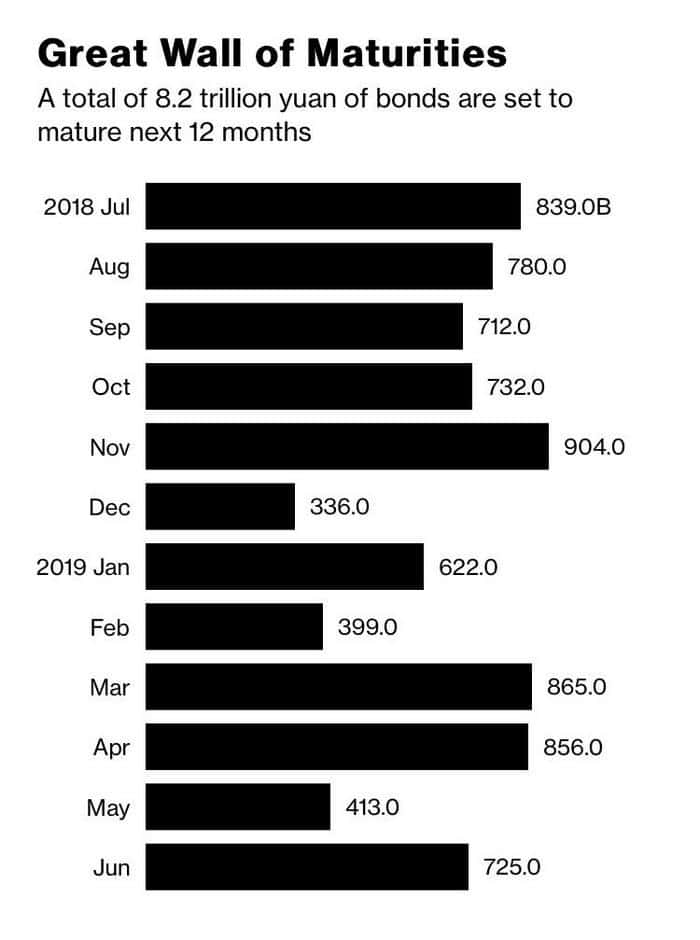
Tariffs are front and center right now in the markets, and during the 2002 steel tariffs, the steel tariffs were not good for the U.S. markets. The Dow Jones Industrial Average, S&P 500, and the NASDAQ were all down between 20-30% during the 2002 steel tariffs, before recovering, when tariffs ended in December 2003. With the US now imposing steel tariffs on Canada, Mexico, and the European Union. While exempting Australia, South Korea, Brazil, and Argentina. What does this mean for the Canadian stock markets, and what will happen to the Australian markets, if Australia gets hit with the steel tariffs? Both the TSX & ASX are heavily weighted to financials and materials, and both experienced huge housing booms over the past decade. Will gold be a safe haven for Canadian and Australian investors?

“I do think that this trade stuff is a negative. It is going to hurt sentiment. Its badly thought through. Its not strategic. There are legitimate complaints about trade. But this is not the way to go about it. And you see it in the volatility in the market” Jamie Dimon (Chairman & CEO of JPMogran Chase)  (Source CNBC)

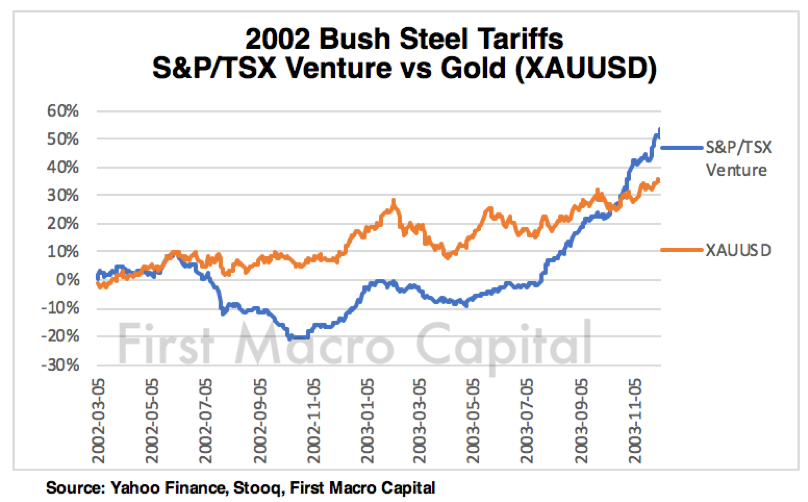
2002 TARIFFS IMPACT ON CANADA TO THE S&P/TSX Composite & S&P/TSX Venture

Even though Canada was exempt during the 2002 steel tariffs, S&P/TSX Composite fell by almost 30% during the US imposing the steel tariffs in 2002. The S&P/TSX Composite finished slightly positive by the time the tariffs were over. The S&P/TSX Venture Composite (Venture), Canada’s junior market, not only FELL less during the bear market but significantly outperformed by the end of the tariffs. The Venture was up by almost 50%. The sector rotation out of technology and into commodities had begun, and the Venture saw HUGE fund flows because of its heavily weighted in junior mining (gold stock, silver stocks, copper stocks, etc.) and junior oil & gas stocks. You had capital pull out of speculative tech stocks (Nortel Networks) and venture capital and put into high-risk commodity focused junior explorers, developers, and junior miners. The Venture is the largest venture capital space in the world to invest in small cap natural resource stocks, providing exposure to exploration, development, production, and mining services. If history repeats, then the TSX Venture is set to outperform the broader markets once again.

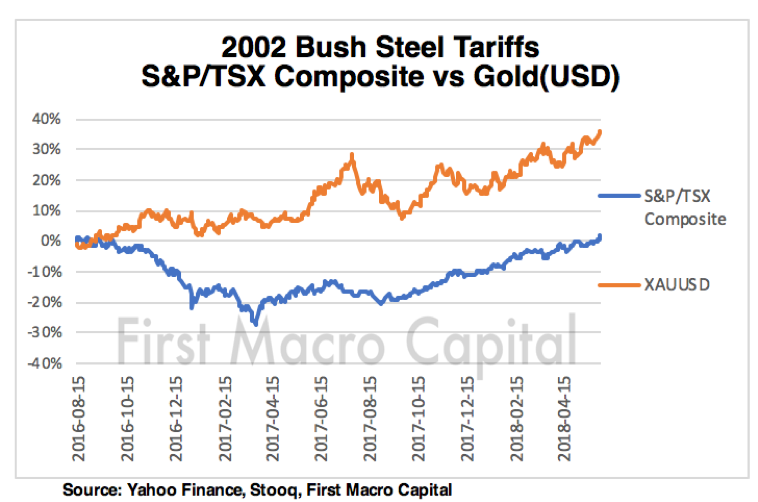
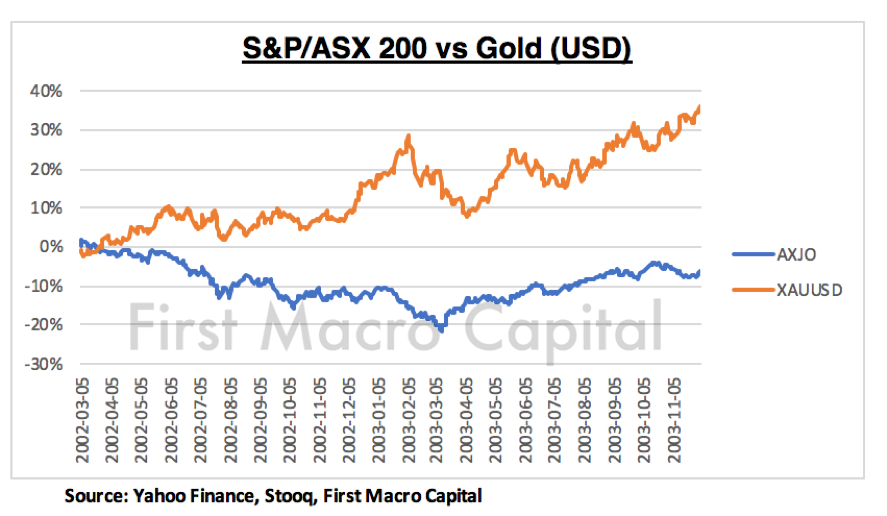
2002 TARIFFS IMPACT ON THE ASX 200?

The broader ASX 200 fell less than the Canadian and US markets during the 2002 US steel tariffs while the North American equities were selling off in the second half of 2002. The broader ASX Materials Index finished positive, just over 10% by the end of 2003We can see that even in Australia the sector rotation into materials had started to take place following tech burst. What was surprising, in 2002, was that both the ASX 200 bottomed in February 2003, posting modest negative returning during the trade situation. The ASX Materials in contrasts bottomed in September 2002. While only a few months into the US steel tariffs, the overall ASX Market continues to be up, with the ASX materials up but lagging the broader index ASX 200. Gold significantly outperformed the ASX, even when adjusting for currency appreciation.

WHAT IS DIFFERENT THIS TIME FOR CANADA?

Unlike the U.S Federal Reserve, that was decreasing rates, after September 11, only a few months prior to the steel tariffs, and the bursting of the tech bubble. In Canada, the Bank of Canada (BoC) raised its target four times over the same time period, by 125 BPS, from 2.25% to 3.5%. But it didn’t stop there. In July 2003, the tightening was over, and the target was reduced to 3.25%, then again to 3.00% Where the is Bank of Canada today? No change in its target yet since the US steel tariffs started and no reaction yet to them being implemented on Canada. But will they be forced to raise their targets?

The economic progress we have seen makes us more confident that higher interest rates will be warranted over time, although some monetary policy accommodation will still be needed,” Governor Poloz said. “We will continue to watch how households and the entire economy are reacting to higher interest rates. And we will be cautious in making future adjustments to monetary policy, guided by incoming data.”

Canadian households have built up about $2 trillion of debt, including $1.5 trillion of mortgage debt….a prolonged period of low interest rates that allowed borrowers to take out larger mortgages for the same payment size. This debt is now a vulnerability, both for the whole economy and for highly indebted households who will face increased debt-service costs when interest rates rise. “We are closely watching the vulnerability represented by this group and the debt they carry, and how it poses a risk to both the financial system and the economy,” Governor Poloz said.  – Bank of Canada

Canadian households continue to be significantly more leveraged than they were before the 2008 recession. But will the Bank of Canada raise rates? They may have no choice. Are household and businesses going to be able to handle inflation pressures they are already experiencing from rising gas prices? Brent crude hits its highest level since 2014. There is also the July 1st deadline of tariffs being added to US imports.

“The problem for the Bank of Canada is this. What do they really control? So, when we get the Bank of Canada press statement, what is it they do? They actually just have an influence on the overnight rate and the overnight rate you can say as sort of an impact to the very front end of the curve. But the reality is that the Canadian bond curve is 90% correlated to the US Treasury market. What are US Treasury yields doing? They’re back up. There’s nothing the Bank of Canada can do about that. US Treasury yields are backing up.We are importing a good part of that into Canada. Mortgages are ultimately priced off the bond curve. And so, look at what happened last week.Even just weeks after the Bank of Canada said we’re are on, maybe on hold indefinitely. Mortgage rates went up last week because of the importation of higher bond yields south of the border.

…. This is the shocking statistic. Normally conservative Canadians that historically really went and took out five-year mortgages. They didn’t want to take on refinancing risk. Half of the Canadian residential mortgages rollover in the next year. Almost half, the number if 47%. That shocking” – David Rosenberg (Source BNN Bloomberg)

WHAT IS DIFFERENT THIS TIME FOR AUSTRALIA?

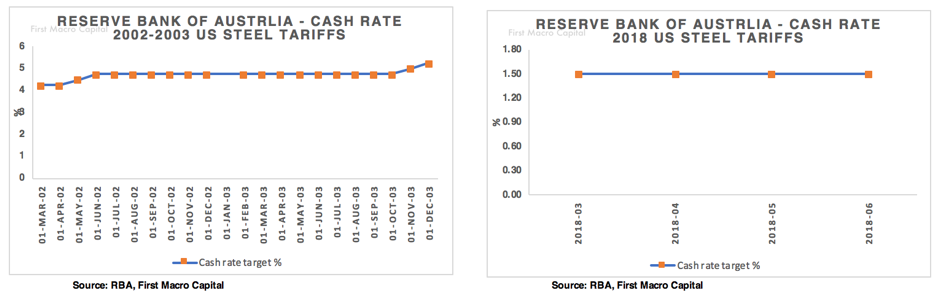
The Reserve Bank of Australia (RBA) during the 2002 episode of tariffs, followed the similar path to the Bank of Canada by raising its cash target rate four times, by 100 BPS from 4.25% to 5.25%. But there were no reductions, only hikes, and holds. Where is the RBA now? The RBA has stayed the course by holding rates, but will it follow history and begin raising rates? What about the impending interest-only loans that need to be refinanced over the next three years? Will the RBA hold back from raising rates? Time will tell.

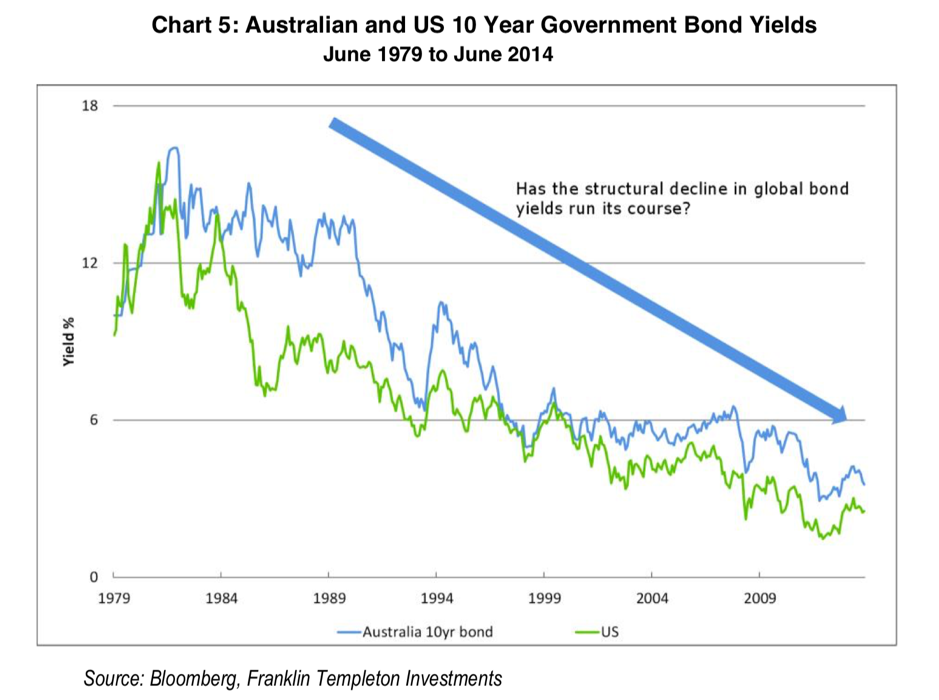
In Australia interest-only mortgages, which during “their recent peak, they accounted for almost 40 per cent of all mortgages. While interest-only loans have a role to play in Australian mortgage finance, their value has limits.” Will overseas funding costs that are impacted by the US increasing rate, rise well? Over the last 20 years to 30 June 2014 the correlation between Australian and US 10-year yields has been 0.84 measured over quarterly periods with a correlation of 0.71” Source: Franklin Templeton. While not the short-end of the curve, as we have seen recently with many emerging markets rising interest rates is becoming the new normal and Australia will have to raise the cash rate soon if the Fed keeps going.

IMPACT ON CAPITAL MARKETS IN CANADA & AUSTRALIA

Due to the tight correlation that Australian and Canadian rates have to US rates, we could see banks hike their mortgage rates higher if the US Fed continues to raise its target rate. We would also expect this would further put pressure on both of their housing markets and the capital markets if a broader sell-off takes hold because of the tariffs as had previously occurred in the 2002 tariffs. This may present opportunities for royalty stocks like to provide funding to the sector because capital markets funding through equity issuance and commercial lending from banks would dry up.

WINNERS FROM THE US 2002 STEEL TARIFFS

  • Gold was the clear winner in the US Steel Tariffs.
  • Canada’s TSX Venture Index was the clear index winner in terms of performance because it is heavily weighted in small-cap natural resource stocks in mining and oil & gas.
  • If history repeats, the tariffs may be the signal over a 1-2 year time period, the start of the rotation out of technology and into commodity assets, just like the 2002 US tariffs signaled the rotation into the 2000’s commodities boom.

The outlier remains how long will the US Federal Reserve continue to keep raising and removing liquidity until something breaks?

Bottomline, there was a shakeout in all equities first before the commodity boom took hold.  


Written by Paul Farrugia, BCom. Paul is the President & CEO of First Macro Capital. He helps his readers identify mining stocks to hold for the long-term. He provides a checklist to find winning gold and silver miner stocks and any commodity producer.

Why You Should Brace Yourself for Big Financial Changes

Extrapolating current trends into the future leave many people unprepared for major societal shifts

By Elliott Wave International

The one thing you can count on in financial markets, and society at large, is change.

I was reminded of this when I read this May 18 New York Times’ headline and subheadline:

The Last Days of Time Inc.

… how the pre-eminent media organization of the 20th century ended up on the scrap heap.

Time Inc. has been purchased by the Meredith Corporation, which plans to spin off Time magazine, Sports Illustrated, Fortune and Money. All four magazines have suffered from declining ad revenue and declining circulation. There are other details, but the bottom line is that an established media empire, which had a long history of reporting on change, has now been swept up by change.

A generation ago, many observers would not have imagined that a company as iconic as Time Inc. would find itself “on the scrap heap.”

But linear trend extrapolation has always had its pitfalls, and on changes that have been on a much bigger scale than one media company, which brings to mind what the 2017 book, The Socionomic Theory of Finance, said:

(1) It is 1975. Project the future of China.

(2) It is 1963. Project the cost of medical care in the U.S.

(3) It is 100 A.D. Project the future of Roman civilization.

In 1975, the Communist party was entrenched in China. … Would anyone have imagined that China’s economic production, in just over a single generation, would rival that of the United States?

In 1963, medical care was cheap and accessible. … Would anyone have guessed that [today] pills would sell for $2, $20, $200 and even $1,000 apiece?

In 100 A.D., would you have predicted that the most powerful state in the world–the Roman Empire–would be reduced to rubble in a bit over three centuries? Few people of the day imagined that outcome.

Let me add: It’s June 13, 2005 — what were many people projecting for home prices?

Well, here’s a Time magazine cover which published on that date:

1101050613_400

If that cover was an indicator, most people expected home prices to keep rising. But, we know what happened: Housing stocks topped that very year and the “subprime mortgage crisis” hit about two years later. Eventually, home prices plummeted by more than 50% in some of the nation’s high-flying real estate markets. Moreover, the Dow topped in 2007 and then suffered its worst decline in 75 years:

1010EWT_Dow-crash

Yes, this dramatic trend change in the Dow also took many observers by surprise.

The reason you should brace yourself for more big financial and economic changes is that EWI’s analysis suggests that the next financial change will again surprise the unprepared.

We just released this new, free report, 5 ‘Tells’ that the Markets Are About to Reverse, that reveals many false indicators – a.k.a. “head fakes” — investors see every day. The report helps readers separate themselves from the herd and survive (and thrive) in volatile markets. Read the free report now.

This article was syndicated by Elliott Wave International and was originally published under the headline Why You Should Brace Yourself for Big Financial Changes. EWI is the world’s largest market forecasting firm. Its staff of full-time analysts led by Chartered Market Technician Robert Prechter provides 24-hour-a-day market analysis to institutional and private investors around the world.

Argo launches new crypto-mining service for mainstream consumers

Low-cost subscription service aims to fulfil global demand for mining

June 11th 2018, London, UK:  Argo, a UK-Canadian venture, is set to transform crypto-mining with the launch today of a new low-cost, flexible and easy-to-use service for users.

The service is aimed at addressing pent-up demand from users who want to benefit from mining digital currencies but have been put-off by its complexity and significant up-front cost.

The company’s solution is mining-as-a-service (MaaS), which enables users to commence crypto-mining without the need to have significant computing expertise or acquire complex and expensive hardware and have the frustration of setting up their own systems.  Users can start mining for digital currencies within minutes of accessing Argo’s website on a mobile phone or computer.

Using state-of-the-art computing hardware and mining software, the Argo platform also saves time and vastly improves user-experience.

Argo’s system was developed by a team of experienced technology experts including its co-founders Jonathan Bixby and Mike Edwards.

Mr Bixby said: “We have launched this service to take the pain and heartache out of participating in the biggest new technology breakthrough since the launch of the internet.”

Mr Edwards said: “Setting up a computer rig to mine cryptocurrency is challenging, inefficient and expensive. I knew that we had to change the game and democratise the process so that crypto-mining could become a mainstream consumer activity.”

The service is available to adults with a credit card for an introductory subscription fee as low as US$25 (£18) per month. Users have a choice to mine four digital currencies: Bitcoin Gold, Ethereum, Ethereum Classic and Zcash. Miners choose contracts on a monthly renewable basis.

Argo is headquartered in London, UK, with its initial data centre located in Quebec, Canada.


About Argo
Argo is a mining-as-a-software (MaaS) service provider that makes it easy for anybody to mine Bitcoin Gold, Ethereum, and other alternative coins (altcoins) through the cloud.  To get started, users access Argo’s website on a mobile device or personal computer, register with Argo, select a cryptocurrency and press go. By doing so, they are remotely connected to mining computers that do the mining for them. These machines are based in Argo’s datacentres in Canada. Mining through Argo avoids the need to acquire expensive hardware as well as incurring large electricity bills. Argo has sought to minimise its environmental impact by pooling more efficient resources and using green energy from hydropower. Users can also switch packages on a monthly renewable contract so they always have control over how much they spend and which currency they’re mining.


4 Key Tips for Trading Intraday Charts on Forex & CFD Markets

By Admiral Markets

Dear traders,

Many traders find intraday charts exciting and action-packed on the one hand, but also difficult and challenging on the other hand.

This article explains four specific tips and tricks that are useful when tackling the charts on lower time frames.

We will explain how traders can use patience, Pivot Points, Fibonacci, and other tools for better and more informed trading decisions.

Tip #1: Weekly Pivots Offer Great Value

Many traders already use daily Pivot Points (PP), but not many are aware that
weekly Pivot Points (PP) are just as equally valuable.

Weekly PP levels are key Support & Resistance (S&R) levels where traders can expect the trend to stop. They also indicate key breakout and bounce zones and show how much space (between the PPs) is available when trading.

Not many intraday traders use weekly PPs because they tend to focus on the daily ones. Although the latter is equally important, the weekly levels offer more confluence and even stronger S&R zones. Traders will do well to avoid setups that are trading into these key levels.

Admiral Markets offers its own Pivot Point indicator via a special plugin called
MetaTrader Supreme Edition (SE), which can be used on both MetaTrader 4 and MetaTrader 5. MTSE offers 60+ extra features in addition to the PP indicator, including custom indicators, expert advisors, and other tools.

Source: MetaTrader Supreme Edition showing EUR/USD 1H chart from 16 to 31 May 2018

Tip #2: Don’t Worry About Missed Setups

Fear and annoyance are often the main driver of entries based on your emotions rather than the trading plan itself.

Emotions can run very high when trading lower time frames. There could be a wide range of reasons for that, from missing a valid setup to chasing a setup that isn’t ready yet. A trader’s mind likes to play tricks on you.

A great step in the right direction is simply done by avoiding hasty, fearful, and stressed decisions. Always keep in mind that the financial markets will never run out of new opportunities… The best is to focus on finding a new, better setup rather than fretting about old and missed ones.

Tip #3: Fibonacci on 4 Hr/Daily Charts

When trading 5 and 15-minute charts, traders often lose sight of the developments on higher time frames.

In a way, they get distracted by minor price movements, forgetting or neglecting bigger price movements on the 4-hour and daily charts.

Higher time frames offer valuable information about the market structure. The key to understanding market structure is spotting trend and momentum, S&R levels, and price patterns.

The market structure helps assess whether the financial instrument is worth trading or not. It also helps with determining strong exit points.

The Fibonacci tool is very useful for understanding S&R levels on higher time frames. They offer key bounce and break spots, entries, and targets.

Tip #4: Markets Heat Maps Helps the Focus

There are tons of forex currency pairs, indices,commodities and other instruments that can be traded at any given moment. How does a trader choose which one is interesting?

The best is to find your niche and focus on either trending or ranging instruments, for example. You can also focus on charts that are showing particular price patterns.

In general though, price volatility is a key factor when trading. If price movement is too slow, then the trade will go sideways for a long time. My preference is for charts that show decent volatility.

Traders can analyse volatility by using the Average True Range Indicator. But another useful tip is to follow the
Market Heat Map from Admiral Markets that offers many key advantages:

  • Shows top moving instruments today, yesterday, and in the last 24 hours
  • Shows currency ranges and moves
  • Shows currency movement versus volatility

Especially, the comparison of currency movement vs. volatility is a key factor. This allows to select a pair that has both direction and volatility.

Source: Market Heat Map from Admiral Markets on 31 May 2018

The heat map shows direction on the left axis. The percentages show whether the pair has moved up (+1%) or down (-1%). The figures on the bottom show the number of moved pips. The higher the number, the greater the volatility. The best pairs tend not to have too low volatility.

Open Live Account

This material does not contain and should not be construed as containing investment advice, investment recommendations, an offer of or solicitation for any transactions in financial instruments. Please note that such trading analysis is not a reliable indicator for any current or future performance, as circumstances may change over time. Before making any investment decisions, you should seek advice from independent financial advisors to ensure you understand the risks.

Article by Admiral Markets

Source: 4 Key Tips for Trading Intraday Charts on Forex & CFD Markets


Admiral Markets is a leading online provider, offering trading with Forex and CFDs on stocks, indices, precious metals and energy.


Fibonacci Retracements Analysis 11.06.2018 (GOLD, USDCHF)

Article By RoboForex.com

XAUUSD, “Gold vs US Dollar”

As we can see in the H4 chart, XAUUSD is being corrected sideways and has already reached the retracement of 23.6%. The next targets of this correction may be the retracements of 38.2% and 50.0% at 1313.70 and 1323.50 respectively. The support level is the low at 1282.09. After breaking the current low, the instrument may continue falling towards the post-correctional extension area between the retracements of 138.2% and 161.8% at 1272.40 and 1266.50 respectively.

GOLD1
Risk Warning: the result of previous trading operations do not guarantee the same results in the future

In the H1 chart, the pair is trading sideways between 1301.60 and 1282.09, which are the resistance level and the support one respectively.

GOLD2
Risk Warning: the result of previous trading operations do not guarantee the same results in the future


USDCHF, “US Dollar vs Swiss Franc”

As we can see in the H4 chart, USDCHF has been corrected to the downside by 50.0%. The current ascending impulse is trading towards the high at 1.0056. However, the downtrend may yet continue to reach 0.9735.

USDCHF1
Risk Warning: the result of previous trading operations do not guarantee the same results in the future

In the H1 chart, the pair is being corrected upwards and has already reached the retracement of 38.2%. The next targets are the retracements of 50.0%б 61.8%, and 76.0% at 0.9923, 0.9954, and 0.9993 respectively.

USDCHF2
Risk Warning: the result of previous trading operations do not guarantee the same results in the future

Article By RoboForex.com

Attention!
Forecasts presented in this section only reflect the author’s private opinion and should not be considered as guidance for trading. RoboForex LP bears no responsibility for trading results based on trading recommendations described in these analytical reviews.

G7, Central Banks and US FED Will Drive Stock Prices This Week

By TheTechnicalTraders.com

After last weeks closing bell for stocks and the early signs of the Capital Market Shift which we mentioned previously was taking place are now clearly evident. We wanted to alert all of our followers that this week could be very dramatic with a number of key events playing into global expectations.

Our research team at Technical Traders Ltd. have been combing through the charts trying to find hints of what may happen and what to expect in terms of price volatility next week.  We know our ADL price modeling system is telling us that certain price weakness will continue in certain sectors and strength in others – but we are searching for the next opportunities for great trades.

One of the key elements of the G7 meeting is the continued communication regarding global participation in key infrastructure projects and national cooperation in regards to economic stability.

Over the past 8+ years, the bulk of the global recovery has been based on the US economic stability and recovery.  US interest rates allowed for a global “carry trade” that supported a large component of the economic bias in foreign countries.  Additionally, the deeply discounted US bonds provided a “fire sale” opportunity for many countries to secure US Treasuries at a time when global central banks were printing cash to support failing economies.  Overall, the economic conditions from 2009 to 2015 were such that every opportunity was provided to the global markets to make it easier to attempt a proper recovery.

Some nations were able to capitalize on this environment while others squandered the opportunity to create future growth, capabilities and new opportunities for success.  Given the current global market environment, we expect some harsh comments to come from the G7 meeting as well as some wishful thinking comments.  Overall, we believe the outcome of the G7 meeting will become a defining moment for the remainder of the year in terms of global economic expectations and forward intent.  It will certainly be interesting to see how these leaders decide to operate within the constructs of the ever-changing global market liabilities to say the least.

Right now, a lot of concern has been directed towards the Emerging Markets and what appears to be a near term market collapse.  Debt spreads and global indexes have been moving in a pattern that clearly illustrates the Central Banks problems in containing the diverse economic conditions throughout the globe.  Infrastructure projects, social/political shifts and currency valuations are complicating matters by creating extended pressures in many global economies recently.  All of this centers around the strength of the US economy and the US dollar as related to expectations and valuations of other foreign economies and currencies.

Almost like a double-edged sword, as the US economy/dollar continues to strengthen, foreign capital will migrate into these US assets because of the inherent protection and gains provided by the strength and growth of these markets.  While at the same time, the exodus of capital from these foreign markets create a vacuum of value/capability that results in a continued decline in asset valuations and more.

Almost like the 1994 Asian Currency Crisis, the more the US economy strengthens, the more pressures the global markets feel as valuations and assets become more risky to investors.  As investors flee this risk, they search for safe returns and value that is found in the US economy/Dollar – driving US equities higher and strengthening the US Dollar.  It is a cycle that will likely continue until some equilibrium point is reached in the future.

The US markets are on a terror rally because global capital is searching and seeking the greatest returns possible – and the only place on the planet, right now, that is offering this type of return is the US economy and the US equities market.  Our recent research shows that the NASDAQ indexes may stall and rotate over the next few months as price valuations have accelerated quite far and because the blue chips are relatively undervalued at the moment.  This means, capital will likely continue to pour into the S&P and DOW heavyweights as this capital shift continues to play out.

The G7 meeting, in Toronto, this week will likely present some interesting outcomes.  Early talk is that the G6 nations (minus the US) may enact some deal that they believe would be suitable for these nations going forward.  Our concern is not the deal or the threat of these nations trying to engage in some deal without the US – far from it.  Our concern is that their wishes may be grandiose and ill-timed given these currency and valuation issues.

Imagine, for a second, the G6 nations engage in some grand scheme to engage in something to spite the USA.  Some plan that seems big and bold and over the top.  Yet, 5 months from now, debt issues plague these nations, currency valuations have destroyed any advantage they may have perceived they had and the member nations are beginning to feel the pressures of their own entrapment.  What then?  The USA to the rescue (again)?

Recently, Ben Bernanke, a Senior Fellow at The Brookings Institute, warned that Donald Trump’s economy was like a Wile E. Coyote going over a cliff.  Everything seems well and fine till the road ends and the cliff begins.  I would like to remind all of our readers that The Brookings Institute does not have a stellar record of predicting much of anything over the past 10+ years.  Take a look at this graph showing the economic expectations and predictions from The Brookings Institute over the past decade or so.  Do these people seem capable of accurately predicting anything regarding the US or global economy?


Now, ignoring all of the what-if scenarios that are being presented by different people.  The bottom line is that the next 6+ months are going to be very exciting for traders and investors.  There are huge issues that are unfolding in the global economy right now.  Currency levels are about to be shaken even further and the G6 nations, by the time they complete their high-priced dinners and evening events, will walk out of the G7 meeting staring down a greater global debt/currency/economic beast of their own creation.

SE Asia is in the process or rewriting and resolving issues of the past 10+ years (see Malaysia/Singapore).


China is in the midst of a massive debt cycle that is about to play out over the next 18+ months (totaling about 1.8 Trillion Yuan).

The Brasil Bovespa Index has rotated into new BEARISH territory.


The Mexican iShares (EWW) ETF is about to break multi-year lows.


The Hang Seng Index is setting up a possible topping pattern that could break down given state and corporate debt concerns.


The iShares Turkey (EURONEXT) index has already broken to new multi-year lows.


The G6 better have some rabbits in their hats that they can magically transform into big bullish projects over the next 12 months or the economic functions that are at play in the world already are likely to steamroll over the top of any news that originates from the G7 meeting.

The US markets are setup for a continued bullish rally with a bit of Summer capital shifts.  Our recent research called the rotation out of the tech-heavy NASDAQ and a renewed capital shift into the S&P and the DOW leaders.  This rotation is likely to continue for many weeks or months as global investors realize the earnings capabilities and dividends values within the US blue chips are of far greater long term value than the risks associated with technology and bio-tech firms.  Because of this, we believe the S&P and DOW/Transports are setting up for a massive price rally to break recent all-time market highs.

Here is a Daily chart of the YM futures contract showing the recent price breakout and rally.  Our expectation is that 26,000 will be breached within 30 days or so and that a large capital shift will drive a continued advance through the end of 2018 – possibly further.


Here is a Daily $TRANS chart showing a similar bullish move.  Although the Transportation Index has not broken to new highs yet, we believe this upside move is just beginning and we believe the continued improvements in the US economy will drive the Transportation index to near 11,450 or higher before the end of this year.


Our opinion continues to support the hypothesis that the US markets are the only game on the planet (at the moment) and that a great capital shift is underway in terms of investment in, purchases of and generally opportunistic investment opportunities for US equities and markets going forward.  Until something changes where the US dollar strength, foreign economic weakness and foreign debt cycles are abated or resolved, we believe the great capital shift that we have been warning of will continue which will put continued pressures on certain foreign markets and expand debt burdens of at-risk nations over time.

Smart traders will be able to identify these opportunities and capitalize on them.  They will see this shift taking place and take advantage of the opportunities that arise for quick and easy profits.  If you like our research and our understanding of the global markets, be sure to join our premium research and Trade Alert Wealth Building Newsletter. Our valued members stay with us because we have continually proven to be ahead of nearly every market move this year – in many cases many months ahead of the global markets.  So, with all of this playing out over the next 6+ months, we suggest you consider joining www.TheTechnicalTraders.com to learn how we can help to keep you out of trouble and ahead of the markets for greater success.

By TheTechnicalTraders.com


Forex Technical Analysis & Forecast 11.06.2018 (EURUSD, GBPUSD, USDCHF, USDJPY, AUDUSD, USDRUB, GOLD, BRENT)

Article By RoboForex.com

EURUSD, “Euro vs US Dollar”

EURUSD has reached the first target of the descending channel and right now is being corrected towards 1.1820. Later, the market may fall to reach 1.1700, break it, and then continue falling inside the downtrend towards the short-term target at 1.1593.

EURUSD
Risk Warning: the result of previous trading operations do not guarantee the same results in the future


GBPUSD, “Great Britain Pound vs US Dollar”

GBPUSD is falling towards 1.3325. Possibly, the price may break it and then continue falling towards the first target at 1.3266. After that, the instrument may start another growth to reach 1.3360 and then resume falling towards 1.3180.

GBPUSD
Risk Warning: the result of previous trading operations do not guarantee the same results in the future


USDCHF, “US Dollar vs Swiss Franc”

USDCHF is growing towards 0.9900. Later, the market may fall towards 0.9845 and then grow to reach the short-term target at 0.9960.

USDCHF
Risk Warning: the result of previous trading operations do not guarantee the same results in the future


USDJPY, “US Dollar vs Japanese Yen”

USDJPY has completed the descending wave along with the correction and formed another consolidation range. If later the pair breaks this range to the downside, the market may fall towards 107.90; if to the upside – start another growth to test 110.24 again.

USDJPY
Risk Warning: the result of previous trading operations do not guarantee the same results in the future


AUDUSD, “Australian Dollar vs US Dollar”

AUDUSD has finished the first descending wave and right now is being corrected. Possibly, the price may grow towards 0.7620 and then fall to reach the short-term target at 0.7540.

AUDUSD
Risk Warning: the result of previous trading operations do not guarantee the same results in the future


USDRUB, “US Dollar vs Russian Ruble”

USDRUB has broken its consolidation channel upwards, reached the first upside target, and then returned to the channel’s broken border. Possibly, today the price may form a new ascending structure towards 63.20. Later, the market may continue trading to the downside with the target at 61.18.

USDRUB
Risk Warning: the result of previous trading operations do not guarantee the same results in the future


XAUUSD, “Gold vs US Dollar”

Gold is being corrected and forming the Flag pattern. Today, the price may fall towards 1288.00, break it, and then continue this decline to reach the short-term target at 1275.00.

GOLD
Risk Warning: the result of previous trading operations do not guarantee the same results in the future


BRENT

Brent is forming a new ascending wave with the first target at 78.32. Today, the price may fall towards 75.80 and then grow to reach the above-mentioned target. Later, the market may fall to return to 75.80, thus forming another consolidation range. If later the pair breaks this range to the upside, the market may grow towards 80.50; if to the downside – continue the correction to reach 72.00.

BRENT
Risk Warning: the result of previous trading operations do not guarantee the same results in the future

Article By RoboForex.com

Attention!
Forecasts presented in this section only reflect the author’s private opinion and should not be considered as guidance for trading. RoboForex LP bears no responsibility for trading results based on trading recommendations described in these analytical reviews.

COT Report: US Dollar & Bitcoin bearish bets rise. Crude & Gold bets fall again

By CountingPips.com

Here is a short summary and this week’s links (below) to the latest Commitment of Traders changes that was released on Friday.


Currency Speculators raised US Dollar bearish bets for 1st time in 7 weeks

US Dollar net speculator positions leveled at $-5.54 billion as of Tuesday

The latest data for the weekly Commitment of Traders (COT) report, released by the Commodity Futures Trading Commission (CFTC) on Friday, showed that large traders and currency speculators increased their bearish bets for the US dollar this week. See full article


WTI Crude Oil Speculators dropped their bullish bets for 7th week

The non-commercial contracts of WTI crude futures totaled a net position of 583,576 contracts, according to data from this week. This was a slide of -24,252 contracts from the previous weekly total. See full article


Gold Speculators cut bullish net positions for 3rd time in 4 weeks

The large speculator contracts of gold futures totaled a net position of 111,416 contracts. This was a weekly decline of -3,714 contracts from the previous week. See full article


10-Year Note Speculators sharply cut back on their record bearish bets

The large speculator contracts of 10-year treasury note futures totaled a net position of -397,546 contracts. This was a weekly increase of 73,521 contracts from the previous week. See full article


S&P500 Mini Speculators raised bullish net positions for 1st time in 3 weeks

The large speculator futures contracts of S&P500 Mini futures, traded by large speculators and hedge funds, totaled a net position of 162,136 contracts in the data reported through Tuesday. See full article


Silver Speculators increased their net positions for 5th week

The non-commercial contracts of silver futures totaled a net position of 19,434 contracts, according to data from this week. This was a weekly gain of 1,981 contracts from the previous totals. See full article


Copper Speculators sharply boosted bullish bets to highest since February

The large speculator contracts of copper futures totaled a net position of 47,707 contracts. This was a weekly boost of 10,107 contracts from the data of the previous week. See full article


Article by CountingPips.com

The Commitment of Traders report data is published in raw form every Friday by the Commodity Futures Trading Commission (CFTC) and shows the futures positions of market participants as of the previous Tuesday (data is reported 3 days behind).

To learn more about this data please visit the CFTC website at http://www.cftc.gov/MarketReports/CommitmentsofTraders/index.htm


Currency Speculators raised US Dollar bearish bets for 1st time in 7 weeks

By CountingPips.comGet our weekly COT Reports by Email

US Dollar net speculator positions leveled at $-5.54 billion this week

The latest data for the weekly Commitment of Traders (COT) report, released by the Commodity Futures Trading Commission (CFTC) on Friday, showed that large traders and currency speculators increased their aggregate bearish bets for the US dollar this week.

Non-commercial large futures traders, including hedge funds and large speculators, had an overall US dollar net position totaling $-5.54 billion as of Tuesday June 5th, according to the latest data from the CFTC and dollar amount calculations by Reuters. This was a weekly decline of $-0.69 billion from the $-4.85 billion total position that was registered the previous week, according to the Reuters calculation (totals of the US dollar contracts against the combined contracts of the euro, British pound, Japanese yen, Australian dollar, Canadian dollar and the Swiss franc).

The aggregate speculative positions had risen for six straight weeks to the least bearish level since January 2nd before bearish bets rose this week. Overall, the dollar position remains in bearish territory for a 47th consecutive week dating back to July 18th 2017.


Weekly Speculator Contract Changes: Peso plunge continues into bearish territory

This week saw just one substantial changes (+ or – 10,000 contracts) in the individual currency contract level for the speculators category.

Mexican peso speculative bets continued to decline sharply and fell by at least -10,000 contracts for a fourth straight week. This week the MXN bets decreased by -29,446 contracts. Overall, the speculator peso bets have now dropped for eight straight weeks and the MXN spec position dipped into a bearish position for the first time since April 11th of 2017.

Overall, the major currencies that improved against the US dollar this week were the Japanese yen (4,599 contracts), Swiss franc (4,215 contracts), Australian dollar (3,027 contracts) and the New Zealand dollar (2,982 contracts).

The currencies whose speculative bets declined this week versus the dollar were the euro (-3,801 weekly change in contracts), British pound sterling (-2,132 contracts), Canadian dollar (-349 contracts) and the Mexican peso (-29,446 contracts).


Table of Weekly Commercial Traders and Speculators Levels & Changes:

CurrencyNet CommercialsComms Weekly ChgNet SpeculatorsSpecs Weekly Chg
EuroFx-94,60216,43189,236-3,801
GBP3,7998,0107,345-2,132
JPY9,747-6,792-3,4374,599
CHF62,4511,537-39,2164,215
CAD20,3611,384-16,039-349
AUD36,602-4,720-20,2083,027
NZD-675-3,1614,3832,982
MXN13,95230,613-11,110-29,446


This latest COT data is through Tuesday and shows a quick view of how large speculators or non-commercials (for-profit traders) as well as the commercial traders (hedgers & traders for business purposes) were positioned in the futures markets. All currency positions are in direct relation to the US dollar where, for example, a bet for the euro is a bet that the euro will rise versus the dollar while a bet against the euro will be a bet that the dollar will gain versus the euro.


Weekly Charts: Large Trader Weekly Positions vs Price

EuroFX:


British Pound Sterling:


Japanese Yen:


Swiss Franc:


Canadian Dollar:


Australian Dollar:


New Zealand Dollar:


Mexican Peso:


*COT Report: The weekly commitment of traders report summarizes the total trader positions for open contracts in the futures trading markets. The CFTC categorizes trader positions according to commercial hedgers (traders who use futures contracts for hedging as part of the business), non-commercials (large traders who speculate to realize trading profits) and nonreportable traders (usually small traders/speculators). Find CFTC criteria here: (http://www.cftc.gov/MarketReports/CommitmentsofTraders/ExplanatoryNotes/index.htm).

The Commitment of Traders report is published every Friday by the Commodity Futures Trading Commission (CFTC) and shows futures positions data that was reported as of the previous Tuesday (3 days behind).

Each currency contract is a quote for that currency directly against the U.S. dollar, a net short amount of contracts means that more speculators are betting that currency to fall against the dollar and a net long position expect that currency to rise versus the dollar.

(The charts overlay the forex closing price of each Tuesday when COT trader positions are reported for each corresponding spot currency pair.) See more information and explanation on the weekly COT report from the CFTC website.

Article by CountingPips.com

Fibonacci Retracements Analysis 08.06.2018 (BITCOIN, ETHEREUM)

Article By RoboForex.com

BTCUSD, “Bitcoin vs US Dollar”

As we can see in the H4 chart, BTCUSD is being corrected to the upside and has already reached the retracement of 38.2%. The next targets of this rising correction may be the retracement of 50.0% and 61.8% at 7830.00 and 8013.00 respectively. The support level is the low at 7051.00.

BTCUSD1
Risk Warning: the result of previous trading operations do not guarantee the same results in the future

As we can see in the H1 chart, after being corrected by 50.0%, BTCUSD has started a new ascending movement. If the price breaks the high at 7774.50, the instrument may continue trading towards the post-correctional extension area between the retracements of 138.2% and 161.8% at 7935.00 and 8035.00 respectively.

BTCUSD2
Risk Warning: the result of previous trading operations do not guarantee the same results in the future


ETHUSD, “Ethereum vs. US Dollar”

As we can see in the H4 chart, the convergence made ETHUSD finish the downtrend and start a new correction, which has already reached the retracement of 38.2%. The next upside targets may be the retracements of 50.0% and 61.8% at 667.50 and 705.50 respectively. The support level is at 504.50.

ETHUSD1
Risk Warning: the result of previous trading operations do not guarantee the same results in the future

In the H1 chart, ETHUSD is being corrected in the form of the Triangle pattern. By now, the correction has already reached the retracement of 38.2% and may continue towards the retracements of 50.0% and 61.8% at 556.20 and 552.00 respectively.

ETHUSD2
Risk Warning: the result of previous trading operations do not guarantee the same results in the future

Article By RoboForex.com

Attention!
Forecasts presented in this section only reflect the author’s private opinion and should not be considered as guidance for trading. RoboForex LP bears no responsibility for trading results based on trading recommendations described in these analytical reviews.