On Tuesday the 3rd of July, trading on the euro closed slightly up. The single currency recovered to 1.1673 at the opening of the European session before the market entered a correctional phase. Positive US data gave the dollar some respite. The number of factory orders exceeded expectations and posted an increase on last month’s value.
With US Independence Day approaching, trader activity on the market was relatively low.
US data:
Factory orders (Jun): 0.4% (forecast: 0.1%, previous reading revised from -0.3% to -0.4%).
Day’s news (GMT+3):
10:15 Spain: Markit services PMI (Jun).
10:45 Italy: Markit services PMI (Jun).
10:50 France: Markit services PMI (Jun).
10:55 Germany: Markit services PMI (Jun).
11:00 Eurozone: Markit services PMI (Jun).
11:30 UK Markit services PMI (Jun).
24h USA: Independence Day.
Fig 1. EURUSD hourly chart. Source: TradingView
Current situation:
Tuesday’s target was not reached. The pair went into a correctional phase above the balance line. The euro rose to 1.1679 in Wednesday’s Asian session. From there, it dropped to 1.1660 before returning to its current level of 1.1673.
There’s a strong resistance level in the works at 1.1680. Various lines from different highs intersect at this point. If buyers manage to break this level, they should continue as far as 1.1700. In my forecast, I expect the euro to decline throughout the European session, closing at 1.1600.
Today is a national holiday in the US as the country celebrates its independence. Trader attention will be turned towards the Markit services PMI data for European countries. The most influential of these will be the British.
A fresh wave of US data is set to be released towards the end of the week. The minutes of the FOMC’s latest meeting will be published on Thursday, while the Nonfarm Payrolls report for June will be released on Friday. In addition, Friday is when US tariffs on a number of Chinese goods will come into effect.
The British Pound is looking rather sad on the currency market today. It’s not only because of the USD behavior, that puts pressure on other traded currencies. Another reason is that investors are trying to avoid any risks that are connected with the Pound, including the Brexit complications.
The United Kingdom and the European Union are less than 6 months away from the moment when they have to wrap up the Brexit talks. In fact, in the nearest future politicians of both parties should become more active. Right now, the British financial sector is starting to assess what is going on in the country’s economy in a fresh new way and it seems that the future is scaring them.
According to the survey conducted by the Confederation of British Industry, the third of those surveyed aren’t sure that the Brexit procedure will start within the time specified, i.e in March 2019. Most of all, they are worried about trans-border contacts and transfers, which may really “glitch” during the transition period, which will last until the end of 2020.
British companies, including financial ones, still don’t know within which legal domains they will operate during the transition period. The conditions haven’t been ratified yet and the parties may spend really much time on final agreements. Another thing, which is still not quite clear, is how the United Kingdom and the European Union will continue trading. Right now, British companies believe that the transition period may become some kind of “the Time of Troubles”, when they may face a lot of obstacles. Of course, such things don’t make the Pound more optimistic.
Later in the afternoon, the United Kingdom will report on the Construction PMI, but investors aren’t likely to respond to these numbers, because after that they will be presented the FPC Meeting Minutes, which seems much more interesting.
The current descending tendency is keeping GBPUSD inside the long-term channel. If one takes a closer look at the channel, it can be seen that the pair has failed to reach the support line while updating the lows, which means that the tendency is getting weaker. The same can be told about the short-term downtrend. However, the main “event“ is the price’s testing the resistance lines of both short-term and long-term channels. If the pair fixes above the resistance line, it may start a new rising impulse towards the resistance line of the projected channel at 1.3330. Still, if the instrument breaks the support line at 1.3095, it may continue falling towards the psychologically-crucial level at 1.3000. But the main target of the short-term downtrend may be the support level at 1.2870.
Author: Dmitriy Gurkovskiy, Chief Analyst at RoboForex
Disclaimer
Any forecasts contained herein are based on the authors’ particular opinion. This analysis may not be treated as trading advice. RoboForex bears no responsibility for trading results based on trading recommendations and reviews contained herein.
The benchmark for the German economy, DAX, is celebrating its 30th birthday. For this occasion, Admiral Markets — a global Forex and CFD online broker — announced a special limited-time campaign, offering a typical spread of 0.5 points on DAX30 CFD, no commissions and no campaign registration.
Admiral Markets clients can usually trade DAX30 CFDs 24 hours a day, five days a week, commission-free with a spread of 0.8 points only, using MetaTrader 4 and MetaTrader 5 platforms or the Supreme Edition plugin.
“On 1 July 2018, the German index DAX celebrates its 30th anniversary. The index was founded, starting with a price of 1.163 points, and 30 years later we saw an all-time-high of over 13.559.60 points — what a success story! Celebrate DAX’s anniversary and trade with the best, lowest spread we have ever offered!”, says Jens Chrzanowski, member of the Management Board of Admiral Markets Group AS.
Jens Chrzanowski, Member of the Management Board of Admiral Markets Group AS
DAX tracks the performance of 30 of the largest and most liquid companies on the German stock market, representing over 80 percent of the aggregate market capitalisation of listed German stock corporations, such as Adidas, Bayer, BMW, Continental, Deutsche Bank, Volkswagen, Siemens and others.
Admiral Markets is a leading online Forex and CFD trading provider. In addition to a wide range of financial instruments, Admiral Markets offers free educational materials, including analytics, webinars and seminars.
As we start the July 4th trading week, it is time to look at the current market setup for signs of future strength or weakness. Yes, there is a lot of outside economic and geopolitical factors at play right now that could cause some major market moves, yet we continue to believe the US equities markets are setting up for another upside move after retesting support and shaking out some trades.
Recently, there has been quite a bit of chatter about foreign and US debt levels as well as credit cycle events that many industry leaders are concerned with. Overall, yes, we have to be cautious of a pricing level revaluation as a result of the credit cycles that are changing.
As the US Fed increases rates, this puts pressures on a vast array of credit market events that may cause some pricing concerns and economic concerns as foreclosures and repossessions tick higher. Yet, we believe the valuations within the stock market are currently based on a companies level of operations and ability to generate returns. Therefore, we believe the Q2 earning season, which is about to befall us, should be a very clear indication at to how well or poorly the US stock market is fairing in regards to fair pricing.
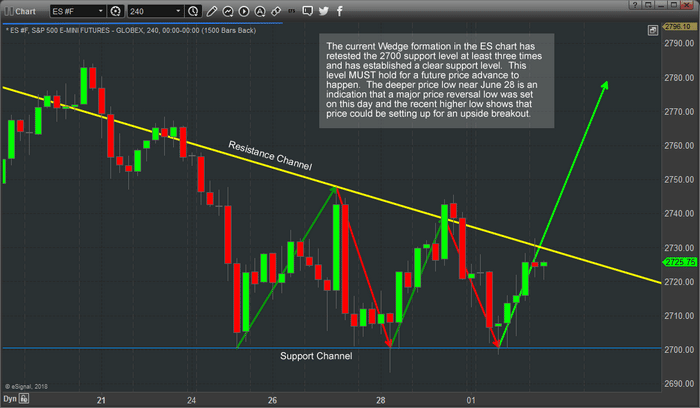
This first chart, the ES 240-minute chart, clearly shows the WEDGE price pattern that we are following. By our estimates, this pattern is nearly complete (showing the completed 5 wave setup) and this pattern should likely prompt a moderately strong upside price breakout before the end of this trading week. Of course, the July 4th holiday will interrupt trading for a bit, but we believe the 2700 bottom/support levels are already in place and as long at that support level holds, the upside is the only outcome for this wedge formation.
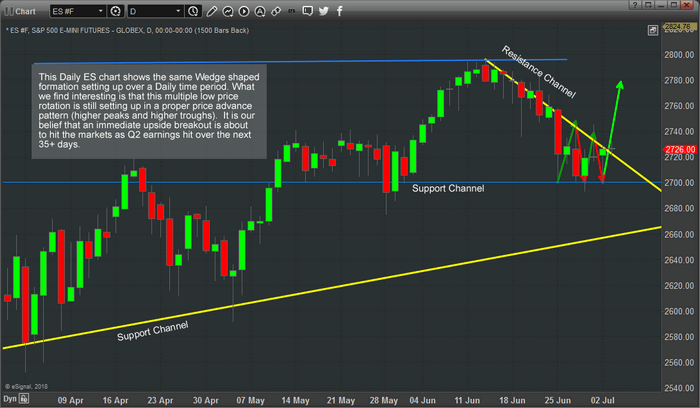
This second chart is the ES Daily chart showing the same WEDGE formation over a longer span of time. Notice the clear support channels and the resistance channel that has contained price over the past 20+ days. This has been the nexus of the price decline and the root issue of much concern regarding downside price capabilities.
The one thing that may people fail to understand is that the historical price peaks and troughs are still indicative of Upside Price Channeling with higher troughs and higher peaks overall. We believe the 2700 level will hold as support and the ES chart will begin an upside price swing that could likely result in a rally to 2800+ quickly.
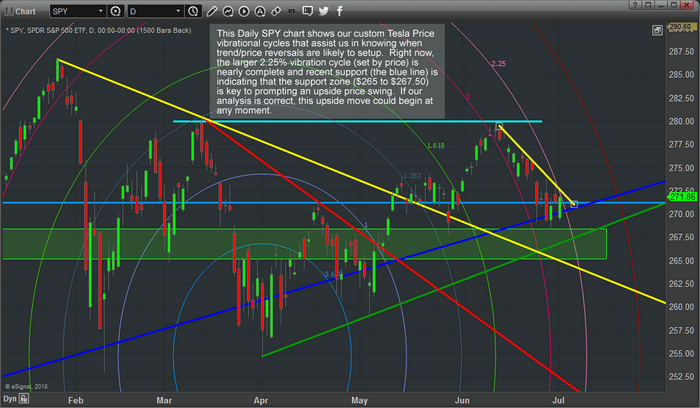
To add a bit of a kicker to this analysis report, this, our custom Tesla Price Vibrational Cycles analysis is showing us that the 2.25% vibrational cycle is nearly complete and that price is holding above the green support zone as well as holding above the blue price support channel. These Tesla Price Cycles operate as price boundaries and breakout zones. When price nears one of these levels, depending on the previous price direction and activity, we should expect a potential price reversal or breakout pattern – depending on the setup.
Right now, the setup is “strong support with rotational price channeling showing an upside potential”. This Tesla price cycle indicates that “as long as support holds, we should expect to see an upside breakout/trend with a potential for a move to $277.50 or $280+ as the final outcome.
This holiday week would be a perfect time to catch the markets by surprise with a big rally. Although it may not happen, we believe there is a strong potential for a surprise breakout rally soon and we believe these support levels are proving strong enough to prompt further upside price rallies. Even though many skills analysts are concerned about the credit cycles and global debt levels, we know the game can continue much longer than many people think it is possible to continue. As the old saying goes, “don’t ever get married to a position”. We are positioned for success if our analysis is correct and we will take small losses if support is broken and price moves lower. We believe the shorts, which there are many at this point in time, are about to feel some serious “squeeze pressure” over the next few weeks.
Visit www.TheTechnicalTraders.com to learn how we can help you find and execute better trading solutions, better research and provide a top-tier solution for active traders. If you like our research and find it helps you, then consider joining our other valued members in supporting our work and taking advantage of our solutions for active traders. Want to know where this market is headed and what to expect throughout the end of this year and beyond – our members already know what our predictive modeling systems are suggesting for the next 5+ months.
Our articles, Technical Trading Mastery book, and 3 Hour Trading Video Course are designed for both traders and investors to explore the tools and techniques that discretionary and algorithmic traders need to profit in today’s competitive markets. Created with the serious trader and investor in mind – whether beginner or professional – our approach will put you on the path to win. Understanding market structure, trend identification, cycle analysis, volatility, volume, when and when to trade, position management, and how to put it all together so that you have a winning edge.
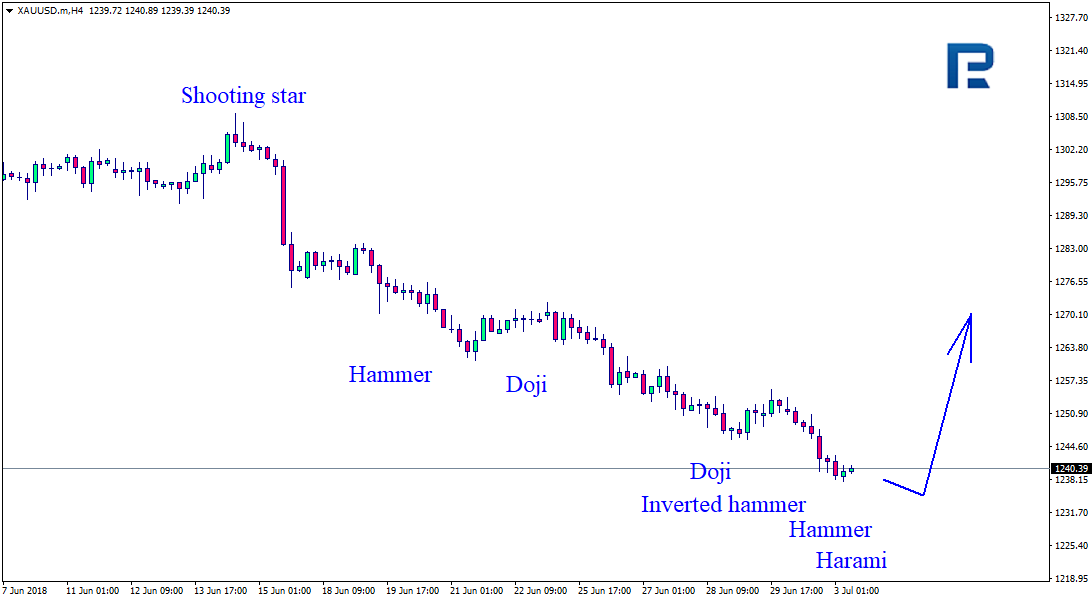
As we can see in the H4 chart, after breaking the support level, XAUUSD has formed several Doji, Hammer, and Inverted Hammer reversal patterns. Judging by the previous movements, it may be assumed that the price may try to rebound in the nearest future and start a new ascending tendency.
NZDUSD, “New Zealand vs. US Dollar”
As we can see in the H4 chart, after breaking the support level, NZDUSD has formed several Hammer, Engulfing, and Harami reversal patterns. At the moment, it may be assumed that the instrument may update the lows, reverse, and resume the uptrend.
Attention! Forecasts presented in this section only reflect the author’s private opinion and should not be considered as guidance for trading. RoboForex LP bears no responsibility for trading results based on trading recommendations described in these analytical reviews.
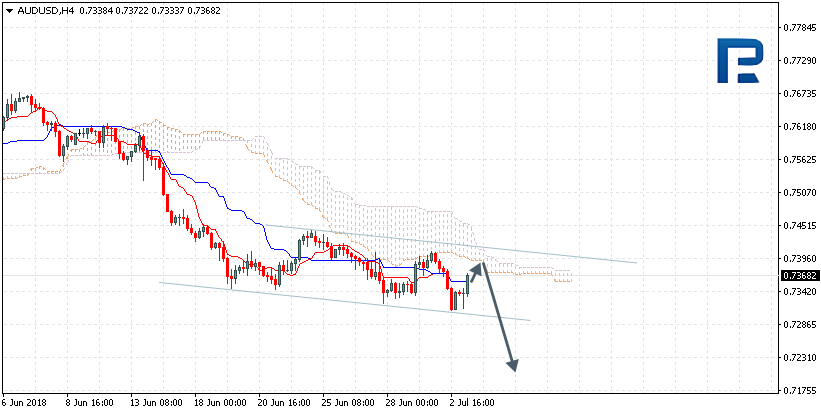
AUDUSD is trading at 0.7368; the instrument is moving below Ichimoku Cloud, which means that it may continue falling. The markets could indicate that the price may test the downside border of the cloud at 0.7385 and then continue moving downwards to reach 0.7210. Another signal to confirm further descending movement is the price’s rebounding from the channel’s upside border. However, the scenario that Implies further decline may be cancelled if the price breaks the upside border of the cloud and fixes above 0.7415. In this case, the pair may continue growing towards 0.7525.
NZDUSD, “New Zealand Dollar vs US Dollar”
NZDUSD is trading at 0.6711; the instrument is moving below Ichimoku Cloud, which means that it may continue falling. The markets could indicate that the price may test Tenkan-Sen and Kijun-Sen at 0.6765 and then continue moving downwards to reach 0.6605. Another signal to confirm further descending movement is the price’s rebounding from the channel’s upside border. However, the scenario that implies further decline may be cancelled if the price breaks the upside border of the cloud and fixes above 0.6850. In this case, the pair may continue growing towards 0.6950.
USDCAD, “US Dollar vs Canadian Dollar”
USDCAD is trading at 1.3177; the instrument is moving inside Ichimoku Cloud, which means that it is moving sideways. The markets could indicate that the price may test Tenkan-Sen and Kijun-Sen at 1.3195 and then continue moving downwards to reach 1.3020. Another signal to confirm further descending movement is the price’s rebounding from the resistance level. However, the scenario that implies further decline may be cancelled if the price breaks the upside border of the cloud and fixes above 1.3315. In this case, the pair may continue growing towards 1.3420.
Attention! Forecasts presented in this section only reflect the author’s private opinion and should not be considered as guidance for trading. RoboForex LP bears no responsibility for trading results based on trading recommendations described in these analytical reviews.
On Tuesday the 2nd of July, trading on the euro closed down. Germany’s political crisis coupled with the overall strengthening of the dollar put pressure on the pair.
US economic activity indices exceeded expectations. Against the backdrop of positive statistics, US 10-year Treasury yields rose to 2.870%. After dipping to 1.1591, the euro recovered to 1.1648. By this time we had already seen a technical correction following the close of the European session.
US data:
The ISM manufacturing PMI in June hit 60.2 (forecast: 58.4, previous: 58.7).
The Markit manufacturing PMI in June rose to 55.4 (forecast: 54.8, previous: 54.3).
Day’s news (GMT+3)
11:30 UK: PMI construction (Jun), FPC meeting minutes.
12:00 Eurozone: PPI (MoM) (May), retail sales (MoM) (May).
17:00 US: factory orders (MoM) (May).
19:00 Eurozone: ECB’s Praet speech.
Fig 1. EURUSD hourly chart. Source: TradingView
Current situation:
Expectations concerning yesterday’s decline on the euro were fully justified. Euro bears broke the trend line and reached 67 degrees. The fall was quite hard.
From a minimum of 1.1591, the price recovered by 45 degrees. The euro is trading near the balance line (sma 55). Given that the market will close early in the US due to Independence Day (the 4th of July), volatility could rise by the evening.
During European trading, the price may recover to 1.1676 due to the crosses. If you’re thinking about selling euros, then keep an eye on the resistance zone (H1.1721 and H1.1690). Movements on the crosses could lead to a breakout. The dollar is trading in positive territory against the Swiss franc and yen. This means that the demand for risky assets has increased. If buyers pass through the resistance of 1.1677, then they will open the way to 1.1745. The upper line of the channel is formed from the lows of 1.1508 and 1.1827. If the support of 1.1619 doesn’t hold, then we’ll move towards the lower boundary of the channel (1.1545).
As we can see in the H4 chart, XAUUSD is still trading to the downside. After reaching the post-correctional extension area between the retracements of 138.2% and 161.8%, the pair continued falling towards the retracement of 261.8%, which is close to the long-term support level at 1236.50. At the same time, the convergence is being formed, which may indicate a possible pullback after the instrument reaches its targets. The resistance level is at 1265.00.
In the H1 chart, the convergence made the pair reverse and start a new correction to the upside, which has already reached the retracement of 38.2%. The next target may be the retracement of 50.0% at 1259.20.
USDCHF, “US Dollar vs Swiss Franc”
As we can see in the H4 chart, USDCHF has failed to break the retracement of 76.0%. The price may fall towards the support level at 0.9851, thus continuing its sideways movement. However, if the pair breaks the short-term resistance level, the instrument may reach the high at 1.0056, break it, and then continue growing to reach the post-correctional extension area between the retracements of 138.2% and 161.8% at 1.0158 and 1.0222 respectively.
In the H1 chart, the pair has been corrected downwards by 61.8% and may continue trading towards the retracement of 76.0% at 0.9888.
Attention! Forecasts presented in this section only reflect the author’s private opinion and should not be considered as guidance for trading. RoboForex LP bears no responsibility for trading results based on trading recommendations described in these analytical reviews.
EURUSD is forming another descending structure towards 1.1475. After that, the instrument may resume growing to reach 1.1600 and continue trading downwards with the target at 1.1425.
GBPUSD, “Great Britain Pound vs US Dollar”
GBPUSD is moving downwards. Possibly, the pair may fall to reach 1.3030 and then grow towards 1.3266. Later, the market may start another decline with the target at 1.2933.
USDCHF, “US Dollar vs Swiss Franc”
USDCHF is moving upwards. Today, the price may grow to break 0.9860 and then continue trading to the upside to reach the short-term target at 1.0080.
USDJPY, “US Dollar vs Japanese Yen”
USDJPY is consolidating at the top of the ascending wave. Possibly, today the pair may reach 110.32. After that, the instrument may break this level to the downside and then continue trading downwards with the first target at 109.58.
AUDUSD, “Australian Dollar vs US Dollar”
AUDUSD is moving downwards. Possibly, the pair may continue trading downwards to reach 0.7285. Later, the market may start another growth towards 0.7478.
USDRUB, “US Dollar vs Russian Ruble”
USDRUB is falling. Today, the price may reach 62.13, break it, and then continue trading downwards with the short-term target at 60.77.
XAUUSD, “Gold vs US Dollar”
Gold is falling as well. Possibly, the pair may reach 1243.00 and then form another ascending structure towards 1257.00. After that, the instrument may resume falling with the target at 1240.00.
BRENT
Brent has expanded its consolidation range towards 77.70 and right now is trading close to it. Today, the price may continue trading upwards. The short-term target is at 81.30.
Attention! Forecasts presented in this section only reflect the author’s private opinion and should not be considered as guidance for trading. RoboForex LP bears no responsibility for trading results based on trading recommendations described in these analytical reviews.
On Friday the 29th of June, the euro surged against the US dollar. Demand for the euro increased after the news that EU leaders reached an agreement on migration. The single currency also enjoyed support from positive Eurozone data along with the general decline of the greenback. The EURUSD pair closed the day at 1.1682, marking a rise of 0.99%.
US data:
Chicago PMI (Jun): 64.1 (forecast: 60.0, previous: 62.7).
Michigan consumer sentiment index (Jun): 98.2 (forecast: 99.2, previous: 99.3).
Day’s news (GMT+3):
10:15 Switzerland: real retail sales (May).
10:30 Switzerland: SVME – PMI (Jun).
10:45 Italy: Markit manufacturing PMI (Jun).
10:50 France: Markit manufacturing PMI (Jun).
10:55 Germany: Markit manufacturing PMI (Jun).
11:00 Eurozone: Markit manufacturing PMI (Jun).
12:00 Eurozone: unemployment rate (May).
16:45 USA: Markit manufacturing PMI (Jun).
17:00 USA: ISM manufacturing PMI (Jun).
Fig 1. EURUSD hourly chart. Source: TradingView
Trading on the euro opened down on Monday after the US dollar made some gains across the board. In addition to the dollar, the euro crosses are also now piling pressure on the single currency. This pressure is mostly the result of political turmoil.
This time, traders have reacted negatively to a publication from Rheinische Post, which reported that the German CDU and CSU parties are planning to hold another meeting to discuss the migration deal reached on Friday. Clearly, someone isn’t happy with the current policy.
In Asia, the euro has dropped from 1.1690 to 1.1637 (-53 pips). Friday closed with a wedge, and the price moved out of it early this morning. It would have been too late to open a short position from the 135th degree before the weekend, and as of this morning the pair is already trading at 1.1655.
The downwards correction from the high of 1.1690 came to 45 degrees. I think that this downwards movement will continue after a slight pullback. If we catch the Fibo levels on the downwards wave from 1.1690 to 1.1637, we can think about selling from around 1.1657 – 1.1665 (38.2 – 50%).
On the current hour (9:00 GMT+3), the trend line and balance line are intersecting at 1.1615. Today, they’re acting as supports. I’m expecting a breakout of the trend line at 1.1633 at around 18:00 (GMT+3). Today is Monday, so this drop could be in response to Friday’s movements and it could continue until the end of the US session.