EURUSD is consolidating close to the upside border of the range. Possibly, the pair may form another descending structure to reach 1.1625. After breaking this level, the instrument may continue falling towards 1.1527 or even 1.1425.
GBPUSD, “Great Britain Pound vs US Dollar”
GBPUSD is forming a new descending structure. Possibly, today the pair may fall to reach 1.3157 and then resume growing towards 1.3220. Later, the market may continue trading to the downside with the target at 1.3025.
USDCHF, “US Dollar vs Swiss Franc”
USDCHF is consolidating around 0.9930. Possibly, the pair may fall to reach 0.9898. After that, the instrument may grow to break 0.9990 and then continue trading to the upside with the target at 1.0080.
USDJPY, “US Dollar vs Japanese Yen”
USDJPY has completed the correction at 110.70. Today, the price may form another descending structure to reach 110.24 and then resume growing with the target at 110.70. Later, the market may towards 109.04.
AUDUSD, “Australian Dollar vs US Dollar”
AUDUSD is forming the first correctional impulse towards 0.7355. Later, the price may trading to the upside with the target at 0.7480.
USDRUB, “US Dollar vs Russian Ruble”
USDRUB is consolidating around 63.00. Possibly, the pair may fall to break 62.08 and then continue trading downwards with the short-term target at 60.70.
XAUUSD, “Gold vs US Dollar”
Gold is being corrected towards 1249.00. After that, the instrument may form a new ascending structure to reach 1270.00.
BRENT
Brent is consolidating around 77.70 without any particular direction. Possibly, the pair may grow to reach 80.70 and then fall to return to 78.90. Later, the market may continue trading upwards to reach 82.00.
Attention! Forecasts presented in this section only reflect the author’s private opinion and should not be considered as guidance for trading. RoboForex LP bears no responsibility for trading results based on trading recommendations described in these analytical reviews.
On Thursday the 6th of July, trading on bitcoin closed 0.85% down. It spent most of its time consolidating around 6,606 USD.
Trading in the US opened down. There was no real appetite for bitcoin among Americans following Independence Day. The crowd was split into two camps. There was an active struggle around the trend line at 6,560 USD, where buyers were forced to retreat. The rate then dropped to 6,429 USD as a result of the breakout of the trend line. Sellers then went on the attack after the closing of the European session.
Bitcoin is currently trading at 6,521 USD. The drop stopped at the 38.2% Fibo (growth from 5,773 to 6,820). Buyers are still in a good position as long as prices stay above 6,400 USD. Another 2 days above this level will neutralise all bearish signals.
If 6,400 falls to the bears, this will mark the beginning of a new phase of decline for bitcoin. The lower boundary of the A-A channel will be the last front from which the bulls may be able to revive the rally.
Look at how after the price rebounded from 6,675, the market recreated the pattern from the 18th of 22nd of June. If sellers are active today, they could bring the rate back as far as 6,150 without too much difficulty. On the other hand, inactivity on their part will strengthen the position of buyers.
I’ve made a template for reference. I’m always looking for similar patterns in the price history with high positive correlations to give me an idea of how the crowd will react in certain situations. If you can find a pattern that repeats itself 3 times, you know what to expect from the market in the future. If fundamentals don’t get in the way, the price will move as expected.
The stochastic is in the sell zone for BTC. Decline could set in at any moment. Otherwise, the price will remain at its current level until trading opens in Europe.
On Thursday the 5th of July, trading on the euro closed up at 1.1689. The single currency was bolstered by a strong factory orders report from Germany as well as a report from Bloomberg published on the 4th of July. The news report said that several members of the EBC’s governing council think that a rate hike at the end of 2019 will be too late.
On the back of a broadly weaker dollar, the euro recovered to 1.1720, after which a correction took it back to 1.1673. The correction began after the release of positive data from the US.
According to the minutes of the FOMC’s latest meeting, committee members are confident about the future growth of the US economy and about the regulator’s plan for future interest rate hikes.
At the time of writing this review, the euro is trading at 1.1705 against an intraday high of 1.1715. Most of the euro crosses are trading up. The dollar is holding its ground in the green against the yen. Buyers are getting ready to attack the range of 1.1720 – 1.1730, which would pave the way towards 1.1835. Market participants are hesitant to enter the market, however, ahead of the NFP report, which comes out at 15:30 EET.
After the NFP report, trader attention will shift back to the trade dispute between the US and China. The US is expected today to impose tariffs on 34bn USD of Chinese goods. As soon as they come into effect, China will impose its own retaliatory tariffs in equal measure.
Volatility is expected to be very high during the US session. Today, we need to keep an eye on the safe havens: the yen, franc, and gold. If the NFP turns out worse than expected, the euro could shoot up to 1.1790 (U3) provided that we don’t see a retreat towards the safe havens.
If the NFP report is better than expected, and the dollar gets a boost across the market, the euro is likely to drop to around 1.1663. The more the report deviates from expectations, the further down we’ll go. The report includes a host of indicators, so it’s far from clear how traders will react to them individually.
When reports emerged that India and China are in talks about forming an oil buyers’ club, OPEC was probably too busy with its upcoming June 22 meeting to concern itself with that dangerous alliance. Now, it may be time for it to start worrying.
“The timing is right. The boom in U.S. oil and gas production gives us greater leverage against OPEC,” the Times of India quoted an Indian official as saying last month after the formal start of said talks. The two countries, after all, account for a combined 17 percent of global oil consumption and they are the ones that would be the hardest hit if prices rise as a result of OPEC’s actions.
What’s more, they might not be alone in this attempt to curb OPEC’s clout on the global oil market. According to Bloomberg’s Carl Pope, Europe and Japan, previously reluctant to take part in any anti-OPEC projects, may now join in. The reason they are likely to join in is that unlike in previous oil price cycles, now there are alternatives to fossil fuels.
Electrification is where OPEC may have to face off with a future oil buyers’ cartel.
India, China, and Europe are all very big on EV adoption. Japan is a leader in battery manufacturing. If they set their minds to it, these four players could upend the oil market and effectively cripple OPEC. Of course, this is a best-case scenario of the kind that rarely unfolds in reality.
Let’s take India, for example. A recent survey suggested that as many as 90 percent of Indian drivers were willing to switch to EVs if the government built the necessary charging infrastructure, reduced road taxes, and increased subsidies. Another survey identified price and range as additional roadblocks towards the mass adoption of EVs in India. Because of these challenges, New Delhi recently amended its ambitious goal of having an all-EV fleet on the roads of the country by 2030 to having 30 percent of the fleet electric.
China, for its part, is the undisputed leader in global EV adoption: the country accounted for more than 50 percent of global EV sales last year in case you were thinking, “Wait, wasn’t that Norway?” However, this was in large part made possible by generous government subsidies for EV manufacturing. These subsidies are due to be wound down to 0 by 2020, and carmakers are already beginning to brace for a future without the support of the state. It’s safe to say it remains uncertain if the EV boom will continue after 2020.
This precarious situation with EVs is reason enough for China and India to seek more clout on international oil markets dominated by OPEC and would justify the formation of a “buyers’ club.” Europe, for its part, is, as a whole, a top performer in EV adoption and it is also very big on environmentalism. At the same time, it still imports crude and quite a lot of it, so it cares about oil prices as a large buyer.
China and India are facing challenges in EV adoption. Europe could help and benefit from it. After all, taken together, Europe, China, India, and Japan account for the manufacturing of as much as 65 percent of the world’s cars, and a lot of these are manufactured in Europe. These four also consume 35 percent of the world’s crude oil and would like to reduce this number.
According to Pope, if they get together, they would be able to negotiate either a more gradual or a faster shift to EVs. It would all depend on whether OPEC would agree to maintain lower prices or not.
A more skeptical view would note the challenges in EV adoption such as subsidies and infrastructure. These would take time to be overcome even if everyone played together. Yet long-term, an oil buyers’ alliance could be a force to be reckoned with by the oil producers, and the latter need to start paying attention now.
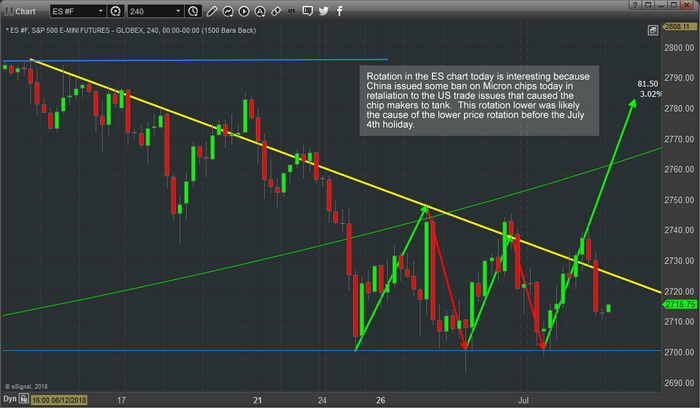
Just before the July 4th holiday, the US equity markets were about to rally above a defined wedge formation that has been defining price range for the past 7+ days. As the markets opened on July 3rd, prices had already started to rally and appeared to be ready to rocket higher by a decent amount. Yet, by early morning, news that China had banned Micron chip sales in a patent case caused the markets to reverse quite steadily. This news, as it relates to US chip manufacturers and a major part of the NASDAQ, creates a temporary speed bump in the perceived rally that we have been expecting for weeks.
The Technology sector makes up a very large component of the US major indexes. Other than the DOW, technology firms are spread across nearly every sector of the US major indexes and this case may have some reach to it. As the trade tariffs and trade issues continue to ramp up, these types of explosive news items can drive the markets up or down as the news hits. We consider these external factors that push the market one way or another while the core market dynamics may want to drive prices in another direction.
Recently we showed a number of research posts indicating our proprietary predictive price modeling systems cycles and price projections that show the core market bias should be to the upside. We believe these news events cause a price pause and an opportunity to take advantage of lower price rotation which moves against the core market dynamics.
This holiday week is certain to see news event drive price rotation as the volume is thin and many people are vacationing or out of town. This means people will not be active in the markets as much and news events can push price in directions and trends that may not normally be as present in price.
This 240-minute chart of the ES shows the pennant/flag formation that we mentioned a few days ago. We believe the support level near 2700 is key to the upside breakout that is likely to happen. This pennant formation has already formed a completed 5 waves and should be pushing higher – although the news from China regarding Micron seemed to create a late price decline. As long as that 2700 level holds, we believe the upside price move is the eventual play in this market.
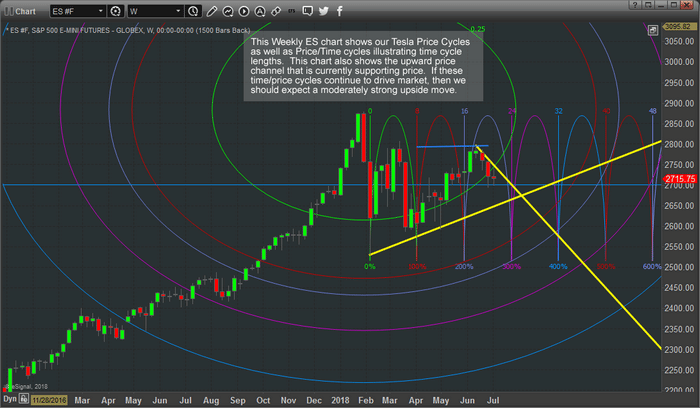
This Weekly ES chart shows a longer-term perspective of the price rotation. One can easily see the recent upside price rally from near 2550 to 2800. The current downside price rotation, from 2800 to near 2700, appears to be aligning with our Tesla Vibrational price cycles and our time/price cycles in the form of a bottom cycle formation near July 15 with an upside price potential rally that could extend 4~7+ weeks. Notice the GREEN vibrational range near the current price and notice the next outer RED range. As we break the GREEN vibrational range, our Tesla theory suggests that price will attempt to move in the easiest direction towards the next vibrational range – the RED level. This would suggest that price may attempt to rally well above 2800 within a trend that could last many months.
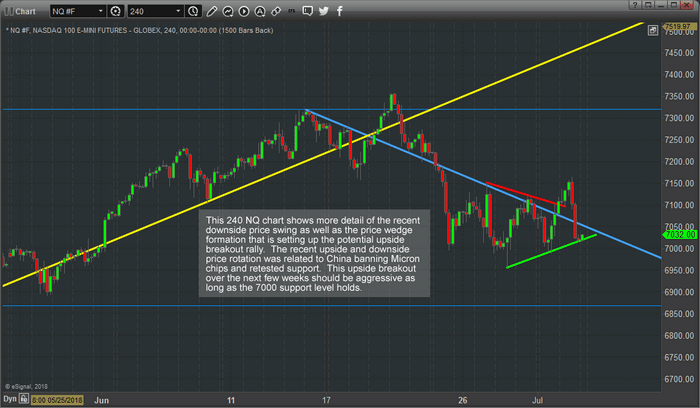
The NQ has reacted quite differently than the ES. This 240 minute NQ chart shows the deeper price rotation recently as well as the pennant formation that has constrained price. Additionally, one can clearly see the upside breakout of this pennant formation recently and the return of price to near-term support (near 7030). This return to support on the China news could indicate a renewed test of support before an upside move. Although we don’t expect the NQ to rally as much as the ES and YM charts, we do still expect to see some upside price moves in the NQ over time. 7200 to 7300 would be our immediate upside targets.
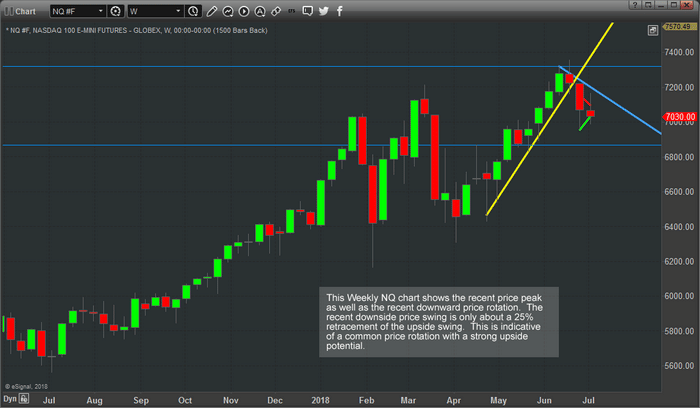
This NQ weekly chart shows just how clean the upside move has been after the February price collapse. While many people were initiating short positions thinking the markets were going to fall further, the rush of capital into the NASDAQ continued to drive capital valuations and appreciation. Now, with Q2 earning right around the corner, we believe the NQ will rally a bit on earning news, yet fail to really push much beyond the 7400 level. We believe the real earnings values will be in small caps, blue chips and the DOW and S&P. We don’t believe we will see blowout earnings numbers from most of tech this time.
A move to near 7400 would be a renewed push to new NQ highs. This would be a very positive move in the markets and would put incredible pressures on the shorts – creating a short squeeze. Far too many people fail to understand that a large amount of foreign capital is trying to avoid devaluation and price depreciation. Investors don’t like to sit on long-term holdings when a currency is devaluing excessively and stock prices (in that currency base) are devaluing as well. It is like a double-whammy of loss for investors that can easily move that capital into something without these risks. Therefore, as long as the emerging markets and foreign markets continue to experience some levels of price contraction, we believe the strong US Dollar and strong US Equity markets will be the “market of choice”. This means a continued “melt up” as global traders rush to find an investment that can avoid the risks of local exchanges/equities.
Please don’t get caught off-guard with regards to this price rotation and what it means to the markets. A massive price expansion pattern is setting up in the US markets that may drive prices much higher all the way through 2019 and possibly further. We believe many of the major analysts have missed this pattern and we have positioned our loyal members to take advantage of this move in the future.
Visit www.TheTechnicalTraders.com to learn how we can help you stay ahead of this market and stay on the right side of price trends. You owe it to yourself to learn how we can deliver superior research and trading signals to help you find profits and better manage your trades.
Our articles, Technical Trading Mastery book, and 3 Hour Trading Video Course are designed for both traders and investors to explore the tools and techniques that discretionary and algorithmic traders need to profit in today’s competitive markets. Created with the serious trader and investor in mind – whether beginner or professional – our approach will put you on the path to win. Understanding market structure, trend identification, cycle analysis, volatility, volume, when and when to trade, position management, and how to put it all together so that you have a winning edge.
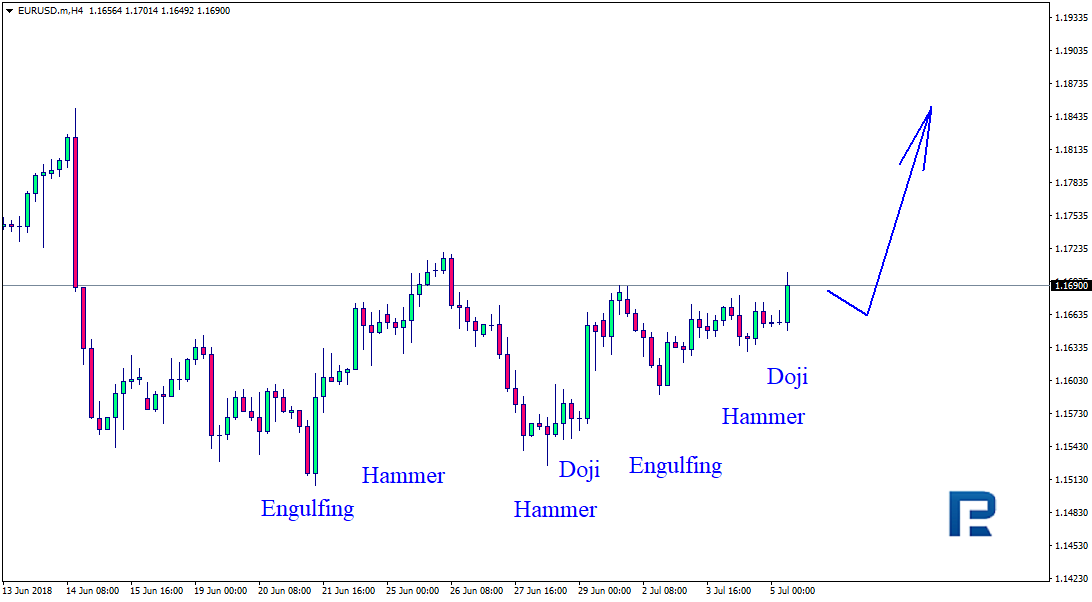
As we can see in the H4 chart, while moving sideways and forming slight pullbacks and Hammer, Engulfing, and Doji reversal patterns, EURUSD has reached the resistance level once again. At the moment, it may be assumed that the above-mentioned patterns indicate that the instrument may break the level and continue its ascending movement.
USDJPY, “US Dollar vs. Japanese Yen”
As we can see in the H4 chart, after completing another slight correction from the resistance level, USDJPY has formed several Harami, Hammer, and Engulfing reversal patterns. Judging by the previous movement, it may be assumed that the correction is over and the instrument may continue trading to the upside.
Attention! Forecasts presented in this section only reflect the author’s private opinion and should not be considered as guidance for trading. RoboForex LP bears no responsibility for trading results based on trading recommendations described in these analytical reviews.
AUDUSD is trading at 0.7377; the instrument is moving inside Ichimoku Cloud, which means that it is moving sideways. The markets could indicate that the price may test the downside border of the cloud at 0.7365 and then resume moving upwards to reach 0.7505. However, the scenario that Implies further growth may be cancelled if the price breaks the downside border of the cloud and fixes below 0.7350. In this case, the pair may continue falling towards 0.7300. After breaking the resistance area and fixing above 0.7420, the price may continue moving upwards.
NZDUSD, “New Zealand Dollar vs US Dollar”
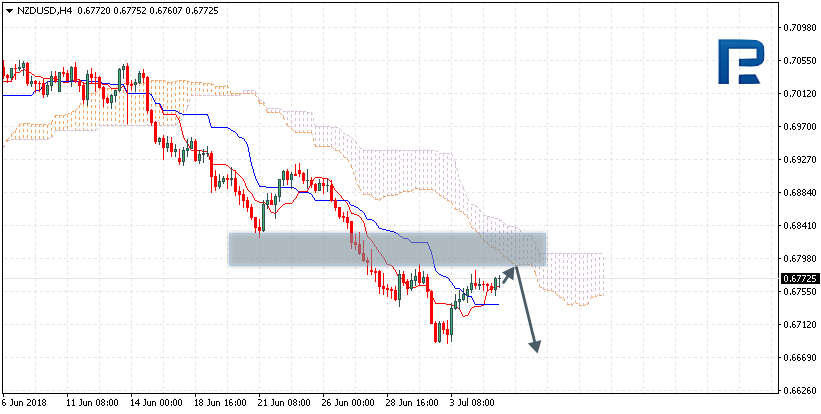
NZDUSD is trading at 0.6772; the instrument is moving below Ichimoku Cloud, which means that it may continue falling. The markets could indicate that the price may test the downside border of the cloud at 0.6785 and then continue moving downwards to reach 0.6670. Another signal to confirm further descending movement is the price’s rebounding from the resistance level. However, the scenario that implies further decline may be cancelled if the price breaks the upside border of the cloud and fixes above 0.6830. In this case, the pair may continue growing towards 0.6950.
USDCAD, “US Dollar vs Canadian Dollar”
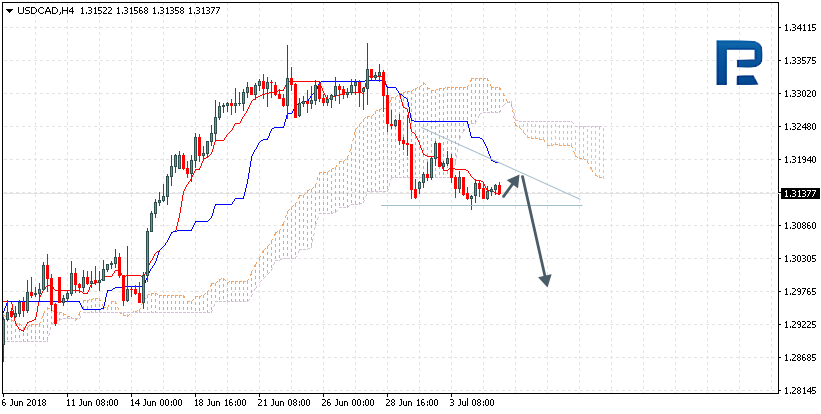
USDCAD is trading at 1.3137; the instrument is moving below Ichimoku Cloud, which means that it may continue falling. The markets could indicate that the price may test Tenkan-Sen and Kijun-Sen at 1.3170 and then continue moving downwards to reach 1.2975. However, the scenario that implies further decline may be cancelled if the price breaks the upside border of the cloud and fixes above 1.3250. In this case, the pair may continue growing towards 1.3350. After breaking the downside border of the Triangle pattern and fixing below 1.3115, the price may continue moving downwards.
Attention! Forecasts presented in this section only reflect the author’s private opinion and should not be considered as guidance for trading. RoboForex LP bears no responsibility for trading results based on trading recommendations described in these analytical reviews.
On Wednesday the 4th of July, trading on the euro closed slightly up. The US had a national holiday, so market activity was pretty low. In the first half of the day, the single currency dropped to 1.1631. In the US session, the rate recovered to 1.1675.
The reason for this growth with such a thin market may have been a Bloomberg report, which said that several members of the ECB’s governing council believe that raising interest rates at the end of 2019 would be too late. The euro jumped 35 pips, which changed the wave structure from what I’d been expecting. Now let’s see what awaits us this Thursday.
Day’s news (GMT+3):
09:00 Germany: factory orders (May).
10:15 Switzerland: CPI (Jun).
13:00 UK: BoE’s Governor Carney speech.
15:15 USA: ADP employment change (Jun).
15:15 Eurozone: ECB’s Mersch speech.
15:30 USA: initial jobless claims (30 Jun).
16:45 USA: Markit services PMI (Jun).
17:00 USA: ISM non-manufacturing index (Jun).
18:00 USA: EIA crude oil stocks change (29 Jun).
21:00 USA: FOMC minutes.
Fig 1. EURUSD hourly chart. Source: TradingView
Current situation:
My expectations for yesterday proved partially correct. The rate dropped below its target level. Today, according to my forecast, the drop should have continued to 1.1600, but the news from Bloomberg has changed market sentiment and nullified this outcome.
It’s also unclear why the euro strengthened across the board in the last hour of the session. The dollar is showing mixed dynamics against the majors. All the euro crosses have moved into positive territory.
There were no statistics released yesterday, so there must have been some kind of statement from ECB representatives or another article was published on the subject of interest rates or QE reversal that cites a source from the ECB.
Buyers have broken the resistance at 1.1676 and are now trying to push towards 1.1720. There’s an intermediate resistance level at 1.1690.
The euro is currently trading at 1.1686. With the situation as it is, I can’t see any signs of a price drop. The indicators also point towards further growth. The crosses will drag the euro up with them until trading gets underway in London.
EURUSD is still consolidating around 1.1645. Possibly, the pair may form another descending structure to reach 1.1698 (an alternative scenario). According to the main scenario, the price is expected to trade downwards to break 1.1575 and then continue falling to reach 1.1464.
GBPUSD, “Great Britain Pound vs US Dollar”
GBPUSD is consolidating around 1.3168. Possibly, today the pair may grow to reach 1.3225. Later, the market may fall to break 1.3090 and then continue trading to the downside with the target at 1.2990.
USDCHF, “US Dollar vs Swiss Franc”
USDCHF is consolidating around 0.9930. Today, the price may fall to reach 0.9898. After that, the instrument may grow to break 0.9990 and then continue trading to the upside with the target at 1.0080.
USDJPY, “US Dollar vs Japanese Yen”
USDJPY has completed the first descending impulse. Possibly, today the pair may grow to reach 110.73and then resume falling with the target at 109.60.
AUDUSD, “Australian Dollar vs US Dollar”
AUDUSD has finished the first ascending structure at 0.7420. Today, the price may be corrected towards 0.7360, thus forming a new consolidation range. If later the instrument breaks this range to the upside, the market may continue trading upwards to reach 0.7500; if to the downside – resume falling inside the downtrend with the target at 0.7285.
USDRUB, “US Dollar vs Russian Ruble”
USDRUB is consolidating around 63.00. Possibly, the pair may fall to break 62.08 and then continue trading downwards with the short-term target at 60.70.
XAUUSD, “Gold vs US Dollar”
Gold has completed the first ascending impulse at 1260.00. Today, the price may start another correction towards 1248.00 and then form a new ascending structure to return to 1260.00 and break it. The short-term target at 1270.00.
BRENT
Brent is moving upwards. Possibly, the pair may reach 80.70 and then fall to return to 78.50. Later, the market may continue trading upwards to reach 82.00.
Attention! Forecasts presented in this section only reflect the author’s private opinion and should not be considered as guidance for trading. RoboForex LP bears no responsibility for trading results based on trading recommendations described in these analytical reviews.