Author Archive for InvestMacro – Page 395

China, Asia and Emerging Markets Could Result in Chaos

By TheTechnicalTraders.com

Recently, quite a bit of news has been originating from Malaysia, China and other areas of South East Asia.  Much of it is concerns with multi-billion dollar projects and excessive corruption and graft.  Malaysia is taking the lead with this issue so far with the new Mahathir administration.  Yet, we believe these issues are far-reaching and could result in quite a bit of market turmoil over the next few months – possibly much longer.

What is at risk is the exposure of “cooked books” across much of China, India and likely throughout the globe with infrastructure and real estate projects that were designed to boost numbers while hiding real economic concerns.  You may remember we alerted our members and the general public to this concern in March 2018 – nearly 4 months ago in this blog post.  If you have not read our multi-part research post regarding how China has set itself up for a massive economic collapse, please take a minute to read all of our earlier research.

How has this Ponzi scheme been setup to play out for so long?  Our assumption is that it goes something like this.  In late 2009/early 2010, China was feeling the crunch of the global credit market crisis and made an attempt to push easy credit out to internal and external infrastructure projects in an attempt to keep the manufacturing and export sectors in China clicking right along.  The objective was to keep building, while the capability was available and the supply was plentiful. The only thing China needed to do was to make it easy for capital (loans) to be acquired for builders and buyers.

Much like what happened throughout most of the world, China took advantage of an already steady economy to avoid any contraction in real economic output by creating capital out of thin air and allowing their banking institutions to loan capital for massive projects.  This fueled a huge wave of investment and speculation throughout most of Asia – including external projects like those in Malaysia, Africa, India and many other countries.  What we are learning, though, is that the projects may have been much more nefarious than we originally thought.

For example, the 1MDB investigation in Malaysia has shown that graft, corruption, nepotism and a host of other issues are raising many questions as to how and where multiple hundreds of billions of dollars vanished?  It appears one component of the 1MDB and other project were a commitment for the infrastructure project materials to be purchased from Chinese manufacturers and the payment schedule for said materials were set to be transmitted well before these materials were actually delivered.  In other words, China made a capital commitment to loan a portion of capital for an international project with the commitment being to purchase materials from Chinese manufacturers where the host country would also have a capital repayment agreement as their joint partnership in this project.  The problem was that China never really delivered on the materials and the host country, in some cases, has already paid for 80%+ of the project costs.  This is a classic “I’ll gladly pay you in advance for materials and work that I may never EVER see”.

In terms of how this type of deal cooks the books, think of it like this.  China just “booked” a $400 billion project where China must contribute 10~15% of the capital costs and the host country contributes the rest.  This results in a “sale” of $400 billion on the books with additional sales going out to manufacturers and suppliers.  As the host country begins payments for this project, China can quickly recover actual costs because they have not delivered much in terms of raw materials or actual building materials for this project.  Meanwhile they are bilking the host country out of hundreds of millions or billions on a “phantom project” that may never be completed.

It all seems to work well for the books because as long as no one actually finds out what is happening, China is selling “vapor projects” to other nations and booking profits for simply making a commitment – a shell game with billions, possibly trillions, at risk.

At the end of the day, China shows multiple massive infrastructure projects and this boosts their GDP, employment, and manufacturing data while covering the raw material and labor costs by sucking real revenues from host nations.  As long as the host nation does not lose faith in the deal or ask too many questions, no one is the wiser and China can keep playing their shell game.

We believe all of this started to change in early 2018 when the Chinese consumer sentiment started to change and when President Trump began to disrupt the “global think” in terms of trade, multi-national deals, and future economic expectations.  As soon as the curtain was pulled back and questions started being asked, China came under real pressure as consumers, nations, and corporations began to question the ongoing financial and economic capabilities of China suspecting that it had over-extended itself, it’s credit capacity and cooked the books with phantom projects, income, and economic output.  The real threat comes when the shadow banking system in China collapses as well as the investment grade debt, corporate debt, and project liabilities become too great for collapsing revenue.  This is when the collapse will accelerate beyond anyone’s imagination.

Right now, we believe we are in the early stages of a discovery process that could roil the markets a bit over the next 2~6+ months.  Once consumers in China get an idea of what is actually transpiring (if they ever really find out), they will move into protection mode and prices will decline in a massive asset bubble collapse.  Global debt issues will likely be resolved by the legal systems in place in various countries and a series of defaults will likely take place.  When one of my partners was doing business in SE Asia, he quickly learned that most Chinese businessmen keep three sets of books; one for partners – showing a big loss, one for the government – showing enough of a loss to not pay too much in taxes, and the last (real) set of books that shows the real profit or loss.

We believe the fallout from all of this could drop the Chinese economic credibility to new lows and could result in a massive wave of legal and financial woes as the Chinese credit, banking, manufacturing and asset markets collapse because of this.  It will start small with the Chinese government trying to inject billions into the economy to shore up failing enterprises and banks.  But once the total scope of this shell game is exposed, we believe it could disrupt nearly all of the Asian and partner nations economies and could land many foreign and domestic state and business officials behind bars or worse.  This is the kind of thing the ends very badly for some people.

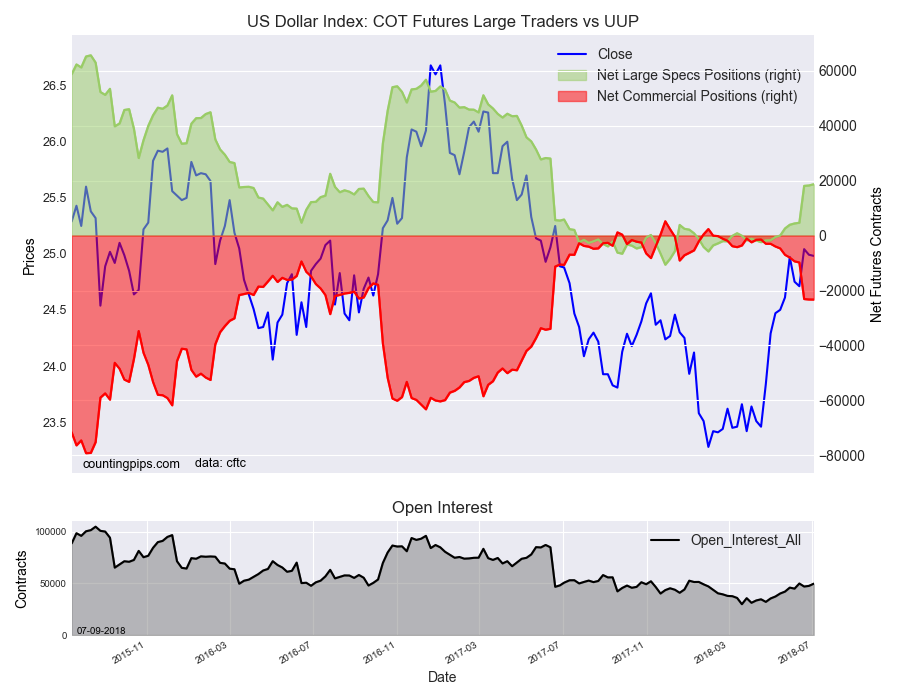
We have been paying very close attention to the unfolding events in China and SE Asia.  We believe, for now, the US Equities markets seem immune to most of this, yet we believe we will soon start to see some credit issues spill over as trade issues and corporate liability repayments may soon begin to falter.  Be prepared for an unknown or unforeseen event to unfold very quickly over the next 6+ months.  We are not suggesting that investors or traders prepare for an immediate collapse in the global markets, but we are suggesting that the Chinese Dragon economy could very quickly unravel into a Chinese Gecko with little to really support pricing and valuations.

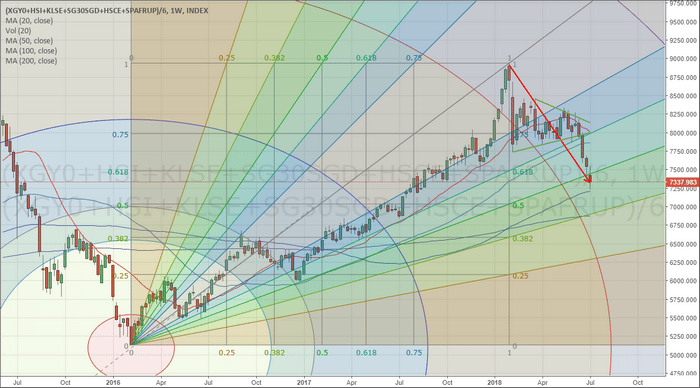
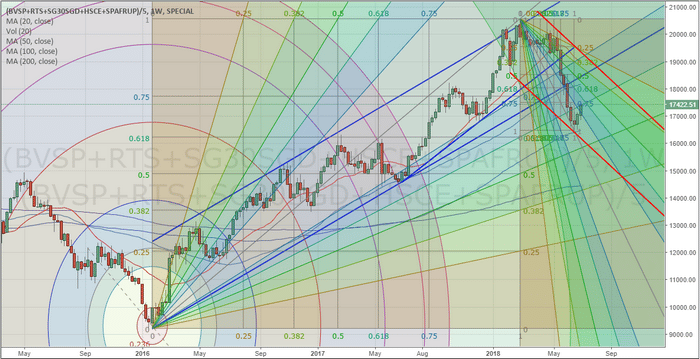
Our Custom China/Asia index has already retraced more than 38.2% from a recent price peak.  As of right now, we are not calling this a collapse because we have yet to cross critical price levels to the downside.  A move below the 50% retracement level, for us, would raise some additional concerns.


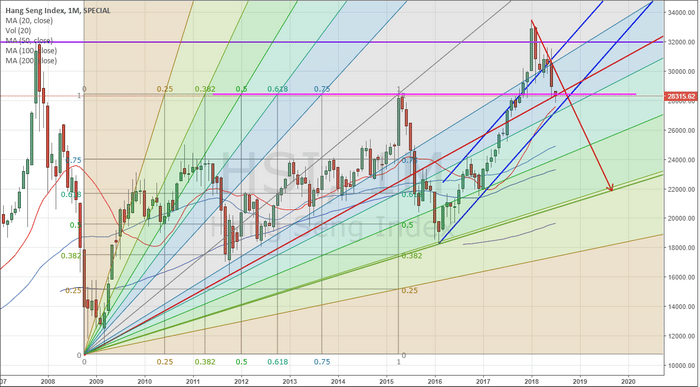
The Hang Seng Index has recently rotated above long-term resistance and collapsed back to the 2015 peak (support).  You can see from our BLUE price trend channel that support could still hold near these lows, possibly prompting a further upside rally.  Yet, we are watching these support/price channel levels because any break of the MAGENTA support line in conjunction with a breach of the price channel would be an ominous technical trigger that bottom has fallen out of the Chinese equity market – and possibly resulting in a massive asset valuation crisis.


Lastly, our BRICs custom index chart is showing a much deeper price correction that has already established a new downside price channel (in RED).  This is one of the bigger concerns that we have in regards to this Chinese debt/liability fallout.  China may be able to absorb some, or most, of the crisis by nationalizing companies and increasing capital through central bank activities.  But what happens to the other foreign nations that are left holding the empty bag of these failed infrastructure projects?  They could be out hundreds of billions with nothing to show for it except a “Chinese IOU”.  This Chinese shell game to “cook the books” could result in a global crisis involving some of the weakest and most vulnerable nations on the planet.  Yes, the BRICs emerging markets could be taking a wild ride in the near future if the fallout from all of this extends as we believe it could.


Our opinions at this point is that China is in a very fragile position; protect itself from complete disgrace and economic collapse by going “all-in” with central bank and currency manipulation while delaying or canceling projects in an attempt to gain control of this mess; or orchestrate a planned and organized economic crisis event that exposes the shenanigans that have been ongoing for a decade or more while attempting to “save face” and maintain some level of credibility throughout the world.  Remember, one of the most important aspects of the Chinese culture is “Asian face”. The term implies that one never disrespect or disgrace a leader or person of power.  It is, in some ways, the most disgusting and horrid thing that can happen to anyone – to lose honor and respect in front of one’s peers.

China is stuck between the proverbial “rock and a hard place”.  The only option they have at the moment is the “controlled/planned economic crisis event” (to the best of their abilities) while praying that nothing massive hits the news wires which could cause further damage to their fragile footing.  If something (think Malaysia/Mahathir and neighboring countries) does hit the news wires to further erode China’s plans – it could result in an all-out collapse of the Chinese economy.  Something that has really not been seen in well over 500 years (prior to the Qing Dynasty: 1644-1912).

We are advising our clients with regards to this unfolding event and continue to dedicate a large number of resources toward protecting our clients from unexpected and unknown issues.  We have developed a unique set of trade positions that we believe assist our clients in executing successful future trading strategies as well as executing a protected style of trading based on our research and objective analysis.  Our job is to deliver success for our clients and to keep them aware of the market turns and risks as we find and execute successful trades.

Visit www.TheTechnicalTraders.com to learn how we can help you create success, stay ahead of these market moves and deliver greater success for you as these incredible opportunities unfold over the next 6~24+ months.

By TheTechnicalTraders.com

COT Report: 10-YR bearish bets set Record. USD Index, Crude, Gold & SPMini bets rise

By CountingPips.com – Receive our weekly COT Reports by Email

Here is a short summary and this week’s links (below) to the latest Commitment of Traders changes that was released on Monday (delayed due to last week’s holiday).


Currency Speculators raised US Dollar Index, Peso bets. Cut CAD, GBP, NZD bets

Last week’s data showed 5 out of 8 major currency levels are bearish

The latest data for the weekly Commitment of Traders (COT) report, released by the Commodity Futures Trading Commission (CFTC) on Monday due to the 4th of July holiday, showed that large traders and currency speculators raised their bets again for the US dollar index this week while sharply betting against the Canadian dollar and the New Zealand dollar. See full article


WTI Crude Oil Speculators lifted their bullish net positions for 2nd week

The non-commercial contracts of WTI crude futures totaled a net position of 656,720 contracts, according to data from this week. This was a lift of 31,629 contracts from the previous weekly total. See full article


Gold Speculators slightly advanced their bullish bets after 2 down weeks

The large speculator contracts of gold futures totaled a net position of 78,327 contracts. This was a weekly advance of 1,655 contracts from the previous week. See full article


10-Year Note Speculators raised bearish bets to new record level

The large speculator contracts of 10-year treasury note futures totaled a net position of -500,076 contracts. This was a weekly reduction of -144,752 contracts from the previous week. See full article


S&P500 Mini Speculators reduced bullish bets for 1st time in 5 weeks

Large stock market speculators cut back on their bullish net positions in the S&P500 Mini futures markets last week. See full article


Silver Speculators decreased bullish net positions again this week

The non-commercial contracts of silver futures totaled a net position of 24,682 contracts, according to data from this week. This was a weekly fall of -9,539 contracts from the previous totals. See full article


Copper Speculators cut back on their bullish net positions for 3rd week

The large speculator contracts of copper futures totaled a net position of 25,505 contracts. This was a weekly shortfall of -8,540 contracts from the data of the previous week. See full article


Article by CountingPips.com – Receive our weekly COT Reports by Email

The Commitment of Traders report data is published in raw form every Friday by the Commodity Futures Trading Commission (CFTC) and shows the futures positions of market participants as of the previous Tuesday (data is reported 3 days behind).

To learn more about this data please visit the CFTC website at http://www.cftc.gov/MarketReports/CommitmentsofTraders/index.htm

Currency Speculators raised US Dollar Index, Peso bets. Cut CAD, GBP, NZD bets

By CountingPips.comGet our weekly COT Reports by Email

Last week’s data showed 5 out of 8 major currency levels are bearish

The latest data for the weekly Commitment of Traders (COT) report, released by the Commodity Futures Trading Commission (CFTC) on Monday due to the 4th of July holiday, showed that large traders and currency speculators raised their bets again for the US dollar index this week while sharply betting against the Canadian dollar and the New Zealand dollar.

Non-commercial large futures traders, including hedge funds and large speculators, bet in favor of the US dollar index (446 weekly change in contracts), the euro (2,843 contracts), Australian dollar (1,748 contracts) and the Mexican peso (18,425 contracts), according to the data reported through Tuesday July 3rd.

On the flip side, the currencies whose speculative bets declined last week were the British pound sterling (-7,200 contracts), Japanese yen (-4,509 contracts), Swiss franc (-2,463 contracts), Canadian dollar (-16,649 contracts) and the New Zealand dollar (-8,842 contracts).

Speculators continued to raise bets for the US dollar index last week as the spec position has now improved for eleven straight weeks to the highest bullish level since June 13th 2017 when the net positions totaled 28,025 contracts.

Elsewhere, we saw had substantial changes (+ or – 10,000 contracts) in the individual currency contract levels for the speculators category.

  • Canadian dollar contracts decreased by at least -16,000 contracts for a second straight week as the current position is in its 15th straight week of bearish spec positioning. The current loonie speculator sentiment is now at the most bearish level since June 27th of 2017 when the net position totaled -49,495 contracts.
  • Mexican peso positions jumped by over +18,000 contracts last week after seeing declines in ten out of the previous eleven weeks heading up to recent election. The latest gains in spec positions brings the overall standing back into a small bullish level after a fall into bearish territory for the previous four weeks.

Other Notables:

  • Euro positions saw a small rebound in the latest data after bets had dropped for ten consecutive weeks
  • British pound bets fell for the third straight week and are now in bearish territory for a third straight week. The current bearish level is the highest since September 2017
  • Japanese yen and Swiss franc positions each had rising bearish positions last week. The yen is at the most bearish since March 13th while the franc is at the most bearish standing since the end of May
  • Australian dollar bets have improved for two straight weeks although the Aussie has been in bearish territory now for fourteen consecutive weeks
  • New Zealand dollar bearish bets increased for the third straight week pushing the net position further into bearish territory. The current level is at the most bearish we can find in our records dating back to 1999


Table of Weekly Commercial Traders and Speculators Levels & Changes:

CurrencyNet CommercialsComms Weekly ChgNet SpeculatorsSpecs Weekly Chg
EuroFx-47,939-6,09936,7472,843
GBP49,63213,085-28,781-7,200
JPY55,6998,687-38,730-4,509
CHF61,8911,362-40,494-2,463
CAD58,15117,242-49,448-16,649
AUD62,546-212-39,2301,748
NZD30,3428,288-26,404-8,842
MXN-2,730-18,9145,91518,425


This latest COT data is through Tuesday and shows a quick view of how large speculators or non-commercials (for-profit traders) as well as the commercial traders (hedgers & traders for business purposes) were positioned in the futures markets. All currency positions are in direct relation to the US dollar where, for example, a bet for the euro is a bet that the euro will rise versus the dollar while a bet against the euro will be a bet that the dollar will gain versus the euro.


Weekly Charts: Large Trader Weekly Positions vs Price

EuroFX:


British Pound Sterling:


Japanese Yen:


Swiss Franc:


Canadian Dollar:


Australian Dollar:


New Zealand Dollar:


Mexican Peso:

*COT Report: The weekly commitment of traders report summarizes the total trader positions for open contracts in the futures trading markets. The CFTC categorizes trader positions according to commercial hedgers (traders who use futures contracts for hedging as part of the business), non-commercials (large traders who speculate to realize trading profits) and nonreportable traders (usually small traders/speculators). Find CFTC criteria here: (http://www.cftc.gov/MarketReports/CommitmentsofTraders/ExplanatoryNotes/index.htm).

The Commitment of Traders report is published every Friday by the Commodity Futures Trading Commission (CFTC) and shows futures positions data that was reported as of the previous Tuesday (3 days behind).

Each currency contract is a quote for that currency directly against the U.S. dollar, a net short amount of contracts means that more speculators are betting that currency to fall against the dollar and a net long position expect that currency to rise versus the dollar.

(The charts overlay the forex closing price of each Tuesday when COT trader positions are reported for each corresponding spot currency pair.) See more information and explanation on the weekly COT report from the CFTC website.

Article by CountingPips.com

Ichimoku Cloud Analysis 09.07.2018 (AUDUSD, NZDUSD, USDCAD)

Article By RoboForex.com

AUDUSD, “Australian Dollar vs US Dollar”

AUDUSD is trading at 0.7467; the instrument is moving above Ichimoku Cloud, which means that it may continue growing. The markets could indicate that the price may test Tenkan-Sen and Kijun-Sen at 0.7435 and then resume moving upwards to reach 0.7500. . Another signal to confirm further ascending movement is the price’s rebounding from the support level. However, the scenario that Implies further growth may be cancelled if the price breaks the downside border of the cloud and fixes below 0.7350. In this case, the pair may continue falling towards 0.7270.

AUDUSD
Risk Warning: the result of previous trading operations do not guarantee the same results in the future


NZDUSD, “New Zealand Dollar vs US Dollar”

NZDUSD is trading at 0.6847; the instrument is moving above Ichimoku Cloud, which means that it may continue growing. The markets could indicate that the price may test Tenkan-Sen and Kijun-Sen at 0.6825 and then continue moving upwards to reach 0.6960. Another signal to confirm further ascending movement is the price’s rebounding from the support level. However, the scenario that implies further growth may be cancelled if the price breaks the downside border of the cloud and fixes below 0.6730. In this case, the pair may continue falling towards 0.6670.

NZDUSD
Risk Warning: the result of previous trading operations do not guarantee the same results in the future


USDCAD, “US Dollar vs Canadian Dollar”

USDCAD is trading at 1.3071; the instrument is moving below Ichimoku Cloud, which means that it may continue falling. The markets could indicate that the price may test Tenkan-Sen and Kijun-Sen at 1.3115 and then continue moving downwards to reach 1.2965. Another signal to confirm further descending movement is the price’s rebounding from the resistance level. However, the scenario that implies further decline may be cancelled if the price breaks the upside border of the cloud and fixes above 1.3245. In this case, the pair may continue growing towards 1.3350.

USDCAD
Risk Warning: the result of previous trading operations do not guarantee the same results in the future

Article By RoboForex.com

Attention!
Forecasts presented in this section only reflect the author’s private opinion and should not be considered as guidance for trading. RoboForex LP bears no responsibility for trading results based on trading recommendations described in these analytical reviews.

Forex Technical Analysis & Forecast 09.07.2018 (EURUSD, GBPUSD, USDCHF, USDJPY, AUDUSD, USDRUB, GOLD, BRENT)

Article By RoboForex.com

EURUSD, “Euro vs US Dollar”

EURUSD has broken 1.1675 upwards and may continue the correction to reach 1.1818. After that, the instrument may form a new ascending structure towards 1.1855.

EURUSD
Risk Warning: the result of previous trading operations do not guarantee the same results in the future


GBPUSD, “Great Britain Pound vs US Dollar”

GBPUSD has broken 1.3220 upwards and may continue the correction with the short-term target at 1.3333. Later, the market may trade to the downside to reach 1.3212 and then form a new ascending structure towards 1.3375.

GBPUSD
Risk Warning: the result of previous trading operations do not guarantee the same results in the future


USDCHF, “US Dollar vs Swiss Franc”

USDCHF is still being corrected. Possibly, today the pair may fall with the short-term target at 0.9872. After that, the instrument may grow towards 0.9918 and then continue trading to the downside to reach 0.9850.

USDCHF
Risk Warning: the result of previous trading operations do not guarantee the same results in the future


USDJPY, “US Dollar vs Japanese Yen”

USDJPY is falling towards 110.23. Later, the market may form another ascending structure with the target at 110.70 and then continue trading downwards to reach 109.58.

USDJPY
Risk Warning: the result of previous trading operations do not guarantee the same results in the future


AUDUSD, “Australian Dollar vs US Dollar”

AUDUSD has broken 0.7414 upwards and may continue the correction with the short-term target at 0.7470. After that, the instrument may fall to return to 0.7414 and then resume trading to the upside to reach 0.7520.

AUDUSD
Risk Warning: the result of previous trading operations do not guarantee the same results in the future


USDRUB, “US Dollar vs Russian Ruble”

USDRUB is consolidating around 63.00. Possibly, the pair may fall to break 62.08 and then continue trading downwards with the short-term target at 60.70.

USDRUB
Risk Warning: the result of previous trading operations do not guarantee the same results in the future


XAUUSD, “Gold vs US Dollar”

Gold is consolidating near the top. According to the main scenario, the instrument may be corrected downwards to reach 1249.00 and then form a new ascending structure with the short-term target at 1267.00. Later, the market may fall towards 1258.00 and then resume growing to reach 1279.00.

GOLD
Risk Warning: the result of previous trading operations do not guarantee the same results in the future


BRENT

Brent is consolidating above 77.70. Today, the price may fall to reach 76.90 and then continue trading upwards with the short-term target at 80.80.

BRENT
Risk Warning: the result of previous trading operations do not guarantee the same results in the future

Article By RoboForex.com

Attention!
Forecasts presented in this section only reflect the author’s private opinion and should not be considered as guidance for trading. RoboForex LP bears no responsibility for trading results based on trading recommendations described in these analytical reviews.

EURUSD: Monday vs Friday

By Gabriel Ojimadu, Alpari

Previous:

On Friday the 6th of July, trading on the euro closed up. The euro strengthened against the dollar, undergoing two surges in the session. The beginning of the European session saw the euro jump to 1.1727, and 1.1768 in the American session.

The dollar was put under pressure following the publication of fresh US economic data, which turned out to be quite good. The dollar’s positions were shaken due to rising unemployment and a decline in the average wage index. The latter is a signal of weakening of inflationary pressure, which could cause the Fed to take a break from implementing further rate hikes.

The US saw 213k new jobs in June (forecast: 200k). The data for April was revised from 159k to 175k, and from 223k to 244k for May. The overall revision amounted to +39k.

US unemployment in June rose to 4.0% (forecast: 3.8%, previous: 3.8%).

US average hourly earnings index in June stood at 0.2% (forecast: 0.3%, previous: 0.3%).

Day’s news (GMT+3)

  • 09:00 Germany: trade balance.
  • 10:50 UK: MPC member Broadbent speech.
  • 11:30 Eurozone: Sentix investor confidence.
  • 16:00 Eurozone: ECB President Draghi’s speech.
  • 18:00 Eurozone: ECB President Draghi’s speech.
  • 22:00 US: consumer credit change (May).

Fig 1. EURUSD hourly chart. Source: TradingView

Current situation:

At the time of writing, the euro is at 1.1769, with most euro crosses trading in positive territory, while the dollar remains in the negative.

In Friday’s review I wrote that buyers were preparing to storm the 1.1720-1.1730 zone to open the way to 1.1835. They achieved their goal, but on Monday I expect a correction to the lb balance line (sma 55). A bearish divergence has formed between the price and the AO. The stochastic oscillator is in the sell zone. Since the euro has strengthened after the payrolls report, today the reverse “Monday vs. Friday” may work. In 6 minutes the hourly candle may close  the pin bar, sending a bearish signal.

The 45th degree is located at 1.1715 and there is a trend line going through 1.1711; both of which will be acting as supports today.

I won’t be taking note of Draghi’s speech, which will have a strong influence on the market only after the ECB meeting. He will give two speeches today; one at 16:00 and another at 18:00 (GMT+3).

How to Protect Your Company’s Data in Today’s World?

By Amram Margalit – Leverate

When the news broke that Edward Snowden, a contractor, had stolen and leaked NSA classified files, it is unlikely that the business world considered the threat that employees represent to their data. Businesses have long focused on protecting themselves from outsiders, competitors, hackers and the like. Businesses understand that there are myriad ways that their data can be breached, exposed or corrupted. They also understand that the parties most interested in their data is their competition. As a result, the focus of data protection is to protect it from external threats.

However, a new report from Boscom research is turning this thinking on its head. The report states that a staggering 85 percent of employees have taken company information and even documents when leaving a company. If Edward Snowden was a shot across the bow, this report was a direct hit. This not only provides the insight into the intention of employees, but worryingly exposes how easy it is for employees to steal a company’s data.

It is understandable that companies have trouble protecting their data from employees. Generally speaking, a company’s efficiency depends on the access their employees have to their data. At first glance, there is seemingly no way to restrict access to data without impeding business function. Most businesses when confronted with this issue have surely thrown up their hands and said that the problem is unsolvable.

But this thinking is actually not the case, certainly not for electronic data. There is no doubt that business processes, activities, and often “know-how” can and must be shared, and even some sensitive business strategies needs to be shared to undertake functioning. However, these aspects don’t always represent a large part of most businesses’ critical data.

To elaborate, let’s use the example of a brokerage. A brokerage has several layers of employees, each with different roles, responsibilities and data needs. Sales agents will require personal information and contact details of leads to perform their roles, as well as details of the current promotion. Affiliates, who perform a somewhat similar role, will need access to some of the same data, but not necessarily the same type of data. Marketing will require different data, as will Management. The picture that this paints is that the method of accessing data and the amount of data that is needed clearly varies between roles. Understanding this is a key starting point – recognizing that there is a method of controlling data flow that will both protect your data without impacting productivity. Data access should be limited in each role to “need to know” levels of information.

To be able to control data, your data needs to be stored in software that is able to recognize users and provide access control. Most CRM software has this capability. Because of privacy restrictions, many industries will be required to utilize some sort of data protection to protect customers from leaked data, meaning that most businesses will have this element in place already.

Encryption of data is another method of protecting and controlling access to client data. Nowadays, it is easy to steal data by taking a simple screenshot and sending the copy via email. If, however, the data is encrypted, there is no value in copying the data. What about a role where there is a need to contact a client, like a sales role? It is possible to allow the sales agent to directly contact a client without providing the contact details, by using auto dialing applications or VoIP (like skype).

These practical examples are only likely to be effective within the framework of a more integrated policy on data control. Management must implement a policy which addresses the specific areas that should be controlled. Putting this in writing and sharing the policy with employees is the crucial first step in allowing everyone to be on the same page. It is imperative to set clear and practical rules such as details of what can and cannot be attached to a document via email, restrictions on copying files to a USB, how to handle personal emails and the like.

Once this policy is in place, the accesses and restrictions should be integrated into the system and a means of tracking improper use put in place. Most software tools enable to create notifications of improper access, etc. In addition, certain protections should be put in place to make it challenging to remove data. Examples include storing data on Windows networks on NTFS formatted drives, providing read-only access restrictions and preventing employees from installing USB devices.

With proper preparation and the right structure in place, employee theft of data can be curtailed without hampering productivity. This will allow the business to protect itself from myriad data breaches, while keeping the trust between employees and employers in place.

About the Author:

Amram Margalit is a professional writer who has worked in a wide range of settings, including technology companies, nonprofits, and the entertainment industry. Within these positions, Amram has provided quality content and advertising services and is currently the Content Manager at Leverate.


Crude Oil possibly setting up for a big downside move

By TheTechnicalTraders.com

Our research team has identified a potential major price rotation setup in Crude Oil that may be one of the biggest opportunities for traders in a long while.  Traders need to be aware of this potential move because it could coincide with other news related to foreign markets/economies as well as supply/demand issues throughout the rest of this year.

Demand for Oil is tied to the economic activities throughout much of the globe.  When demand for Oil is high, one can perceive the global economy to be performing well and consumer demand for oil-based products rather high.  When demand for oil subsidies, it is usually due to economic constraints as a result of slower consumer and industrial demand.  The only time demand for oil typically skyrockets are when massive supply disruption takes place or war breaks out.

Current price rotation to the upside has reached and stalled near an upper price channel and coincides with our Tesla Vibrational Theory price arcs.  We believe this could be setting up for a big downside price move in the near future.  Our interpretation of this setup is that Oil will quickly find pricing pressures near the $74-$75 level and begin to move lower.

Before we continue much further, let’s take a look at some statistical data for the Month of July with Crude Oil.

Over 36 total months of scanned data (data going all the way back to 1983) we can determine the following :

**  All data related only to the month of July  **

Total price activity over those 36 total months:-$5.28

Total Monthly Positive Results = $49.78 spanning 24 total months – Averaging $2.07

Total Monthly Negative Results = -$55.06 spanning 12 total months – Averaging -$4.59

Largest Positive Month = +$8.47

Largest Negative Month = -$15.92

This data tells us that July is more often resulting in a positive price move (by a 2:1 ratio), yet the upside totals do not out perform the downside moves.  The downside price moves for July total nearly 10% more than the total upside price moves and equates to exactly half the number of instances (12 vs. 24).

This data suggests to us that any potential downside move in Crude could be well in excess of -$4.00 and could be as large as -$10.00 or more.  If our analysis is correct that Crude could rotate much lower based on our price channels and Tesla theory setup, we could be in for a move to below $64.00 ppb here soon if price confirms a breakdown on a close below $72.

This Daily Crude Oil chart shows the wedge formation and our Tesla price vibrational arcs that we believe are set up for a potential downside price rotation move.  Obviously, we can see that Oil has rotated within this channel at least twice before – which is why we believe this current downside rotation could have a high probability of happening.  Additionally, our predictive modeling system is suggesting price weakness this week in Crude Oil.


This Weekly Crude Oil Chart below shows the same pattern over a longer span of time.  Our belief that the $64.00 support level (shown as a horizontal CYAN support line) will be retested over the next 2~5+ weeks if this projected price rotation plays out could mean that if the $64.00 level is breached, we could see Oil fall to well below $60.00 ppb headed into the end of this year.

Consider this fact of data for a minute as we consider this possible price rotation.  Since 1983, using quarterly price data, the Q4 historical data show us the following:

Total Q4 Price Move: -$80.71 over 36 Q4 data points

Total Positive Q4 Data: +$85.87 over 14 data points – Averaging +$6.13

Total Negative Q4 Data: -$116.58 over 21 data points – Averaging -$7.93

Largest Q4 upside move: +$19.63

Largest Q4 downside move: -$56.04

Downside price action in Crude Oil is nearly 33% more predictable than upside price action in Q4 with the largest price changes reflecting almost +300% greater chance of downside price collapse than upside price rally.

We may be a bit early with our prediction near this upper price channel, but we believe this could be a super trade going into the end of this year.  We just have to wait for the move to accelerate and begin to rotate lower.

Have you been following our analysis recently?  Did you catch the upside price move in the US equities markets like we have been predicting for the past few months?  How about the moves in the metals markets – did you catch those too?  Want to learn how a small and very dedicated team of researchers and traders can assist you in developing greater success for your trading and help you stay ahead of these market moves?

Then visit www.TheTechnicalTraders.com to learn how we can help.  Our members receive proprietary research, daily video content, detailed trading signals and much more to assist them in finding great trading opportunities and staying ahead of these crazy market moves.  Join the Wealth Building Trading Newsletter today to learn how we can help you become more successful.

By TheTechnicalTraders.com


How Trade Wars Penalize Asian Currencies

By Dan Steinbock

Not so long ago, Asian currencies anticipated depreciation pressures to increase, due to monetary normalization. Yet, it is the trade wars that are now penalizing all currencies, particularly in exporting economies.

In January, I gave a global economic briefing on the outlook of the Philippines in the Nordic Chamber of Commerce in Manila. At the time, the peso was still about 50.80 to U.S. dollar. Among other things, I projected the peso to soften to 54 or more toward the end of the year, which I considered largely the net effect of normalization in advanced economies, elevated trade friction worldwide, as well as fiscal expansion (the Duterte investment program).

While skeptics thought the projection was too “pessimistic,” the peso is today around 53.40 to U.S. dollar and has occasionally almost exceeded 54.00.

In this view, depreciation pressures are typical to many currencies in emerging Asia, most of which are likely to continue to soften in 2019, including the peso.

The onset of trade wars

Through his 2016 campaign, Donald Trump pledged tougher trade policies. When he arrived in the White House in January 2017, he buried the Transpacific Partnership (TPP), initiated talks about the future of the North American Free Trade Agreement (NAFTA), suspended the US-EU free trade talks (TTIP) and intensified attacks against Chinese trade and investment.

In the global markets, these moves translated to occasional fluctuations, while increasing uncertainty about the global economic outlook.

Initially, the US-Chinese Summit in April 2017 seemed to offer some trade relief. Nevertheless, things changed quickly as Trump directed his administration to take a closer look first at Chinese steel and aluminum and later at intellectual property rights and the technology sector – particularly vis-à-vis national security.

With the most hawkish administration since the Reagan rearmament era, these directives resulted in the kind of reports that were only to be expected in early 2018, when the Trump administration began a steady escalation of the US-Chinese trade war, starting in March. Last week, the White House made the “largest trade war in history” official, while starting to escalate trade friction with Europe.

Unsurprisingly, almost all Asian currencies are now taking hits not just from expected directions (rate hikes by the U.S. Federal Reserve, the anticipated end of the European Central Bank’s quantitative easing), but also from more less-expected directions (U.S.-Chinese trade war, the nascent U.S.-EU trade war, and escalating rhetoric among the NAFTA partners; U.S., Canada and Mexico).

Impact on Asian currencies

In Asia, the net effect has been as projected half a year ago. Among high-income economies, export-led currencies – Korean won (KRW, -5.1%), Taiwanese dollar (TWD, -2.7%) and Singaporean dollar (SGD, -2.3%) – have weakened relatively most against the U.S. dollar.

The same goes for the currencies of upper-middle income economies, including Chinese yuan (CNY, -1.5%) and Thai baht (, THB, -1.4%), respectively.

Among lower-middle income economies, it is those currencies that represent the relatively fastest-growing countries – Indian rupee (INR, -7.5%), Philippines peso (PHP, -7.4%) and Indonesian rupiah (IDR, -5.0%) – that have weakened relatively most against the U.S. dollar. Since these currencies also represent twin-deficit economies, they will remain relatively vulnerable in adverse scenarios (Figure).

Figure Asian Currencies: 2018 Year-To-Date Percent Change

Nevertheless, these twin deficits should not be compared with that of, say, the U.S. Unlike advanced economies that take more debt to sustain unsustainable living standards, rapidly-growing emerging economies seek to exploit twin deficits in the medium term to accelerate economic growth in the long term. Yet, twin deficits come with exposure that should keep government leaders alert.

In the early phases of the trade wars, those countries – Taiwan, Singapore, Indonesia, Korea, and Malaysia – that export relatively more to China than to the U.S. tend to be better positioned. The reverse case implies greater relative vulnerabilities, which is why Vietnam has resumed the depreciation of its dong.

Other Asian countries try to avoid U.S. trade wrath by fostering strategic ties with the White House (Taiwan, Korea). Still others seek to hedge their bets by seeking greater balance between Chinese economic cooperation and U.S. security ties (Philippines, Malaysia).

The worse is still ahead

It is a highly dynamic landscape. Among the high-income countries, the Trump administration has offered Seoul strategic relief from the trade war, thanks to Seoul’s cooperation in the Koreas’ nuclear talks, which will provide some cushion against won’s further weakening, in the short-term.

Among the upper-middle income countries, the Chinese central bank (PBOC) pledged last week it would keep the exchange rate stable, which put something of a damper on dollar increases. Since China accounts for more than a fifth of the Federal Reserve’s trade-weighted dollar index, more than any other country, it can subdue dollar rallies.

Among the lower-middle income economies, those countries that have strong domestic demand (India, Philippines) are relatively more insulated from trade wars than commodity producers (Indonesia) and exporters (Vietnam). In the long run, there is no safe haven from the trade wars, however.

Here are some unsettling scenarios for the coming months: If the trade war between the U.S. and China will continue to worsen, it could penalize both U.S. and Chinese GDP by 0.25% by the year end.

If similar trade war expands between the U.S. and Europe, the implications will be worse to the U.S. but weaken Germany, France and other EU core economies and thus undermine the fragile European recovery.

If comparable trade friction will extend to Japan, which, despite huge monetary injections by the Bank of Japan (BOJ), has already lost two decades amid secular stagnation, the adverse impact could harm global economic prospects.

If the NAFTA talks were to collapse, U.S. economy would take still another hit, but so would both Canada and Mexico, which could compel them to broaden their ties with Asian economies.

In brief, the elements of a perfect storm are now possible, if not probable yet, especially if the adverse trends will converge. Even in an incremental scenario – one that would mean continued but not disruptive deterioration – economic damage would prove far more substantial in 2019, or worse.

How the major economies will respond to trade war escalation in the coming weeks will determine what’s ahead for all of us in the next few years.

About the Author:

Dan Steinbock is the founder of Difference Group and has served as research director of international business at the India, China and America Institute (US) and a visiting fellow at the Shanghai Institute for International Studies (China) and the EU Center (Singapore). For more, see http://www.differencegroup.net/ 

The commentary was originally released by The Manila Times on July 9, 2018.


Fibonacci Retracements Analysis 06.07.2018 (BITCOIN, ETHEREUM)

Article By RoboForex.com

BTCUSD, “Bitcoin vs US Dollar”

As we can see in the H4 chart, BTCUSD has already been corrected to the upside by 50.0%. The next possible targets are the retracements of 61.8% and 76.0% at 7000.00 and 7295.00 respectively. However, if the price starts a new descending impulse, the first target will be the low at 5750.00. After breaking it, the instrument may continue trading towards the post-correctional extension area between the retracements of 138.2% and 161.8% at 5352.00 and 5110.00 respectively.

BTCUSD1
Risk Warning: the result of previous trading operations do not guarantee the same results in the future

In the H1 chart, the pair is starting a new descending correction after the divergence. The targets are the retracements of 38.2%, 50.0%, 61.8%, and 76.0% at 6387.50, 6265.50, 6143.50, and 5997.00 respectively.

BTCUSD2
Risk Warning: the result of previous trading operations do not guarantee the same results in the future


ETHUSD, “Ethereum vs. US Dollar”

As we can see in the H4 chart, ETHUSD is being corrected upwards and has already reached the retracement of 38.2%. The next upside targets are the retracements of 50.0% and 61.8% at 516.00 and 543.00 respectively. However, if the instrument breaks the low at 404.21, it may continue falling towards the post-correctional extension area between the retracements of 138.2% and 161.8% at 372.00 and 353.00 respectively.

ETHUSD1
Risk Warning: the result of previous trading operations do not guarantee the same results in the future

In the H1 chart, ETHUSD is being corrected downwards to reach the retracements of 50.0%, 61.8%, and 76.0% at 445.25, 435.45, and 423.50 respectively.

ETHUSD2
Risk Warning: the result of previous trading operations do not guarantee the same results in the future

Article By RoboForex.com

Attention!
Forecasts presented in this section only reflect the author’s private opinion and should not be considered as guidance for trading. RoboForex LP bears no responsibility for trading results based on trading recommendations described in these analytical reviews.