The cryptocurrency market was graced this week with a bit of good news – bitcoin has grown by 18% in the last two days, to 7,450 USD. Trading volumes have increased and the presence of large buyers on the market is also evident, despite the lack of any significant news on bitcoin recently. It is entirely possible that interest in bitcoin has resurfaced following a decline in the first half of 2018. The first six months of the year saw bitcoin fall 63%, to 6,350 USD. And despite attempts to rebound upwards in February and the end of April, they failed to lead to a reversal of the trend. It looks like we will have to wait and see what will happen this time.
In the first half of the year, the only cryptocurrency making gains was EOS, which at the end of April hit a fresh all-time high and broke into the top 5 cryptocurrencies. EOS – a cryptocurrency based on Etherium, made its debut in May 2017. The reason behind the growth was the expectation that it would be launching its own platform. However, following a system malfunction, trading activity saw a dip. Moreover, most of the other cryptocurrencies, as well as bitcoin, have fallen by 40-60% since the beginning of the year.
In addition to the price, the trade volume and volatility (exchange rate fluctuation) of cryptocurrencies fell by 1.5 times as compared with last year. In the first half of the year, cryptocurrencies were not in demand as an investment tool. This is understandable, as it has not made a new high in six months. A significant proportion of those who bought bitcoin at the end of 2017, hoping for growth, grew disappointed and cut their losses. The number of short positions on bitcoin also increased. On the one hand, investors’ faith in bitcoin is undermined by tightened regulations (Japan and South Korea are cracking down in this regard), and on the other, hackers infiltrating Coinrail and Bithumb. This is yet another instance highlighting the lack of sufficient cybersecurity on electronic platforms. It is telling that the number of searches with the tags “buy bitcoin,” “ICO,” and “mining,” as well as the number of references to bitcoin on social networking sites, have noticeably decreased. It is worth mentioning that Facebook, Twitter, and Google have all refused to advertise cryptocurrency investments.
There have been quite a few ups and downs throughout the history of bitcoin. We all remember very well the cryptocurrency’s take-off last year, and even before that there was a stir in 2013, followed by four years of calm. For those who bought bitcoin in the first half of 2017, investing in cryptocurrencies remains profitable. A significant share of these investors continue to believe in the prospects of bitcoin and expect it to reach 20,000 USD.
We believe that in the second half of the year the launch of new ETFs for bitcoin may revive interest in the cryptocurrency, which will lead to the inflow of large investors to the market. If this does not happen, then cryptocurrency fever will continue to fall by the wayside. If in 2017 one couldn’t go far without hearing something about the crypto market, now significant events are being covered noticeably less, and the excitement around cryptocurrencies and ICOs has worn off. However, this does not in the least cancel out the pros of bitcoin – anonymity and decentralisation. These properties are guaranteed to be in demand in the financial world, especially given the escalation of trade wars recently. The development of blockchain technology will continue, and I foresee altcoins as a future means of payment.
Another historical parallel is the dot-com bubble in the US in the early 2000s, which ended with many IT companies tanking on the market. However, this did not stop Amazon, Google, Facebook, and eBay from becoming worldwide corporate heavyweights. We believe that sooner or later, interest and investment in bitcoin and its crypto peers will reemerge. However, it is difficult to predict when exactly that moment will come. Perhaps next year, perhaps in five years. We will just have to wait and see.
The European regulator ESMA (the European Securities and Markets Authority) has introduced a series of temporary restrictions on a few investment products, including CFDs and binary options, that will be implemented in a short time. Since June 1, the final agreements have been reached and the regulator announced temporary measures on July 2 for binary options, and from August 1 for CFDs, says Dmitry Kuravkin, Member of the Management Board of Admiral Markets AS.
The right to intervene in the product
Various developments that led the world into the financial crisis served as the reasons for the fact that the G20 countries, step by step, began to tighten the requirements for financial market participants, giving regulators more and more rights, and adding new rules to increase market transparency and protect the interests of retail investors. One such rule is, for example, the obligation to have an LEI code for all persons making transactions in the financial markets.
With the entry of the pan-European regulations MIFID2 and MIFIR in force, regulators received the rights to intervene in the product. For the first time, the regulator has the right to influence the conditions of a particular instrument (e.g. shares, bonds, funds or derivative financial instruments) and complete it much faster than before. This right was given to ESMA, EBA, as well as, to each individual supervisory authority of each member state of the European Union. Restrictions can be provided by the ESMA, EBA or local regulators to apply to financial service providers registered in Europe, and also to the activities of service companies in the countries of the European Union. The maximum time limit for a possible restriction is 3 months, but it can be extended if necessary.
The essence of the restrictions
The sale and advertising of binary options to customers are prohibited entirely. CFDs will be primarily limited in the amount of leverage that can be achieved today at 1:500, but will be limited from August 1 for retail investors to 1:30 or 1:20 for currency pairs, and 1:2 for CFDs on cryptocurrencies (the size of the leverage was chosen by the regulator depending on the volatility of the underlying instrument). More details about all the changes in leverage can be found on the ESMA website.
“An example for a trader: reducing the leverage from 1:100 to 1:20 with a security deposit of 24 euros will be necessary for the same position to have a deposit of 120 Euros. Prior to the implementation of the measures, ESMA conducted a survey among investors receiving more than 20,000 reviews, which shows that radical changes may affect a larger group of retail investors who, due to lower leverage, will need to use more collateral, including previously opened positions. Many of the reviews were related to the possibility of obtaining the same conditions from brokers outside the EU. Despite the fact that CFDs are tools that you can access not only from regulated brokers, Admiral Markets does not recommend doing this. In such cases, one always needs to be prepared for the fact that in this case, the loss of funds is very high and there will be no one to apply to for protection, because the regulator is either absent, or because it is difficult to get contact with them).” says Dmitry Kuravkin, Member of the Management Board of Admiral Markets AS.
Dmitry Kuravkin, Member of the Management Board of Admiral Markets AS
Admiral Markets conducted research on how customers are reacting to the restrictions of the new regulation. In our most visited regular webinar in Germany, we made a quick poll of traders. Of the 293 participants in the event, 43% took part in the survey and gave the following answers to the question “How will ESMA change things for you, as a trader?
· 24% will trade as Professionals
· 45% will just trade with a leverage of 20 or 30
· 17% will deposit more money
· 38% will trade smaller volumes
· 10% others
“Most of our clients encountered a problem with the issue of the ESMA regulation, but there is still a great demand for higher-quality information on this topic,” explains Jens Chrzanowski, Member of the Management Board of Admiral Markets Group AS. “It was important for us to get an idea of how the CFD traders plan to deal with the new regulation.”
Jens Chrzanowski, Member of the Management Board of Admiral Markets Group AS
Temporary restrictions also apply to advertisements – the regulator limits the various bonus programs often used by brokers and introduces a standardized risk notification that each broker must post on the site and on all of its promotional materials.
All temporary measures introduced by the regulator apply only to retail investors, as a less protected group and do not concern professional investors.
“Admiral Markets was preparing for these changes long before the announcement of the final measures. As we said before, we welcome any measures aimed at protecting retail investors (professional investors do not have temporary restrictions) and believe that this set of clear rules will improve the market by ensuring that access to high-risk instruments will be more conscious,” explained Dmitry Kuravkin, Member of the Management Board of Admiral Markets AS.
About Admiral Markets
Admiral Markets is a leading online Forex and CFD trading provider. In addition to a wide range of financial instruments, Admiral Markets offers free educational materials, including analytics, webinars and seminars.
Risk Disclosure: Trading in financial markets on margin carries a high level of risk and losses may exceed your initial deposit. Admiral Markets UK Ltd. recommends you seek advice from an independent financial advisor to ensure that you understand the risks involved with Forex, CFDs and margin trading (https://admiralmarkets.com/risk-disclosure).
Ever since the crypto sector took a massive tumble at the beginning of 2018, we have seen numerous pundits calling it “the end of Bitcoin”. Others have insisted this was but a mild hiccup and the cryptocurrency would see a return in short order. With Bitcoin dropping lower, it is hard to tell what to forecast at this point. And for investors who are looking to maximize their return, the question becomes: Will the Bitcoin price be recovering any time soon, or should they be seeking alternative investment vehicles for the time being?
After the Crash
The crypto world is hardly homogeneous as there was a wide variety of reactions to the crash of Bitcoin. Some HODLers turned out to not have the conviction required, and others doubled down on their view. We figured out that many of the traders who were previously doing incredibly well were just benefiting from the glories of a bull market and didn’t really believe in the long-term potential of Bitcoin.
Basically, the crash served as a wake-up call for all the proselytizers in the industry. All the people shilling ICOs they didn’t believe in were left high and dry, and the industry went through something of a purge. This “purge” of sorts went a lot like the way the Dotcom bubble burst went in 2000s. But this hardly means it is the end of Bitcoin, just as the Dotcom crash didn’t mean that the Internet stocks would disappear.
What Happened Last Time
If we are going to predict the future, it might help to take a look at how the market performed when Bitcoin previously crashed. This has happened many times, but the most drastic crash ever occurred in late 2013 when the price collapsed from a high of $1,163 to $152.40 – representing a drop of 87%. This crash lasted 411 days, which probably had many investors thinking it would never come back.
But this isn’t the first time that industry professionals have referred to Bitcoin’s finale. All too often, Bitcoin is referred to as being “dead”. A large part of this can be attributed to the polarizing nature and risky perception of Bitcoin. There is even a special Bitcoin Obituary that details how many times (currently at 306) Bitcoin was declared dead and worth nothing.
As we know, all of these crashes (or “deaths”) have been followed by Bitcoin’s return where it would eventually hit another all-time high. By now we should be used to the fact that it is a volatile asset and the one that always seems to come back stronger the next time. Market corrections are common across all industries, but a world-changing investment like Bitcoin just happens to go through much more drastic ones.
Next Level Predictions
A common pattern is that investors with bull perspectives on the performance of Bitcoin are calling for massive increases in the price, even as it hits all-time lows. For example, Tom Lee predicts a price as high as $25k by the end of the year, and Robert Sluymer believes that Bitcoin has hit its bottom already and is about to reverse the trend.
Technical analysis is part of the bullishness of these investors, but there are also a lot of fundamental reasons why the cryptocurrency could be on its way to a new all-time high. One of the main reasons investors are predicting a recovery in the near future is the looming presence of large financial institutions who are gearing up to enter the industry. We have already seen Robin Hood aim to capitalize on the trading sector, but as more large institutions seek to take some of the market shares, many more investors and traders are expected to enter the industry. It also helps to see big funds like Andreessen Horowitz committing large amounts of money to the sector.
Additionally, many major governments, such as Thailand, the United States, and Japan are starting to provide more guidance relating to cryptocurrencies, and this should reduce a lot of the uncertainty regarding investing in them.
Another reason being offered for Bitcoin’s imminent recovery is the movement of the cost of mining a single Bitcoin. This cost has been increasing along with the level of difficulty required to mine a single coin, and it has served as a solid indicator of the price of Bitcoin. Miners have no incentive to mine coins for rates less than their costs of mining, so Bitcoin must once again rise in order to restore the economic requirements of the market.
Somewhere in the Middle
Strong opinions are fodder for those in the investment industry, and this goes double for anyone who chooses to speak about Bitcoin. This is due to its end goal of displacing the ever-present USD as the global currency. With a market capitalization of $115 billion and a price of $6,700 as of mid-July, there is a long way to go before it recovers to its all-time high of $19,783.
It seems like there are two points of view on the outlook for Bitcoin: it is either the future or already in the past. It is hard to reconcile the strong opinions on either side, but it is necessary to get a better idea of the life cycle of an industry. The Dotcom burst did occur in 2001, but many companies survived that crash to go on to do great things. With investors like Tim Draper calling for Bitcoin to hit $100k by the end of the year, and others like Nouriel Roubini saying it is a total sham, it is easy to let the uncertainty affect you. Things could be going either way, so the best decision every investor might make is to research as much as they can and never invest more than they are comfortable losing.
About the Author: Mary Ann Callahan
As an expert on Bitcoin-related topics, I’ve found myself as a Journalist at Cex.io – cryptocurrency exchange. I’m working on articles related to blockchain security, bitcoin purchase guides or bitcoin regulations in different countries.
On Thursday, the British pound falls down quickly against the dollar. The pair is currently trading at $1.3027, near its Sep 2017 lows.
The most negative factor for the pound was the inflation information. Once this report was released, the investors determined the likelihood of the BoE rate hike as 70% or 80%, which is quite high, but has not supported the British currency so far, or even quite the reverse. The macroeconomic stats are brought to nothing by the Boris Johnson’s speech where he is expected to severely criticize May’s policy regarding Brexit. This puts the pound well under pressure.
As for other fundamentals, the UK CPI in July remained unchanged at 2.4% YoY, despite the expectations at 2.5%. Meanwhile, the base inflation is edging down, reaching just 1.9% YoY in June compared to 2.1% in May.
The investors get somewhat worried about other inflation stats, too. Thus, the PPI input rose by just 0.2% MoM in June after skyrocketing by 3.3% in May, while the PPI output added just 0.1%, after increasing by 0.5% in May.
Brexit is still the most important point for the pound, and the more politicians are against ‘smooth’ Brexit, the more uncertain and nervous the market is.
Attention! Forecasts presented in this section only reflect the author’s private opinion and should not be considered as guidance for trading. RoboForex LP bears no responsibility for trading results based on trading recommendations described in these analytical reviews.
Yesterday’s trading on the EUR/USD currency pair was very active. However, a unidirectional trend was not observed. At the moment, quotes are testing local support and resistance levels: 1.16250 and 1.16500, respectively. The trading instrument is tending to decline. We are waiting for statistics from the USA. We recommend opening positions from the key levels.
The news feed on 2018.07.19:
At 15:30 (GMT+3:00) the index of production activity from the Federal Reserve Bank of Philadelphia will be published.
Indicators point to the power of sellers. The price has fixed below 50 MA and 200 MA.
The MACD histogram is located in the negative zone and continues to decline, which indicates a bearish sentiment on the EUR/USD currency pair.
Stochastic Oscillator is in the neutral zone, the %K line is below the %D line, which also gives a signal to sell EUR/USD.
Trading recommendations
Support levels: 1.16250, 1.16000, 1.15500
Resistance levels: 1.16500, 1.16750, 1.17000
If the price is fixed below 1.16250, further fall of the EUR/USD currency pair is expected. The movement is tending to 1.16000-1.15500.
Alternative option. If the price fixes above the resistance level of 1.16500, it is necessary to consider buying EUR/USD. The movement is tending to 1.16750-1.17000.
The GBP/USD currency pair
Technical indicators of the currency pair:
Prev Open: 1.31103
Open: 1.30659
% chg. over the last day: -0.29
Day’s range: 1.30441 – 1.30832
52 wk range: 1.2361 – 1.4345
Yesterday, GBP/USD continued to decline. Pressure on the pound was put by a weak inflation report in the UK. In June, the consumer price index counted to 2.4% (year on year), which is below the market expectations of 2.6%. At the moment, the GBP/USD is testing local support and resistance levels: 1.30400 and 1.30800, respectively. In the near future, a technical correction is not ruled out. Positions must be opened from the key levels.
At 11:30 (GMT+3:00) a report on retail sales in the UK will be published.
Indicators point to the power sellers. The price has fixed below 50 MA and 200 MA.
The MACD histogram is in the negative zone and continues to decline, which signals a bearish sentiment.
Stochastic Oscillator is located in the neutral zone, the %K line is below the %D line, which sends a signal to sell GBP/USD.
Trading recommendations
Support levels: 1.30400, 1.30100, 1.29750
Resistance levels: 1.30800, 1.31150, 1.31700
If the price falls below the support level of 1.30400, further drop in the GBP/USD price is expected. The closest target for fixing profits is the mark of 1.30100-1.30000.
Alternative option. If the price fixes above 1.30800, a correction movement is expected. The movement is tending to 1.31150-1.31400.
The USD/CAD currency pair
Technical indicators of the currency pair:
Prev Open: 1.31928
Open: 1.31654
% chg. over the last day: -0.16
Day’s range: 1.31598 – 1.31936
52 wk range: 1.2059 – 1.3795
During yesterday’s trading the bearish sentiment prevailed on the USD/CAD currency pair. The Canadian dollar has recovered a significant part of the losses. At the moment the USD/CAD quotes are testing the “mirror” resistance of 1.31900. The key support is the mark 1.31600. We are waiting for statistics from the USA. We recommend opening positions from the key levels.
The news feed on economy of Canada is calm.
Indicators do not send accurate signals. The price has crossed 50 MA.
The MACD histogram is in the negative zone, but above the signal line, which gives a weak signal to sell USD/CAD.
Stochastic Oscillator is located in the neutral zone, the %K line is above the %D line, which indicates the bullish sentiment.
Trading recommendations
Support levels: 1.31600, 1.31250
Resistance levels: 1.31900, 1.32150, 1.32350
If the price fixes above the “mirror” resistance of 1.31900, it is necessary to consider buying USD/CAD. The movement is tending to 1.32150-1.32350.
Alternatively, USD/CAD may drop to 1.31600-1.31500.
The USD/JPY currency pair
Technical indicators of the currency pair:
Prev Open: 112.858
Open: 112.829
% chg. over the last day: -0.06
Day’s range: 112.652 – 112.966
52 wk range: 104.56 – 114.74
On the USD/JPY currency pair there was an ambiguous technical pattern. The trading instrument is in a sideways trend. The USD/JPY quotes are testing monthly highs. The key levels of support and resistance are: 112.700 and 113.100 respectively. Correction is not ruled out in the near future. We recommend paying attention to the news feed on the US economy.
In the Asian trading session, mixed data on trade balance of Japan were published.
Indicators do not send accurate signals. The price has crossed 50 MA.
The MACD histogram is located near the 0 mark.
Stochastic Oscillator is located in the neutral zone, the %K line is above the %D line, which indicates the growth of USD/JPY.
Trading recommendations
Support levels: 112.700, 112.500, 112.200
Resistance levels: 113.100, 113.500
If the price fixes above the 113.100 level, further growth of the USD/JPY currency pair is expected. The movement is tending to 113.500-113.750.
Alternative option. If the price fixes below the 112.700 level, a correction movement is expected. The target level of movement is 112.500-112.200.
The Aussie is still slightly rising Thursday against the greenback, currently trading at $0.7395. During the Asian session it was going up very actively, but then failed to keep its advantage.
The stats released earlier today showed the unemployment in Australia remained at 5.4% in June, just as expected. Meanwhile, the number of jobs increased by as much as 50,900, with just 13,400 in May and 16,700 expected. Curiously, most jobs created are full time, +41,200, with less than 10k part time. The number of hours worked in June also went up, which is positive for both manufacturing and the Australian economy in general.
It looks like the job market in Australia is quite strong, with the number of jobs rising, which allows most people to find job quite easily. This will then influence the consumer confidence, inflation, and economic growth positively.
The NAB business confidence index in Australia edged down to 7 points in Q2, after reaching 8 in Q1. This is most likely the reaction to the risks arising from trade wars enforced by the US to Australia’s strategic partner, China.
Attention! Forecasts presented in this section only reflect the author’s private opinion and should not be considered as guidance for trading. RoboForex LP bears no responsibility for trading results based on trading recommendations described in these analytical reviews.
The US dollar continued to strengthen against the basket of major currencies. The US dollar index (#DX) reached the highest mark for two weeks and closed in the positive zone (+0.15%). Yesterday the Fed’s Beige Book was published, which pointed to further growth of the US economy. However, despite this, the growth is limited due to employee scarcity and an increase in the raw materials prices. Additional pressure is put by the trade conflict between the US and China.
Yesterday, a number of important economic data were also published. The consumer price index in the UK was 2.4% (year on year) and was worse than the forecasted value of 2.6%. The consumer price index in the Eurozone met investors’ expectations and amounted to 2.0% (year on year). The number of building permits issued in the US fell to 1.273M, while experts expected the value of 1.330M. Today in the Asian trading session a report on the labor market for June in Australia was published, which showed that the number of employees increased by 50.9K instead of the expected value of 16.7K.
The “black gold” prices are falling against the backdrop of growing crude oil inventories in the US. At the moment, futures for the WTI crude oil are testing the mark of $67.65 per barrel.
Market Indicators
Yesterday, a variety of trends was observed in the US stock market: #SPY (+0.21%), #DIA (+0.30%), #QQQ (-0.19%).
At the moment, the yield of 10-year US government bonds is at the level of 2.87-2.88%.
The news feed on 2018.07.19:
– A report on retail sales in the UK at 11:30 (GMT+3:00); – The index of manufacturing activity from the Federal Reserve Bank in the US at 15:30 (GMT+3:00).
Start-up companies that are valued over one billion USD are awarded the title of “unicorn”. They then gallop ahead in factors of 10—a decacorn is worth over 10 billion USD, and a hectocorn is valued at over 100 billion USD. The US might be the natural target for these mythical creatures, but with a trade war brewing between the two giant nations, Chinese unicorns are staying put.
As the trade war between the US and China keeps developing, Chinese unicorns have been requested by the Chinese government to stay at home rather than fly off to meet with wealthy US investors in Silicon Valley.
Ever since US President Donald Trump raised the specter of a trade war between the two giant nations, the channel of Chinese IPOs looking to raise cash in the US has run dry. One new Chinese IPO for e-commerce site Pinduoduo has attracted some attention, but it’s currently in a class of one, with nobody waiting in line. This new company, which is currently facing off with Alibaba and JD.com, is a natural fit for a US listing where it could compete against other e-commerce colossi.
So, where are Chinese IPOs headed? Well, Hong Kong! A UK colony for 150 years before returning to China in 1997, HK is currently enhancing its status as a financial hub. Chinese Apple-lookalike Xiaomi just raised 3.1 billion USD through an IPO, and there are at least two dozen more Chinese companies with something to say, looking to raise cash. In Hong Kong alone, the total value of IPOs exceeds 10 billion USD. With a shortage of hi-tech activity, Hong Kong has welcomed Chinese unicorns with open arms. And with only 10% of the Hang Seng index devoted to hi-tech, compared to 40% of hi-tech stocks in the S&P 500, the US-China trade war has produced an unexpected dividend for the island province.
US investors won’t be happy missing out on these Chinese IPOs. In recent years, Chinese stock releases have been extremely popular, and the Chinese government wasn’t too happy with this situation either. They could sense the Chinese middle class growing aggravation, as Chinese unicorns soaked up billions of US dollars, while US investors benefitted from the capital gains in their stocks.
But even with activity heating up in Hong Kong, Chinese American Deposit Receipts, or ADRs, are outperforming the Hong Kong market. Renaissance Holdings Limited, a Chinese investment bank that provides investment advice to the best and brightest Chinese tech companies, provides a good indication of the way future Chinese IPOs will develop. The bank is planning a listing in Hong Kong, targeting a valuation of 4 to 5 billion USD.
The drying up of Chinese unicorn business will do further damage to the relations between China and the US, and it’s not easy to see any good news ahead. Chinese start-ups will find investors for their ideas in other locations, and US investors will be left high and dry, wondering when this particular mess will sort itself out.
About the Author:
AmramMargalit is a professional writer who has worked in a wide range of settings, including technology companies, nonprofits, and the entertainment industry. Within these positions, Amram has provided quality content and advertising services and is currently the Content Manager at Leverate.
Cryptocurrencies are now “undeniably part of mainstream finance”, affirms the boss of one of the world’s largest independent financial services organizations.
The bold statement from the founder and CEO of deVere Group, Nigel Green, comes as the Financial Stability Board (FSB), has released a report that concludes Bitcoin and cryptocurrencies do not currently pose a risk to the global financial system.
It also comes as Bitcoin (BTC), the world’s largest and most influential digital currency, climbed the 50-day moving average (MA) on Monday for the first time in nearly two months, hiking its price above $6,700.
Mr Green comments: “Cryptocurrencies are the future of money and they are already undeniably part of mainstream finance.
“This is underscored today by the report by the Financial Stability Board (FSB), the international watchdog, which finds that cryptocurrencies do not pose a material risk to the global financial system – which some traditionalists with vested interests have hitherto argued in order to knock digital currencies.”
He continues: “This report comes after the FSB, which is headed by Bank of England Governor Mark Carney, previously wrote a letter to the G20 finance ministers and central bank governors earlier this year stating that Bitcoin does not pose a ‘systemic risk’ to the global financial system.
“As such, the latest report can be seen as further recommendation of cryptocurrencies from the influential FSB — which has members from all the G20 major economies.”
Mr Green goes on to say: “The FSB’s conclusion follows more and more global financial institutions, major corporations and household name investors now working with cryptocurrencies and blockchain, the technology that underpins them, and as international regulation is developed further.”
In May, deVere revealed findings of a global survey that found 35 per cent of wealthy investors will have exposure to cryptocurrencies by the end of 2018.
At that time, Mr Green said: “The survey’s findings demonstrate that high net worth individuals are increasingly unable to ignore the huge potential of cryptocurrencies.”
The deVere CEO concludes: “There’s now surging awareness of the value, need and demand for digital, global currencies in a digitalized, globalized world.
“The world of money has fundamentally changed – and despite what some crypto cynics want, it can’t and will not go backwards. Therefore, the FSB’s proactive and positive work in this sector must be championed.”
About:
deVere Group is one of the world’s largest independent advisors of specialist global financial solutions to international, local mass affluent, and high-net-worth clients. It has a network of more than 70 offices across the world, over 80,000 clients and $12bn under advisement.
Our weekend analysis of the markets continues to amaze our research team simply because we see so many other researchers continue to miss the signals. We’ve been calling this market bottom since the middle of February 2018 and we have stuck to our analysis even though we’ve taken some flack from others about it. Now, with earnings nearly upon us and the markets poised to either breakout higher or rotate lower, our longer-term analysis shows the markets are in pretty good shape for a continued upside rally.
This week, there are 214 companies reporting earnings data. Next week, there are 781 companies reporting earnings data. The following week, another 1003 companies release earnings data. Combined, we are going to have 1998 companies releasing Q2 earnings data and each of these, to some extent, could drive the markets higher or lower as this data is digested.
US Real Disposable Income has increased from $12,570 (December 2016) to $13,009 (May 2018) (source : https://fred.stlouisfed.org). Gross Private Domestic Investment has risen from $3,126.18 (Q4 2016) to $3,379.11 (Q1 2018) (source : https://fred.stlouisfed.org). Personal Income has risen from $16,027.03 (December 2016) to $17,005.4 (May 2018) (source : https://fred.stlouisfed.org).
Think about those core factors of the US economy as well as the facts that US companies have been able to rebuild and restructure – often running leaner and meaner than years ago. Of course, US corporate debt levels have risen in tandem with these personal income levels. US corporate debt levels have risen nearly 20% in 2017 alone. Yet, we continue to believe the overall health of the US economic is much stronger than many people believe, and we continue to believe a huge influx of foreign capital is driving the US equities markets to higher values in the face of any isolated economic concerns. The fact is that the US equity markets are really the only location on the planet where protection from currency devaluation and localized economic/equity deflation concerns can be thwarted (at the moment).
Onto the charts…
MONTHLY SP500 CHART
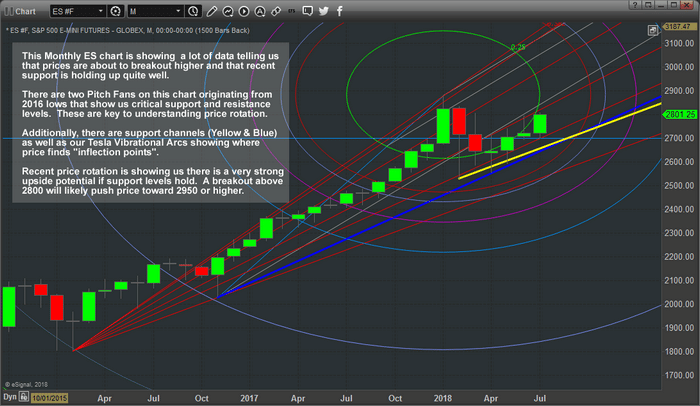
This Monthly ES chart may be a little complicated to understand when you first look at it but pay attention to our analysis of this data and it will become easier to understand.
The two support channels (Yellow and Blue) are critical to understand price support. These longer-term price support levels are key to understanding how and when this current upswing in price may end (if it ends). Right now, these support levels are telling us that price has established a low rotation point and advanced higher setting up these support channels as key price levels should it break lower. As long as these support channels hold, price should continue to push higher.
Additionally, pay attention to out proprietary Tesla Vibrational Arc (circles) on this chart. They are showing us that price has recently exited the inner (25%) arc and is currently rallying outside of this price level. In theory, as long as the support channels hold and price attempts to move towards the next Tesla Arc, we can expect price to advance towards $2950 or $3080 throughout the end of this year. The current level, near $2800, can be seen as an “inflection point” where the outer RED arc crossed our Pitch Fan level. This would indicate that any move above $2800 would likely prompt a bigger upside move towards $2950 or higher.
Lastly, the Pitch Fans are drawn from 2016 low points and are used to attempt to identify and highlight price support and resistance levels. In this case, we are using them to identify “crossing points” where these fan levels cross our Tesla Arcs and other drawn lines to see where price may be targeting in the future. Just above the current price, we see a Red and Grey Pitch Fan level that is acting like resistance near $2850. Understand that these levels, once breached, will likely propel the ES price much higher.
MONTHLY NASDAQ CHART
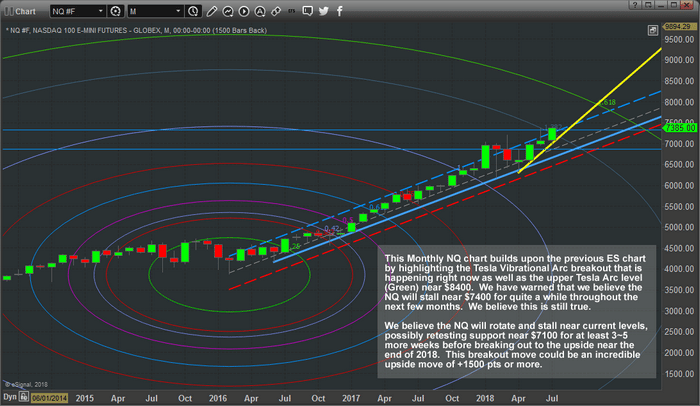
The Monthly NQ chart below shows similar price action to the ES chart – yet we see a more defined uptrend in place. As we’ve been warning, we believe the NQ will stall/rotate near the $7400 level for at least the next few weeks (3~5+ weeks) before attempting a further upside move into the end of 2018 and possibly longer. Right now, the NQ has rallied to all-time highs this month and is sitting very close to our $7400 target level. We can see from this chart we have two upward sloping price support channels (Yellow and Light Blue) that provide us with a very clear understanding of where price support is located. The current, Yellow, level is more recent and will likely be broken if the NQ stalls as we expect.
The Std. Deviation channel (the Dashed lines) on this chart shows that price has been rotating near the upper levels of this price channel and that price is attempting a breakout upside move currently. Notice the Tesla Vibrational Arc that is sitting very near to the $7375 level? This arc will likely result in some lower price rotation in the NQ over the next 3+ weeks with the potential that we could see a rotation to near $7100 or lower before another upside move sets up. Generally, when the price exits the upper Std Deviation channel and coincides with one of our Tesla Arcs, one of two things will likely happen; a. price will stall and rotate lower a bit before breaking out of this congestion or, b. price will blow right past this arc level in a massive price breach.
Right now, we believe our earlier estimate that price will consolidate and stall near $7400 is the correct interpretation.
MONTHLY TRAN (TRANSPORTATION INDEX) CHART
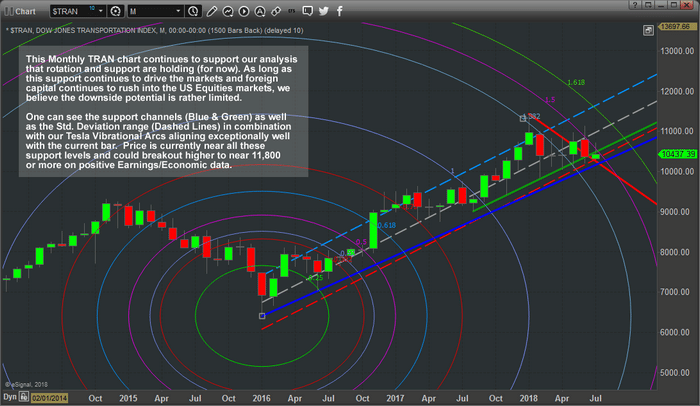
This Monthly TRAN (Transportation Index) chart below provides one of the clearest pictures yet of the true underlying market dynamics (in our opinion). Feb 2018 highs are still in place – they are still the critical component from a technical basis for any further upside price moves. Support channels, both the Green and Blue solid lines) are indicating that price is currently within these support channels and has not broken lower (yet). The Std. Deviation channels (the Dashed lines) are showing us that price is currently sitting near the lower Std. Dev levels (near dual support).
Additionally, the Tesla Vibrational Arc (the Purple arc near the current bars) is showing us that price has recently broken through the previous arc (the Light Blue arc near the Jan/Feb 2018 highs : 1.382%) and is struggling to break out of this new Purple Arc (1.50%). What this means to us is that price is “coiling near support and will likely make an explosive move – one way or the other”.
Now, take into consideration the Red Resistance Channel Line that created a Pennant/Flag formation recently. We’ve seen price, over the most recent 3+ bars, rotate above this Red Resistance level and rotate back into it. Now, with the Month of July, we see price struggling near these lows, yet very near to the support channels and Std. Deviation channels, as well as very near to the Purple Tesla Arc. Knowing that we have nearly 2000 earnings data points hitting the markets over the next 3 weeks and the correlation of support/upside breakout analysis that we’ve identified in the ES and NQ markets, only one analysis can be made for the Transportation Index….
As long as the $10,100 support level holds and the ES/NQ do not break their immediate (YELLOW) support channels, the Transportation Index is setting up to be one of the best buy opportunities (with low risk) that we’ve seen in a very long time. Yes, there is downside risk should the markets break lower – we understand that. The fact that all of these longer-term charts are aligning with the potential that earning could drive the market to fresh highs, the Transportation Index appears to be one of the most opportunistic setups we’ve seen so far.
Now, are you ready for these next few weeks with earnings about to hit the markets? Are you prepared to take advantage of these setup and potential moves? Do you understand what we are attempting to illustrate to you and how these types of setups can dramatically improve your trading success?
Want to know how we can help you even more than just showing you these nice charts? Then visit www.TheTechnicalTraders.com to learn how we can help you stay aware and ahead of these markets moves and how our team of researchers can help you find greater success.
The markets are going to move over the next 2~5+ months and our analysis has already shown us that the markets want to continue to “melt higher”. The only concern we have, at this point, is if some external news/crisis event disrupts the price advance and breaks support. If not, then this market should rally from these support levels and attempt new/fresh highs within the next 20~45+ days. Don’t miss it.
53 years experience in researching and trading makes analyzing the complex and ever-changing financial markets a natural process. We have a simple and highly effective way to provide our customers with the most convenient, accurate, and timely market forecasts available today. Our stock and ETF trading alerts are readily available through our exclusive membership service via email and SMS text. Our newsletter, Technical Trading Mastery book, and 3 Hour Trading Video Course are designed for both traders and investors. Also, some of our strategies have been fully automated for the ultimate trading experience.
Get our advanced research and market reporting, Daily market videos, detailed trading signals and join the hundreds of other traders that follow our research every day and profit.