The following Weekly charts are illustrations of one of our proprietary price modeling systems that shows trends, market breadth and much more. We use this almost exclusively on longer-term (Weekly, Monthly, and Quarterly charts) to help us understand where longer-term support and resistance levels are, where the market ranges are truly important and to determine true market breadth. When we are studying Daily chart or intra-day charts – the shorter term price rotation can often clutter our interpretation of the long term expectations. Yes, we have other modeling systems, predictive analysis systems, Fibonacci systems, Adaptive Cycles systems and more. Our collection of proprietary analysis tools is very deep. Yet, one has to know how to use these tools and what value they can provide at different times.
This proprietary modeling system is designed to model price swings/rotation and provide clear overall objective analysis of key price levels/pivots. We call it “TT Charger”.
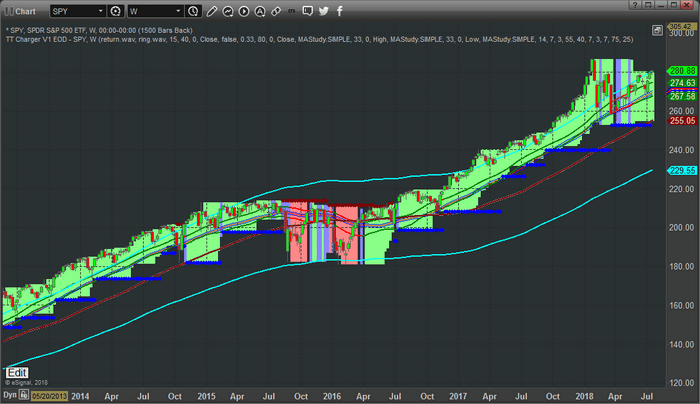
WEEKLY CHART OF THE SPY USING OUR TT CHARGER MODELING SYSTEM
This first Weekly chart of the SPY using our TT Charger modeling system is clearly still bullish. The price breadth contracting a bit near the current prices and support is currently functioning near $252. The current market price has recently broken higher above the short term price channels in addition to the longer term price channels. This is a pretty good indication that price may attempt another rally attempt that may extend for many weeks. In 2017, we witnessed more than 5 to 15+ weeks of extended price rally above both of these channel levels at times. The recent rotation in February 2018 may operate as a “recharging of price” in terms of a future rally attempt.
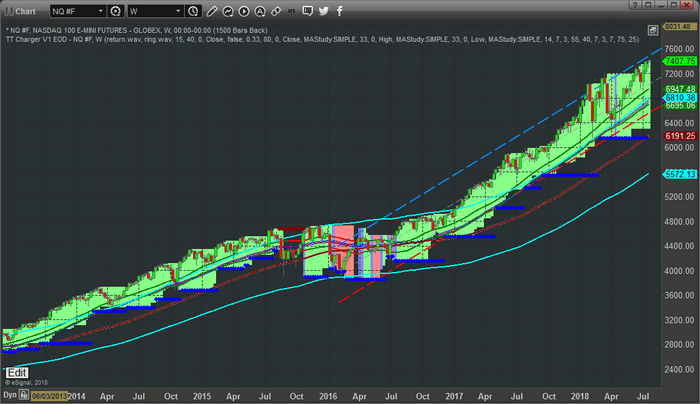
WEEKLY NQ CHART WITH THE TT CHARGER
This Weekly NQ chart with the TT Charger applied for shows an even more incredible setup. Support is currently setting near $6190 and price has extended beyond both of the price channels for more than 11 weeks now. Market Breadth is expanding, therefore the implied volatility is increasing as well. Although we may not see a very big volatility rotation in price, the capability of increased volatility is still valid.
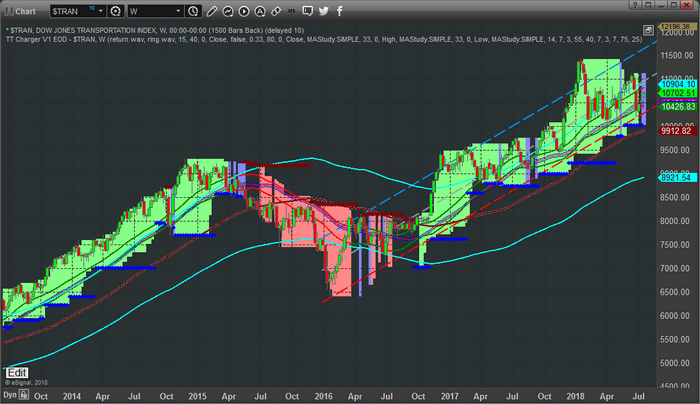
WEEKLY TRANSPORTATION INDEX CHART
This Weekly Transportation Index chart paints a clearer picture of the struggling Transportation Index in terms of the recent price rotation. The TT Charger analysis still shows a solidly bullish price trend with support at $10,005. Price is within the longer term price channels and just above the shorter term price channel. The Transportation index typically leads the US equities markets by about 4~8 months, so it is important that we see the Transportation index rally in support of the equities markets rally. If this fails to happen, then we are likely experiencing a “capital appreciation” that is not supported by economic fundamentals. In other words, without a rally in the Transports, any price advance in the equities markets is likely short-lived (3~6 months at best) before one of the two will break.
At this point, our interpretation of these charts is that the US earnings season should drive equities prices higher, within and above these price channels, and create a real opportunity for investors/traders. Yes, support is quite a bit below the current price levels, but these support models will adjust as price advances. Unless a reversal trigger is generated, which does not seem likely right now, or the support levels are broken, which is not likely right away, we should be looking for advancing prices and breakout rallies over the next few weeks or months.
Our members have access to much greater insight and analysis than we can share with the general public. We reserve our most advanced price modeling systems, predictive analysis and research for our exclusive membership levels. We are warning you that a massive upside swing is about to setup and you’ll want to be prepared for it because this could be a true “once in a lifetime” type of move. We also urge you to consider joining TheTechnicalTraders.com as a member to receive all of our detailed updates, daily videos, trading signals and more. If you don’t believe we can assist you in your future with our research, analysis and other features and benefits, you can cancel your subscription and move onto something else.
Either way, we urge you to be prepared for this next move higher and take a few minutes to read over our most recent public research posts at www.TheTechnicalTraders.com/FreeMarketResearch/.
US Dollar net speculator positions leveled at $18.41 billion as of Tuesday
The latest data for the weekly Commitment of Traders (COT) report, released by the Commodity Futures Trading Commission (CFTC) on Friday, showed that large traders and currency speculators raised their bullish bets for the US dollar again this week while cutting their positions for the Japanese yen and the euro. See full article
The non-commercial contracts of WTI crude futures totaled a net position of 631,294 contracts, according to data from this week. This was a slide of -23,171 contracts from the previous weekly total. See full article
The large speculator contracts of gold futures totaled a net position of 57,841 contracts. This was a weekly decline of -23,593 contracts from the previous week. See full article
The large speculator contracts of 10-year treasury note futures totaled a net position of -469,138 contracts. This was a weekly reduction of -29,990 contracts from the previous week. See full article
The non-commercial contracts of silver futures totaled a net position of 8,882 contracts, according to data from this week. This was a weekly fall of -14,817 contracts from the previous totals. See full article
The large speculator contracts of copper futures totaled a net position of 9,113 contracts. This was a weekly shortfall of -5,070 contracts from the data of the previous week. See full article
The Commitment of Traders report data is published in raw form every Friday by the Commodity Futures Trading Commission (CFTC) and shows the futures positions of market participants as of the previous Tuesday (data is reported 3 days behind).
US Dollar net speculator positions rose to $18.41 billion this week
The latest data for the weekly Commitment of Traders (COT) report, released by the Commodity Futures Trading Commission (CFTC) on Friday, showed that large traders and currency speculators raised their bullish bets for the US dollar again this week while cutting their positions for the Japanese yen and the euro.
Non-commercial large futures traders, including hedge funds and large speculators, had an overall US dollar net position totaling $18.41 billion as of Tuesday July 17th, according to the latest data from the CFTC and dollar amount calculations by Reuters. This was a weekly rise of $2.0 billion from the $16.41 billion total position that was registered the previous week, according to the Reuters calculation (totals of the US dollar contracts against the combined contracts of the euro, British pound, Japanese yen, Australian dollar, Canadian dollar and the Swiss franc).
The aggregate speculative position has risen for five straight weeks and is now at the highest level since March 21st of 2017 when the total was $18.44 billion.
Individual Currency Contract Data this week
For individual currency contracts this week, the non-commercial large futures traders, including hedge funds and large speculators, bet in favor of the US Dollar Index (239 weekly change in contracts), British pound sterling (1,651 contracts), Canadian dollar (5,403 contracts), Australian dollar (448 contracts), New Zealand dollar (1,507 contracts) and the Mexican peso (946 contracts).
The currencies whose speculative bets declined this week versus the dollar were the euro (-2,950 weekly change in contracts), Japanese yen (-18,818 contracts) and the Swiss franc (-2,022 contracts).
Table of Weekly Commercial Traders and Speculators Levels & Changes:
Currency
Net Commercials
Comms Weekly Chg
Net Speculators
Specs Weekly Chg
EuroFx
-29,396
384
21,407
-2,950
GBP
55,687
-510
-38,752
1,651
JPY
85,168
21,814
-58,650
-18,818
CHF
65,083
3,395
-42,143
-2,022
CAD
58,541
-654
-47,484
5,403
AUD
61,264
-1,616
-40,525
448
NZD
29,222
-2,020
-25,067
1,507
MXN
-30,574
-3,115
29,078
946
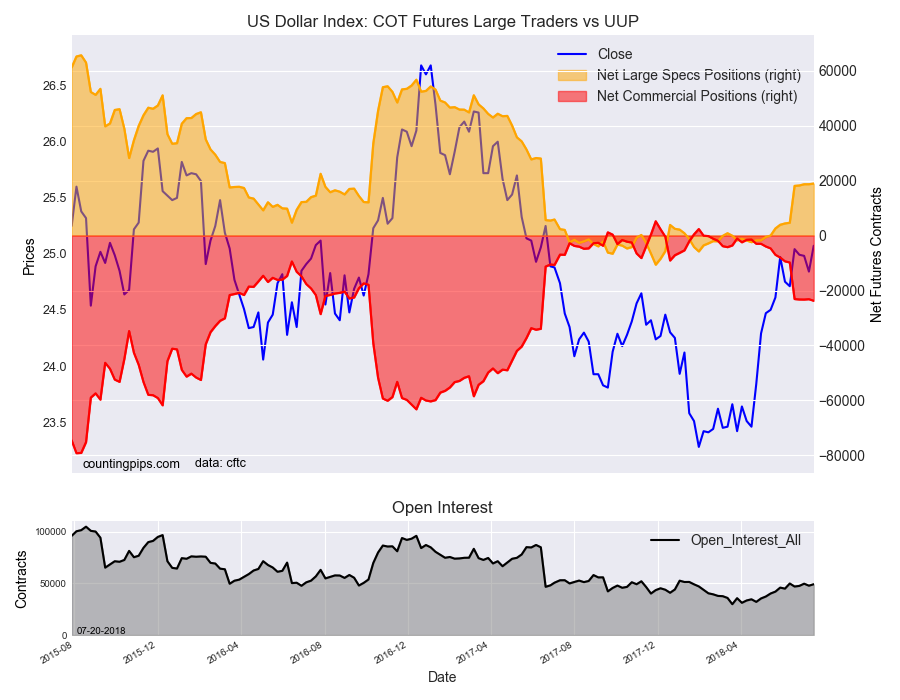
US Dollar Index positions continue to improve
Speculators continued to raise bets for the US dollar index this week by 239 contracts to a total net position of 18,924 contracts. The spec position has now improved for thirteen straight weeks and to a new high bullish level since June 13th 2017 when the net positions totaled 28,025 contracts.
This latest COT data is through Tuesday and shows a quick view of how large speculators or non-commercials (for-profit traders) as well as the commercial traders (hedgers & traders for business purposes) were positioned in the futures markets. All currency positions are in direct relation to the US dollar where, for example, a bet for the euro is a bet that the euro will rise versus the dollar while a bet against the euro will be a bet that the dollar will gain versus the euro.
Weekly Charts: Large Trader Weekly Positions vs Price
EuroFX:
Euro positions fell slightly this week following a sharp decline last week. The euro speculator sentiment continues to decrease and has fallen for ten out of the past eleven weeks after making a record high above +150,000 contracts in April.
British Pound Sterling:
British pound sterling positions edged slightly higher this week after declining for four weeks in a row (to the most bearish level since September of 2017). The GBP has now been in bearish territory for five straight weeks.
Japanese Yen:
Japanese yen positions dropped sharply this week and fell for a third straight week and for the fourth week out of the past five. The overall position level is at the most bearish since March 13th.
Swiss Franc:
Swiss franc positions declined this week and are down for three out of the past four weeks. The overall net position continues to be bearish above the -40,000 net contract level for a third straight week. The overall spec position has now been bearish for 50 straight weeks now dating back to August 2017.
Canadian Dollar:
Canadian dollar positions edged higher this week after falling for three weeks in a row. The overall net position has now been bearish for seventeen straight weeks and is above the -40,000 bearish level for a third week.
Australian Dollar:
Australian dollar bets edged slightly higher this week and have seen improvement for three out of the past four weeks. The overall net position remains in a bearish position for a sixteen straight week and above -40,000 net contracts for a second week.
New Zealand Dollar:
New Zealand dollar bets rose this week after four straight weeks of declines. The overall net position has now been bearish for five weeks and remains above the -20,000 net contract level for a third week.
Mexican Peso:
Mexican peso bets improved again this week for the third straight week. This week’s slight rise higher follows two strong weeks of gains. The overall position is back in bullish territory for a third consecutive week after MXN positions were heavily sold off prior to the recent presidential election.
*COT Report: The weekly commitment of traders report summarizes the total trader positions for open contracts in the futures trading markets. The CFTC categorizes trader positions according to commercial hedgers (traders who use futures contracts for hedging as part of the business), non-commercials (large traders who speculate to realize trading profits) and nonreportable traders (usually small traders/speculators). Find CFTC criteria here: (http://www.cftc.gov/MarketReports/CommitmentsofTraders/ExplanatoryNotes/index.htm).
The Commitment of Traders report is published every Friday by the Commodity Futures Trading Commission (CFTC) and shows futures positions data that was reported as of the previous Tuesday (3 days behind).
Each currency contract is a quote for that currency directly against the U.S. dollar, a net short amount of contracts means that more speculators are betting that currency to fall against the dollar and a net long position expect that currency to rise versus the dollar.
(The charts overlay the forex closing price of each Tuesday when COT trader positions are reported for each corresponding spot currency pair.) See more information and explanation on the weekly COT report from the CFTC website.
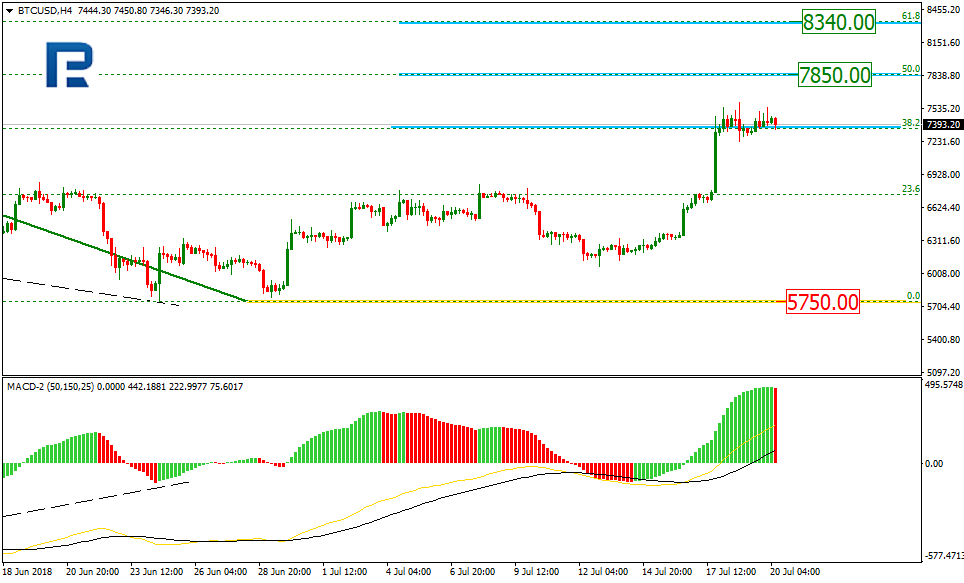
On H4, Bitcoin is continuing to form the correction uptrend. This correction reached 38.2% Fibo and may go ahead to reach 50.0, or $7,850, and 61.8%, or $8,340. The low at $5,750 acts as a support.
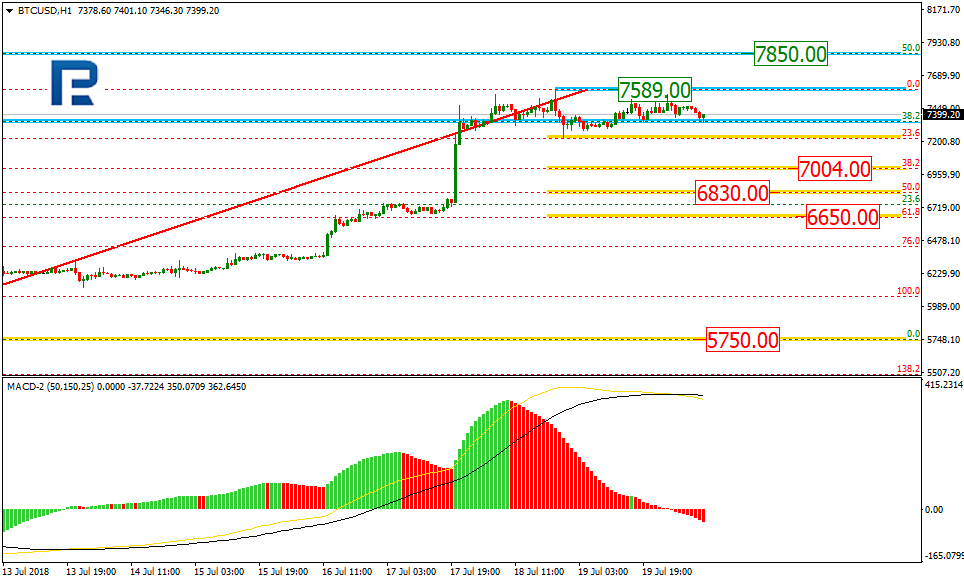
On H1, Bitcoin is correcting locally; once 23.6% Fibo is reached, the price may fall to 38.2% ($7,004), 50.0% ($6,830), and 61.8% ($6,650).
Ether
On H4, Ether is going down after reaching 23.6% Fibo. Currently, both the continuation of the uptrend and the pullback to the low followed by a breakout are possible. The uptrend targets may lie at 38.2% ($566.50) and 50.0% ($616.60). In case the low at $404.21 gets broken out, the price may go down to reach the post correctional extension at 138.2%-161.8% Fibo, or $362.20-$336.10.
On H1, Ether is experiencing downward correction, which reached 50.0% Fibo and may go ahead to reach 61.8, or $446.85, and 76.0%, or $431.15.
Attention! Forecasts presented in this section only reflect the author’s private opinion and should not be considered as guidance for trading. RoboForex LP bears no responsibility for trading results based on trading recommendations described in these analytical reviews.
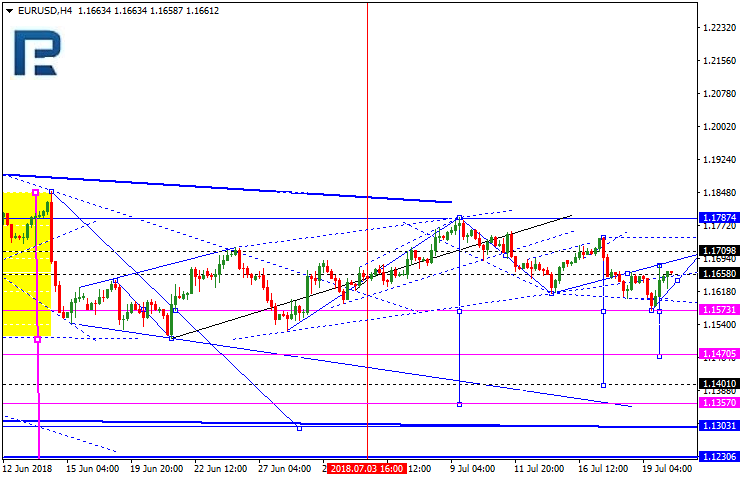
EUR/USD reached 1.1575 and has now entered a rising phase. This may lead to a correction towards 1.1700. However, any rise may only be considered as an alternative, while the major scenario is the price falling to 1.1470.
GBPUSD
The pound has reached its local downtrend target at 1.3000. Today, the pair is rising, which could mean a correction to 1.3111, and then a fall till 1.2886.
USDCHF
The USDCFH is still consolidating around 1.0000, while it could well fall to $0.9920. Any fall may only be considered as an alternative scenario involving correction, while the major scenario is the price rising to 1.0120.
USDJPY
The USDJPY completed its first falling phase, and today it corrected upwards to 112.80. Another possible downward movement has a local target at 111.50.
AUDUSD
The Aussie reached its local target and is correcting today, which may lead to a rise towards 0.7377. Then, however, the pair is likely to fall reaching its strategic target at 0.7285.
USDRUB
The pair is being pushed upwards, and 63.77 here is possible, followed by a fall to the consolidation range at 62.00. The major scenario now lies in the price breaking out the range and heading down to 60.00.
GOLD
The gold is forming a consolidation range based on its lows. Once the yellow metal goes above $1,228, it may start rising towards $1,242. Conversely, if the breakout is top down, $1,205 may be reached.
BRENT
Brent crude is trading within a consolidation range near $71.85; today, it may fall to $68.22, and then rise to $71.80. After that, the crude is likely to head down again, reaching $68.00. This is basically a 5-wave correction flag, which, when fully formed, may push the price higher to $82.00.
Attention! Forecasts presented in this section only reflect the author’s private opinion and should not be considered as guidance for trading. RoboForex LP bears no responsibility for trading results based on trading recommendations described in these analytical reviews.
On the EUR/USD currency pair, an ambiguous technical pattern has occured. The quotes are in a sideways trend. The trading instrument is testing local support and resistance levels: 1.16350 and 1.16750, respectively. Investors expect additional drivers. We recommend opening positions from the key levels.
The news feed on 2018.07.20:
Today, the publication of important economic reports from the US and the eurozone is not planned.
Indicators do not send accurate signals. The price has fixed between 50 MA and 200 MA.
The MACD histogram is located in the positive zone and above the signal line, which indicates the bullish sentiment on the EUR/USD currency pair.
Stochastic Oscillator is in the neutral zone, the %K line is below the %D line, which sends a signal to sell EUR/USD.
Trading recommendations
Support levels: 1.16350, 1.16100, 1.15850
Resistance levels: 1.16750, 1.17000, 1.17400
If the price fixes below 1.16350, EUR/USD is expected to fall. The movement is tending to 1.16100-1.15850.
Alternative option. If the price above fixes the resistance level of 1.16750, it is necessary to consider buying EUR/USD. The movement is tending to 1.17000-1.17400.
The GBP/USD currency pair
Technical indicators of the currency pair:
Prev Open: 1.30659
Open: 1.30131
% chg. over the last day: -0.36
Day’s range: 1.29949 – 1.30366
52 wk range: 1.2361 – 1.4345
Currently, GBP/USD is consolidating. The technical pattern is ambiguous. The key support and resistance levels are 1.30000 and 1.30400, respectively. Pressure on the pound is put by a weak report on retail sales in the UK. In June, retail sales in the country fell by 0.5%. Experts expected the growth rate of 0.1%. Positions must be opened from the key levels.
The news feed on the UK economy is calm.
Indicators point to the power of sellers. The price has fixed below 50 MA and 200 MA.
The MACD histogram is in the negative zone, but above the signal line, which gives a weak signal to sell GBP/USD.
Stochastic Oscillator is located in the neutral zone, the %K line is below the %D line, which also sends a signal to sell GBP/USD.
Trading recommendations
Support levels: 1.30000, 1.29600
Resistance levels: 1.30400, 1.30800, 1.31150
If the price falls below the round level of 1.30000, a further drop in GBP/USD is expected. The movement is tending to 1.29600-1.29500.
Alternative option. If the price fixes above 1.30400, it is necessary to consider buying GBP/USD. The movement is tending to 1.30750-1.31000.
The USD/CAD currency pair
Technical indicators of the currency pair:
Prev Open: 1.31654
Open: 1.32706
% chg. over the last day: +0.68
Day’s range: 1.32461 – 1.32897
52 wk range: 1.2059 – 1.3795
At the moment, the USD/CAD currency pair is consolidating near the monthly highs. A unidirectional trend is not observed. The key trading range is 1.32500-1.32800. In the near future, a technical correction is not ruled out. Investors are awaiting the publication of important economic reports from Canada. Positions must be opened from the key levels.
At 15:30 (GMT+3:00) data on inflation and retail sales in Canada will be published.
The price has fixed above 50 MA and 200 MA, which indicates the power of buyers.
The MACD histogram is in the positive zone, but below the signal line, which gives a weak signal to buy USD/CAD.
Stochastic Oscillator is located in the neutral zone, the %K line is above the %D line, which indicates the bullish sentiment.
Trading recommendations
Support levels: 1.32500, 1.32150, 1.31900
Resistance levels: 1.32800, 1.33250
If the price fixes below the support level of 1.32500, correction movement is expected. The movement is tending to 1.32150-1.32000.
If the price fixes above 1.32800, you need to look for entry points to the market to open long positions. The target movement level is 1.33000-1.33250.
The USD/JPY currency pair
Technical indicators of the currency pair:
Prev Open: 112.829
Open: 112.430
% chg. over the last day: -0.43
Day’s range: 112.208 – 112.622
52 wk range: 104.56 – 114.74
Yesterday, the bearish sentiment prevailed on the USD/JPY currency pair. The trading instrument updated local extremes. At the moment the quotations are consolidating in the range 112.200-112.550. Further correction of the USD/JPY quotes is expected. We recommend opening positions from the key support and resistance levels.
The news feed on the economy of Japan is calm.
Indicators do not send accurate signals. The price has fixed between 50 MA and 200 MA.
The MACD histogram is in the negative zone, but above the signal line, which gives a weak signal to sell USD/JPY.
Stochastic Oscillator is located in the neutral zone, the %K line is above the %D line, which indicates the growth of USD/JPY.
Trading recommendations
Support levels: 112.200, 111.850, 111.300
Resistance levels: 112.550, 113.100
If the price fixes below 112.200, further correction of the USD/JPY currency pair is expected. The movement is tending to 111.850-111.500.
Alternative option. If the price fixes above the 112.550 level, one should consider buying USD/JPY. The movement is tending to the round level of 113.000.
Over the past 4+ months, we’ve been working away trying to keep our readers aware of the risks and concerns that were originating out of some foreign markets and how that might relate to the US markets. We remember a point in time back in June or July 2017 when we, suddenly, started receiving emails and calls from moderately large Indian, Indonesian and other foreign development companies asking to schedule time for an “introduction call”. It is not unusual for us to receive cold calls from development firms looking for new projects, but at one point we were getting 2 to 3 calls a week.
The point behind what we are sharing is that sometimes the signs are right in front of you if you are paying attention to the messages. In this case, a number of things had recently transpired – the biggest of which was the recent US Presidential elections as well as a renewed US equities market and increased volatility in certain currency markets. We also believe the currency controls in India (near November 2016), as well as the Chinese cash restrictions imposed shortly before this, were also factors that played into the current outcome. Our opinion is that these dynamic factors in the global economy, as well as the fact that many government reporting/news agencies are slow to catch onto a dramatic shift in market sentiment, resulting in a latent and somewhat aggressive price rotation in the global markets.
Which brings us to January/February 2018 – when the US and Global markets tanked, unexpectedly, by nearly -13.5%. While many analysts throughout the globe were concerned this rotation could be the start of a much deeper and potentially catastrophic global market collapse, our proprietary predictive price modeling systems and analysis systems kept telling us the US markets climb out of this rut and attempt to rally to new highs. In some ways, we took a lot of flack from others calling for this type of market rally when everyone else was calling for a breakdown in price. Still, look at where the US markets are now in comparison to all of those short-sellers that were convinced the markets were going to tank?
Right now, there is a very interesting dynamic at play that may not last forever – and most of the industry analysts are starting to catch onto what we’ve been talking about for months. That fact is that capital is very fluid and will migrate to the healthiest and most suitable investment environment possible when the environment where this capital currently resides is unfavorable or deteriorating. As we learned in the movie “Wall Street” – “Greed, for lack of a better word, is good” (Gordon Gekko: 1987 “Wall Street”). In our interpretation, Greed is the essence of the survival of capital in different market environments. Greed and Fear are two very similar emotions and they both, at times, are very good to have in measured levels. Both of these emotions drive capital into and out of markets as a natural occurrence of the global markets.
This dynamic, the capital migration that has been taking place for approximately 12+ months, may come to an end at some point in the near future and we have to be prepared for it. If we think about this scenario, what would cause this capital migration to subside or end and change dynamics? We can think of two scenarios that would be likely to play out to result in this transition :
Emerging markets stabilize, forming near-term bottoms and establishing some optimism regarding opportunities for upside price advances. This, in our opinion, may be enough of a catalyst for capital to move back into these markets in an attempt to capture returns with diminished risk factors – resulting in GREED outweighing FEAR.
Something decreases the US and major global market standing in terms of currency strengths and global market dominance. In this case, we believe some massive credit or debt risk factor would have to occur that greatly decreases the capabilities of the mature global markets (US, UK, Canada, Japan & Europe). Should something like this happen, where the biggest and most stable markets on the planet are diminished, then capital may aggressively move away from these markets and into any other market that may appear to benefit from these diminished expectations.
Until either of these things happen, we believe continued pricing pressure will exist in China/Asia, the BRICs markets and, to some degrees, in the European Union markets.
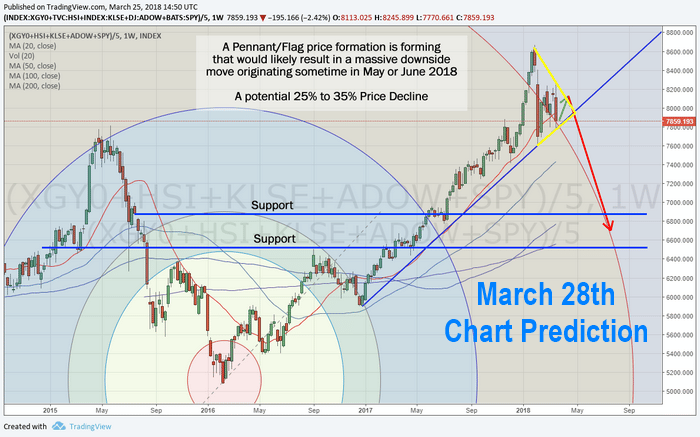
TAKE A LOOK AT OUR PREVIOUS FORECAST ON MARCH 28TH
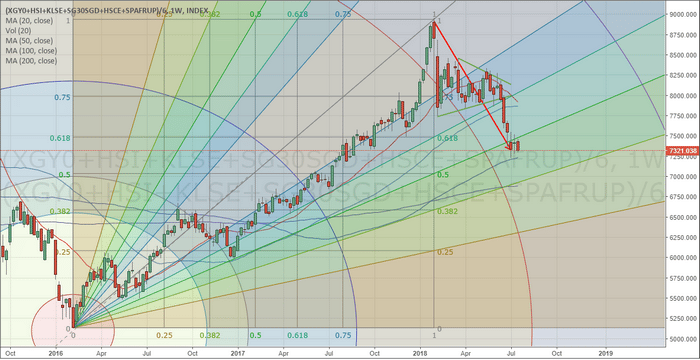
Now, let’s start off by checking this Weekly chart of our China/Asia custom index and where it is today. One can clearly see the pennant/flag formation (the Green lines) that originated in early 2018. This pennant formation recently broke out to the downside and has already fallen nearly half way to our downside target which is incredible.
The current downside move aligns with a 38.2% retracement from the highs and we believe this move could be just starting. In other words, we believe a full 50%, or more, a pullback from these highs could be in the works if the data originating from China/Asia recently is correct. The entire region of China and SE Asia is open to interpretation and legal issues with little certainty about anything.
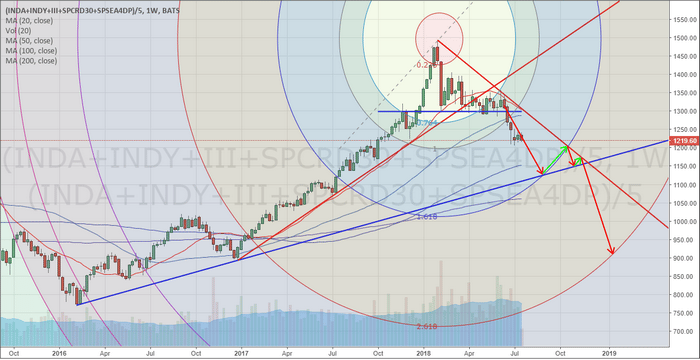
This next Weekly BRICs chart shows a similar pattern. A sideways pennant formation originating in early 2018 that broke out to the downside. A clear breach of price support and a more than -38.2% price drop so far. Our Blue price support line, originating from 2016/2017 lows, shows us that critical support is currently about -11% lower than the current price. You can see from our drawn arrows that we believe this level will create price support and price will rotate well into the end of 2018 before breakout out of this new pennant formation and moving dramatically lower. Right now, time will tell how this plays out 5+ months into the future, but at this time, unless the global market dynamics change dramatically, this is what we believe is the most likely future outcome.
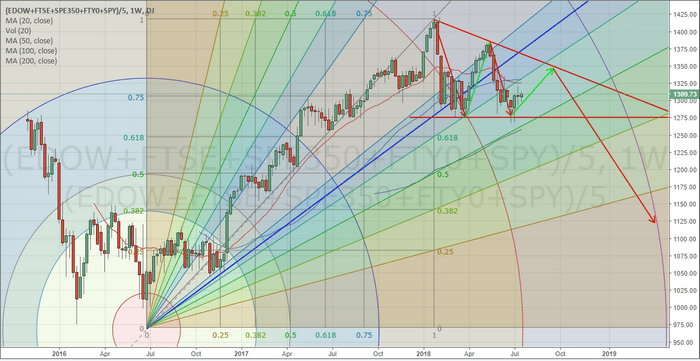
Lastly, this is the Weekly European Custom Index that shows, yet again, a somewhat similar pattern without the recent price breakdown. Originating in early 2018, a deep price rotation has created a very clear price rotational cycle. This rotation is forming a very clear pennant formation, again, and we believe the final outcome, at this point, will be a breakdown of price in the European markets as the Brexit and other regional economic and political issues continue to play out. As a word of warning, our last Red arrow (drawn on this chart) does not point to a target price level – it is just indicating that we believe a breakdown in price is the likely outcome.
If we were to add a simple Elliot Wave count to this in an attempt to isolate potential future moves, our estimate (with limited data) would be that we are in the midst of a Wave D correction. In other words, this is a corrective price trend “in an uptrend”. The move lower, as we are predicting, may not drop below the 50% retracement levels shown on this chart before finding support and attempting to start a new upside price move.
Pay attention to the global market news and the news of certainty or uncertainty originating from the global economies. Capital is “Greed and Fear and work every day”. Capital will always attempt to exit hostile or dangerous economic environments and find a more suitable environment for growth and stability. As the continued global market turmoil continues to unfold, understand that Trillions of dollars will be sourcing the safest and best returns on the planet. As these dynamics play out, there are tremendous opportunities for traders and investors to follow the cash and ride the waves. There may, certainly, be some wild rotations and waves as this capital moves around, but the longer term trends that should establish as this capital moves around should be substantial. Get ready for some excellent trading opportunities over the next 12 to 24 months.
Our exclusive member service provides detailed market research, daily market video analysis, detailed trading signals and much more to assist you in developing better skills and greater success in your trading. One of our most recent trades is already up over 12%, we already took some partial profits, and we believe much higher share prices is just around the corner. We urge you to visit TheTechnicalTraders.com to learn how we can assist you in finding new success.
53 years experience in researching and trading makes analyzing the complex and ever-changing financial markets a natural process. We have a simple and highly effective way to provide our customers with the most convenient, accurate, and timely market forecasts available today. Our stock and ETF trading alerts are readily available through our exclusive membership service via email and SMS text. Our newsletter, Technical Trading Mastery book, and 3 Hour Trading Video Course are designed for both traders and investors. Also, some of our strategies have been fully automated for the ultimate trading experience.
Get our advanced research and market reporting, Daily market videos, detailed trading signals and join the hundreds of other traders that follow our research every day and profit.
The US currency continued to rise against the basket of major currencies after Powell’s, the head of the Fed, positive statements. The US dollar index (#DX) updated the monthly highs and closed in the positive zone (+0.18%). However, the trade war remains the focus of attention. Representatives of the US White House believe that Xi Jinping, President of the People’s Republic of China, obstructs negotiations and the achievement of agreements between the countries. At the same time, the EU intends to introduce duties in return on the import of automobiles to the US from Europe. On July 25 representatives from the European Union are going to visit Washington, where, most likely, the situation will be clarified.
The US dollar is also supported by the index of manufacturing activity from the Federal Reserve Bank for July, published yesterday, which counted to 25.7 and was above the forecasted value of 21.6. Also yesterday, data on the volume of retail sales in the UK for June were published: the indicator dropped to -0.5%, while experts expected +0.1%. Today we expect important statistics from Canada.
The “black gold” prices are moderately growing. At the moment, futures for the WTI crude oil are testing a mark of $68.35 per barrel.
Market Indicators
Yesterday, sales were observed on the US stock market: #SPY (-0.38%), #DIA (-0.49%), #QQQ (-0.50%).
At the moment, the yield of 10-year US government bonds is at the level of 2.84-2.85%.
The news feed on 2018.07.20:
– Reports on inflation and retail sales in Canada at 15:30 (GMT+3:00).
Yesterday evening, US President Donald Trump took aim at the Federal Reserve regarding its monetary policy. Trump revealed that he wasn’t thrilled with the pace of interest rate hikes as it may hinder the country’s economic growth. The Fed has already raised interest rates twice this year, with the key rate currently at 1.75 – 2%. The regulator is expected to raise rates again once or twice this year.
Today’s European and US sessions will pass without any major statistical releases. CAD traders should look out for Canadian retail sales data for May, as well as inflation data for June. These reports will both be published at 15:30 (GMT+3) today. I think that these releases have the potential to cause some serious intraday volatility on the Canadian dollar.
EURUSD:
Over the last 24 hours, the EURUSD pair has risen by around 25 pips; from 1.1641 to 1.1666. Although the euro dropped to 1.1575 against the dollar ahead of yesterday’s US session, it managed to recover its losses by the evening and return to 1.1641 on the back on Trump’s remarks.
Moving on to the chart, we can see that the potential downtrend on the EURUSD hourly timeframe is still alive and well:
We can see on the chart how the euro rebounded from the resistance line towards the trend line following Trump’s speech. I reckon that the EURUSD pair will remain within the downwards channel for the rest of the day.
I’d refrain from trading the EURUSD pair on the hourly timeframe today, because despite the downtrend, there’s no clear sell signal. What we’re currently seeing on the hourly timeframe is a correction.
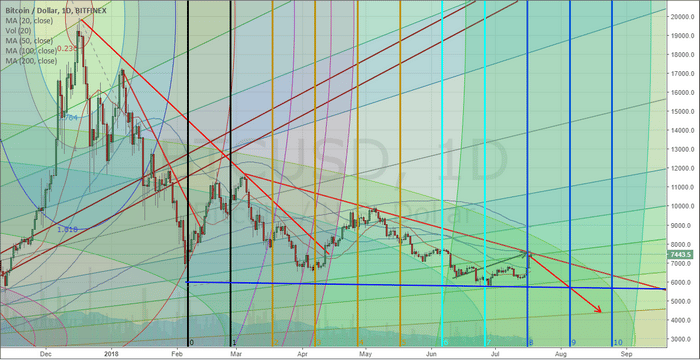
Even we were concerned with Bitcoin briefly traded below $6k in late June. Yet, the recent upside price move was incredibly quick and the price of Bitcoin ran right up to our upper price channel. We believe this will become a new price peak over the next few days/weeks where the price of Bitcoin should continue to drop from these levels near $7500. We know there are many Bitcoin investors that want to hear us state that it should continue to push higher, but there are other factors at play here that may limit this movement.
The price channels that are currently constraining the price of Bitcoin originate back in February and March of 2018. The low and high price rotation within these months start the points of interest for our research team. From these points, we have continued to identify key price levels that appear to contain breakouts.
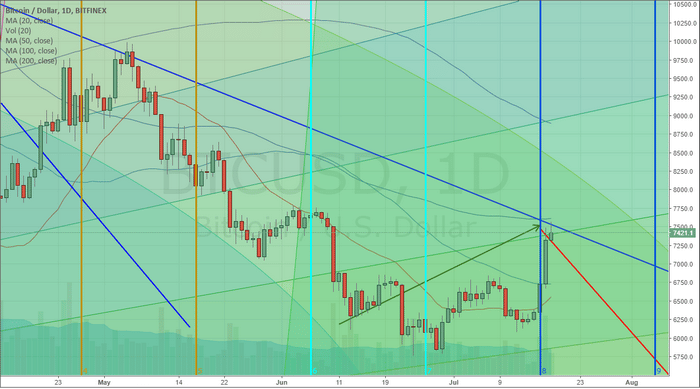
You can see from the chart below, the upper BLUE channel line is our downward sloping price channel that is acting like an upper ceiling for the price. Additionally, you can see our “drawn Red and Green arrows” showing what we believed Bitcoin would potentially do over the next few months. We believed that Bitcoin, as it traded lower, towards $6k, may find support and rally (based on our time/price cycles) towards a peak near July 16 (showing as the end of the Green Arrow). From this point, we believe the price of Bitcoin will trail off, heading lower, with the intent to retest channel support near $5700 if the price cannot break through and hold above the blue upper channel.
This longer-term daily Bitcoin chart shows a larger picture of our analysis work. You can clearly see the channels that are constraining price at the moment – the BLUE support channel and the RED resistance channel. The most recent lows established a new lower price point for the Blue channel – which indicated a downward sloping pennant formation is in place.
There are two things we want to caution Bitcoin investors and traders about. First, the rotation that we are expecting to complete this pennant formation could happen very quickly within a fairly tight range ($7400 to $5700). For traders, this is an excellent range for some quick profits. For investors, this could create some stress as price rotates.
Second, by our estimates, at least one more low price rotation is required before any real breakout will be attempted. If our analysis is correct, this current price peak will end with prices falling back below $6k, forming another “lower bottom” and rallying again to near the upper price channel (near $6700 or so) before trailing off for the last time – nearing the apex of the pennant formation. We believe the current outcome of this price setup will be a low price breakout, forming a potential wave 5 that should end near or below $5500. After that bottom is reached, we should be looking for a new bottom formation setting up a new advancement leg higher.
Could our analysis change, of course, it could depending on what price action shows us. Right now, this pennant formation and the wave counts are driving our analysis. The Time/price cycle analysis helps us to determine when and where price target/peaks/troughs may happen, but they are not set in stone. If you are a trader and are long Bitcoin, this may be the highest price you will see over the next few months. If you are an investor and think this is the start of a bigger move higher – we don’t agree with you. We believe we are very close to the final leg lower that should form the new price bottom – at least for a while. Once this bottom forms, we’ll be able to provide a better understanding of what we believe will happen in the future. For right now, our target low for the bottom is $4400 on or near August 20, 2018. We’ll see how it plays out.
We keep a close eye using our proprietary ADL Fibonacci and ADL Cycle forecasting systems using the Bitcoin investment trust which trades like a stock/ETF, the symbol is: GBTC.
If you want to learn how we can help you stay ahead of these global market moves and help you plan for and execute greater trades, please visit TheTechnicalTraders.com to learn how we assist you. We offer comprehensive research, analysis, daily video, trading signals and much more to our valued subscribers. We also offer access to our specialized proprietary price modeling systems that have proven to be timely and accurate.