On H4, the gold is forming reversal patterns, such as hammer, inverted hammer, and harami, after reaching the support. By analyzing the previous moves, one can assume the metal may bounce off and start forming a new uptrend after such a correction.
NZDUSD
On H4, the NZDUSD is still forming an uptrend. Currently, the price is correcting and forming such reversal patterns as hammer and inverted hammer. By analyzing the previous moves, one can assume this is a correction before the ascending move continuation.
Attention! Forecasts presented in this section only reflect the author’s private opinion and should not be considered as guidance for trading. RoboForex LP bears no responsibility for trading results based on trading recommendations described in these analytical reviews.
On H4, 2/8 breakout may lead to the AUD/USD price rising till 3/8.
On H1, the pair is trading within a consolidation range between 3/8 and 5/8. Now, once 3/8 gets broken out, the price may fall further to reach the support at 0/8. Once 5/8 gets broken out, the price may start moving higher to reach the resistance at 8/8.
NZD/USD
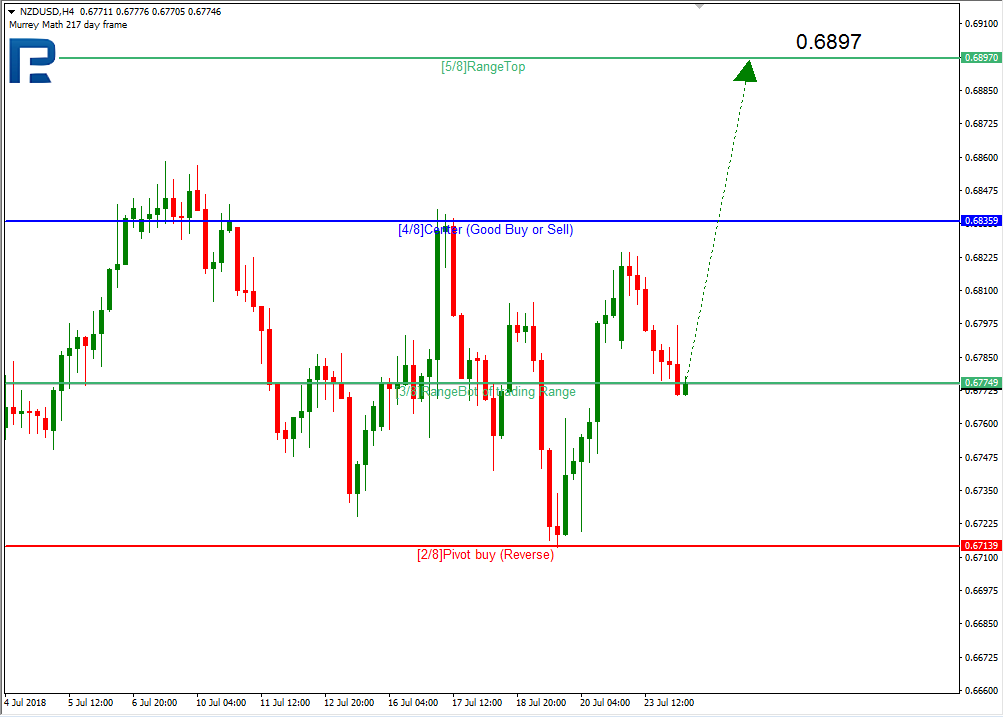
On H4, the NZD/USD is trading within a consolidation range. Once the price bounces off 3/8, it may rise further to reach the resistance at 5/8.
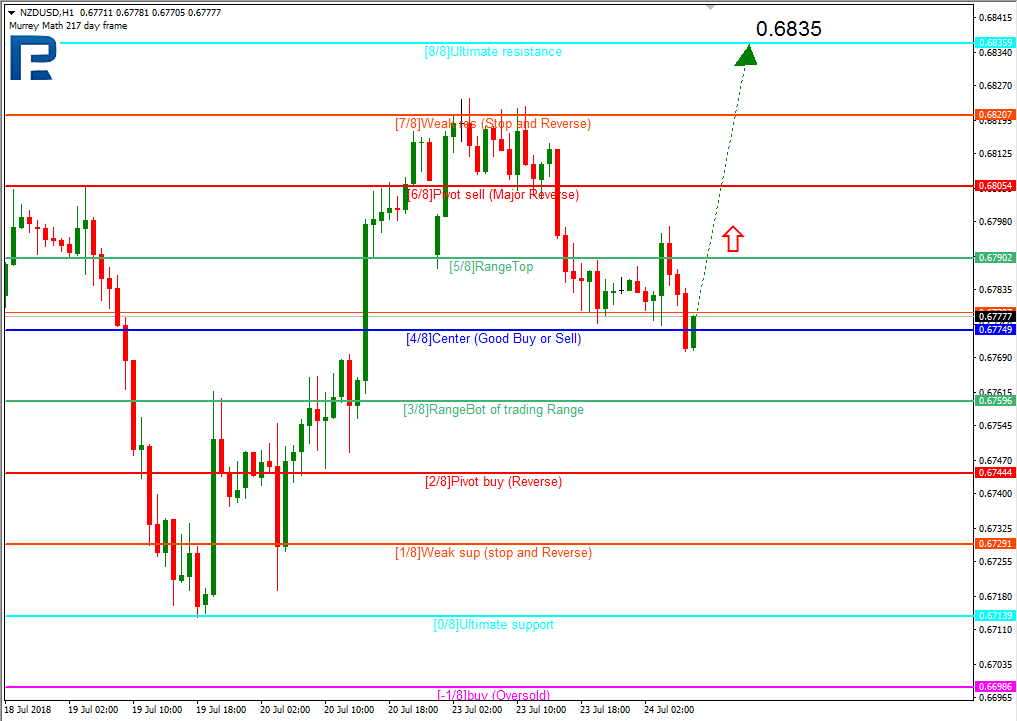
On H1, the price is inside a consolidation range; however, 5/8 breakout is likely, which may lead to the price heading further up towards 8/8.
Attention! Forecasts presented in this section only reflect the author’s private opinion and should not be considered as guidance for trading. RoboForex LP bears no responsibility for trading results based on trading recommendations described in these analytical reviews.
Over the last 24 hours, the EURUSD pair has seen a 40-pip correction; from 1.1717 to 1.1677. I’d like to note that yesterday there was no important macroeconomic data, nor any important economic events that could significantly affect major currency pairs. I’m assuming that financial participants will take a wait-and-see position before the ECB monetary policy meeting on Thursday, the 26th of July. Therefore, I do not expect any radical changes in major currency pairs in the next two days.
Today, very useful Forex trading indicators will be published for the eurozone, UK, and US.
On the hourly timeframe (H1), the EURUSD pair is attempting to return to the potential downwards trend.
I believe sentiment on the EURUSD pair is bearish (H1), and although it has weakened, it still persists. This is evidenced by the fact that the last high (“Max 2” on the chart) could not reach the previous high (“Max 1” on the chart). Therefore, I reckon that the pressure on the euro from the dollar will continue. Even if the euro suddently starts to rise against the dollar, I believe that the solid level of resistance for the EURUSD pair will be the 1.1824 mark, as I mentioned yesterday.
Yesterday, the 23rd of July, deputy governor of monetary policy at the Bank of England Ben Broadbent said that if the Monetary Policy Committee (MPC) starts to normalise its balance sheet – which has increased as a result of quantitative easing – and inflationary pressure eases, the first call of order would be to lower interest rates rather than stop the process of tapering the balance sheet.
Speaking at a meeting of the Society of Professional Economists in London, Mr. Broadbent shed some light on the MPC’s procedure for normalising the central bank’s balance sheet. He reckons that the BoE will start selling off the assets purchased as part of the QE program once the key rate reaches 1.5%, rather than 2.0% as had been the previous target. He also said that the MPC is keeping a close eye on the US Federal Reserve’s quantitative tightening initiative and that the Bank of England will draw on that experience.
As such, we can conclude that when the BoE starts its quantitative tightening process, if economic growth slows down and/or inflationary pressure subsides, the regulator will keep this process going and lower interest rates.
Having a goal to attract potential clients, Forex brokers often provide opportunities to take advantage of different bonuses. Frequently, traders don’t miss this chance to get some extra profits and make money with almost no investments. Formally, there are such types of Forex bonuses: no deposit bonuses, deposit bonuses and welcome bonuses.
What is the difference between these bonuses?
Welcome bonuses
Starting working with a certain broker, trader can get a so-called welcome bonus.
Usually, this bonus is provided to a trader when he opens an account with this broker. The company chooses the conditions under which a client can get his bonus. Some of Forex brokers give an opportunity to get a deposit welcome bonus. It’s charged when a client makes his first deposit. The sum depends on the chosen company.
Sometimes, traders are given a no deposit welcome bonus when there is no need to deposit the account to get a bonus. This is a huge advantage for the newbies as they can use this experience in the future trades with own deposits.
Deposit Bonuses
Deposit bonus is another group of Forex bonuses allowing a trader to get an additional profit if he decided to deposit the account. This bonus may be used or not used as the extra margin by a client depending on the broker’s conditions. The trader decides by himself whether this option is profitable or not for him at the moment. By the way, it’s a perfect solution for a trader who is going to invest anyway.
Here is a great solution for traders who want to get a (JustForex) 100% deposit bonus.
No Deposit Bonuses
No deposit bonus is considered to be the most popular group of bonuses among Forex traders. There is no need to fund the trading account as you can get the bonus for free, so-called “free bonus without deposit”. Some Forex brokers set a condition when the benefit can be used as an additional margin only and can be withdrawn. Nevertheless, this bonus is also very popular among traders as it allows to make money without a deposit.
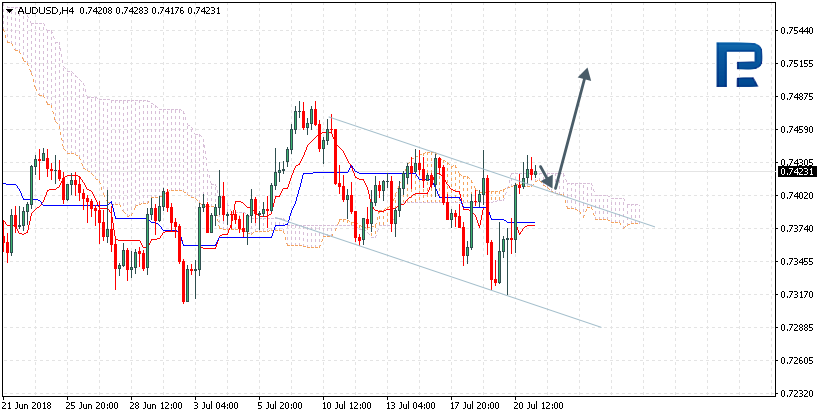
The AUD/USD is trading at 0.7423, above the Ichimoku cloud, which means there’s an uptrend forming. We expect a test of the upper cloud boundary at 0.7405, and then a rise to 0.7515 and above, which will be confirmed with the price bouncing off the lower boundary of the descending channel. This rise may be prevented in case price breaks out the lower boundary of the Ichimoku cloud and closes below 0.7375, which will be a signal for a further fall to 0.7320 and below.
NZD/USD
The NZD/USD is trading at 0.6814, above the Ichimoku cloud, which means there’s an uptrend forming. We expect a test of the upper cloud boundary at 0.6790, and then a rise to 0.6885 and above, which may be confirmed with the price bouncing off the support. This rise may be prevented in case price breaks out the lower boundary and closes below 0.6755, which will be a signal for a further fall to 0.6700 and below. The rise will get confirmed once the upper boundary of the descending channel is broken out and the price closes above 0.6840.
USD/CAD
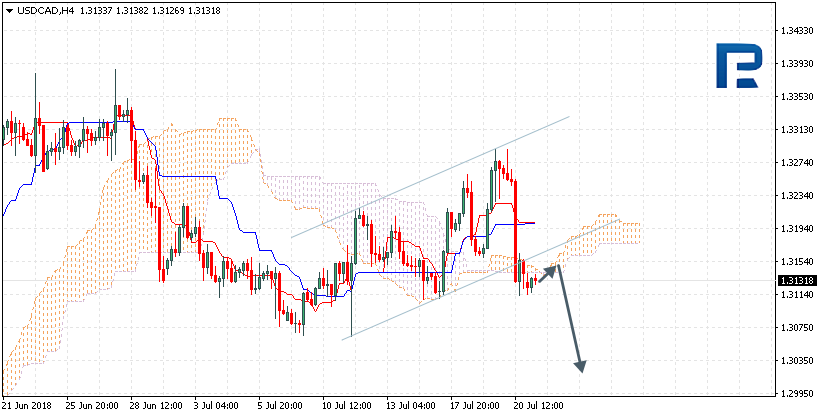
The USD/CAD is trading at 1.3131, below the Ichimoku cloud, which means there’s a downtrend forming. We expect a test of the lower cloud boundary at 1.3140, and then a downward pullback to 1.3035. The price bouncing off the lower boundary of the ascending channel signals a potential downward movement. This fall may be prevented in case price breaks out the upper boundary and closes above 1.3195, which will be a signal for a further rise to 1.3310 and above.
Attention! Forecasts presented in this section only reflect the author’s private opinion and should not be considered as guidance for trading. RoboForex LP bears no responsibility for trading results based on trading recommendations described in these analytical reviews.
The last week has been good for bitcoin. From the 16th to 22nd of July, the value of BTCUSD rose by 16.6% to hit 7,406 USD on the Bitmex exchange. Last week’s high point was 7,715 USD. There was a high level of market activity observed on the 16th and 17th of July.
On the 16th of July, bulls broke the horizontal resistance at 6,400 USD, pushing on through to 6,750 USD (consolidation zone from 8-9th July). After a 24-hour flat, they successfully broke the resistance at 6,850 USD (formed from the highs from the 4th, 8th, and 9th of July). In one swift movement, BTC prices jumped to 7,470 USD.
The main reason for this short squeeze may have been the cashing out on short positions on the Bitmex exchange, which in turn triggered a chain reaction of protective stop levels while pushing the price up past the psychological 7,000 USD barrier. Trading volume at 17:00 UTC was 802m USD, including 496m USD in market orders.
Buyers came into play after the breakout of this technical level, believing they could induce another rally on the back of all the positive crypto-market news that had come out earlier.
On Friday the 20th of July, during the US session, tried to rekindle the rally, but were met with resistance at 7,715 USD. They stopped at a wall of limit orders and were unable to push higher. From here, BTC shed 6.5% to trade at 7,209 USD.
The only bit of news that might have increased speculative activity during the evening was the launch of Coinbase Prime; a service for institutional investors. News of this came out on the 19th of July, so it’s impossible to be certain that this was the trigger for bitcoin’s rise against the dollar.
Bitcoin this week
At the time of writing this review, BTC futures on the Bitmex exchange are trading at 7,726 USD. The BTCUSD pair has been trading within a range of 7,209 – 7,778 USD for nearly 48 hours. Whichever direction in which the price exits this range should determine its movement for at least the next couple of days. Given the manipulation that takes place on exchanges, the price could trigger the stops on both sides of the range after the breakout before returning to 7,500 USD.
Following its drop from 7,715 USD to 7,209 USD, bitcoin has recovered by 50%. It stopped at the resistance formed from the lows of 7,230 USD and 7,349 USD. We at Alpari believe that this growth phase will last until the 1st of August, after which we will enter a decline until the 23rd of August. It’s highly likely that 8,000 USD will be tested before the 1st of August.
The market should set a trading range of 5,743 – 8,000 USD to prepare buyers for a rally by the end of September. This is a rough timeframe, and things could change depending on pricing models.
The EUR/USD broke out 1.1685 and stayed above, which lead to another rising impulse, but can enter the correction phase today, with the target at 1.1680. Afterwards, another downward move to the same 1.1795 may occur. Any rise may only be considered as an alternative scenario involving correction, while the major scenario is the price falling to 1.1470. This is a local target.
GBPUSD
The GBP/USD was able to find the second rising impulse, which can correct today with the target at 1.3070. Afterwards, another upward move to 1.3180 may occur, and then the pair is likely to head down again, reaching 1.2888. This is a local target.
USDCHF
The pair has reached its correction target after rising. Today, the price may fall to 0.9973, and then further plunge to 0.9880. After that, it may rise back to 1.0120 again. This is a local target.
USDJPY
The USDJPY completed its second falling phase, and today it can correct upwards to 111.730. Another possible downward movement has its first target at 110.10.
AUDUSD
The AUD/USD was able to find the second rising impulse. Today, it may fall to 0.7390. Afterwards, another downward move to 0.7474 may occur, and then a downtrend movement is expected, with the target at 0.7285.
USDRUB
The pair is being pushed upwards, and 63.77 here is possible, followed by a fall to the consolidation range at 62.00. The major scenario now lies in the price breaking out the range and heading down to 60.00.
GOLD
The gold found its second rising impulse, while today it may fall to 1,225. After that, it may rise back to $1,240 again, and then a fall till 1,220.
BRENT
Brent crude is trading within a consolidation range near $73.85, while today it may fall to $69.88, and then rise to $71.80. After that, the crude is likely to head down again, reaching $68.20. This is a local target. This is basically a 5-wave correction flag, which, when fully formed, may push the price higher to $82.00.
Attention! Forecasts presented in this section only reflect the author’s private opinion and should not be considered as guidance for trading. RoboForex LP bears no responsibility for trading results based on trading recommendations described in these analytical reviews.
On Friday, aggressive purchases were observed on the EUR/USD currency pair. The US currency went down after the bold statements by Donald Trump. The growth of quotations exceeded 100 points. At the moment, the key levels of support and resistance are: 1.17100 and 1.17500 respectively. We recommend opening positions from these marks. The further growth of the trading instrument is not excluded.
The news feed on 2018.07.23:
– Existing home sales in the US at 17:00 (GMT+3:00).
Indicators point to the power of buyers: the price has fixed above 50 MA and 200 MA.
The MACD histogram is located in the positive zone, but below the signal line, which gives a weak signal to buy EUR/USD.
Stochastic Oscillator is in the oversold zone, the %K line is above the %D line, which also indicates the growth of the EUR/USD currency pair.
Trading recommendations
Support levels: 1.17100, 1.16700, 1.16300
Resistance levels: 1.17500, 1.18000
If the price fixes below 1.17100, the EUR/USD correction is expected. The movement is tending to 1.16700-1.16500.
Alternative option. If the price fixes above the resistance level of 1.17500, it is necessary to consider buying EUR/USD. The movement is tending to the round level of 1.18000.
The GBP/USD currency pair
Technical indicators of the currency pair:
Prev Open: 1.30131
Open: 1.31136
% chg. over the last day: +0.92
Day’s range: 1.31135 – 1.31311
52 wk range: 1.2361 – 1.4345
On Friday, aggressive purchases were observed on the GBP/USD currency pair. The growth of quotations exceeded 110 points. At the moment, the trading instrument is in a sideways trend. The key support and resistance levels are: 1.31200 and 1.31700, respectively. Positions must be opened from the key levels. The further growth of quotations is not excluded.
The news feed on the UK economy is calm.
Indicators do not send accurate signals: the price is testing 200 MA.
The MACD histogram is in the positive zone, but below the signal line, which gives a weak signal to buy GBP/USD.
Stochastic Oscillator is located in the neutral zone, the %K line is above the %D line, which also gives a signal to buy GBP/USD.
Trading recommendations
Support levels: 1.31200, 1.30700, 1.30200
Resistance levels: 1.31700, 1.32200, 1.32700
If the price falls below the 1.31200 level, the GBP/USD quotes correction is expected. The potential for movement to 1.30700-1.30500.
Alternative option. If the price fixes above 1.31700, it is necessary to consider buying GBP/USD. The movement is tending to 1.32200-1.32500.
The USD/CAD currency pair
Technical indicators of the currency pair:
Prev Open: 1.32706
Open: 1.31273
% chg. over the last day: -0.90
Day’s range: 1.31321 – 1.31421
52 wk range: 1.2059 – 1.3795
On Friday, aggressive sales were observed on the USD/CAD currecny pair. The decrease in quotations exceeded 150 points. Last week, a number of economic reports were published in Canada. The core consumer price index in June was 0.1%. The core retail sales index rose to 1.4% and was above the forecasted value of 0.7%. At the moment, the quotes are in a sideways trend. The key trading range is 1.31200-1.31500. In the near future, a technical correction is not ruled out. Positions need to be opened from the key levels of support and resistance.
Important news from Canada is not expected today.
The price has fixed below 50 MA and 200 MA, which indicates the power of sellers.
The MACD histogram is in the negative zone, but above the signal line, which gives a weak signal to sell USD/CAD.
Stochastic Oscillator is leaving the overbought zone, the %K line is below the %D line, which indicates the bearish sentiment.
Trading recommendations
Support levels: 1.31200, 1.30800
Resistance levels: 1.31500, 1.31900, 1.32300
If the price fixes below the support level of 1.31200, further reduction of the currency pair is expected. The movement is tending to 1.30800-1.30600.
If the price fixes above the level of 1.31500, you need to look for entry points to the market to open long positions. The target movement level is 1.31900-1.32100.
The USD/JPY currency pair
Technical indicators of the currency pair:
Prev Open: 112.430
Open: 111.371
% chg. over the last day: -0.94
Day’s range: 110.913 – 110.973
52 wk range: 104.56 – 114.74
On Friday, the USD/JPY quotes dropped significantly. The decrease in the currency pair exceeded 150 points. At the moment the quotes are consolidating in the range of 110.800-111.150. In the near future, a technical correction is not ruled out. We recommend opening positions from the key support and resistance levels. It is also necessary to pay attention to the yield of US 10-year government bonds.
The news feed on the economy of Japan is calm.
The price has fixed below 50 MA and 200 MA, which indicates the power of buyers.
The MACD histogram is in the negative zone, but above the signal line, which gives a weak signal to sell USD/JPY.
Stochastic Oscillator is located in the neutral zone, the %K line has crossed the %D line. There are no accurate signals.
Trading recommendations
Support levels: 110.800, 110.400
Resistance levels: 111.150, 111.500, 111.900
If the price fixes below the 110.800 level, further decrease of the USD/JPY currency pair is expected. The movement is tending to 110.400-110.200.
Alternative option. If the price fixes above the level of 111.150, it is necessary to consider buying USD/JPY. The movement is tending to 111.500-111.700.
Last week, the US dollar started declining against the basket of major currencies. On Friday, US President Donald Trump said in an interview with CNBC that he was ready to impose additional duties on imports of Chinese goods in the amount of $500 billion a year. Also, the US president expressed dissatisfaction with the Fed’s monetary policy, noting that the central bank’s plans to raise interest rates hamper the strengthening of the US economy. The US dollar index (#DX) finished the week with a significant decrease (-0.75%).
On Friday, a number of economic reports were also published in Canada. The core consumer price index in June was 0.1%. The core retail sales index rose to 1.4% and was above the forecasted value of 0.7%. This week, investors are waiting for a decision on the interest rate by ECB, which will be made on Thursday, July 26.
The “black gold” prices are consolidating. At the moment, futures for the WTI crude oil are testing the mark of $68.00 per barrel.
Market Indicators
On Friday, sales were observed on the US stock market: #SPY (-0.11%), #DIA (-0.14%), #QQQ (-0.02%).
At the moment, the yield of 10-year US government bonds is at the level of 2.88-2.89%.
The news feed on 2018.07.23:
– Existing home sales in the US at 17:00 (GMT+3:00).