On Friday the 27th of July, trading on the dollar closed in negative territory. It has fallen in price all over the market, having lost all the positions earned during the European session. Sales followed after the publication of US GDP data for Q2.
The data coincided with the forecast, so buyers began to close long positions on the dollar before the weekend. The “buy the rumour – sell the fact” principle has worked.
I believe that after the release of a strong report, the Fed will continue to gradually raise rates to keep the economy from overheating.
Fig. 1 Dynamics of the dollar on Friday
By the end of the week, almost all major currencies showed a decline. The largest decline in relation to the US dollar was shown by the euro (-0.56%). Then came the New Zealand dollar (-0.24%), the Australian dollar (-0.22%), the Swiss franc (-0.15%), and the British pound (-0.15%). Both the Canadian dollar (0.65%) and the Japanese yen (0.41%) strengthened.
Fig. 2 Dynamics of the dollar for the week
US data:
The preliminary value of the US GDP for the Q2 2018 was 4.1% (forecast: 4.1%, previous: 2.2%).
The final value of the MCSI for July was 97.9 (forecast: 97.1, preliminary value: 97.1).
Day’s news (GMT+3):
10:00 Switzerland: KOF leading indicator (Jul).
11:30 UK: net lending to individuals (MoM) (Jun), consumer credit (Jun), mortgage approvals (Jun).
During my two-week holiday, the euro fell 28 points. It can be said that nothing has changed during my absence, so I will not waste time getting acquainted with previously published data and news.
In two weeks, a sideways trend was formed with a range of 0.93% or 109 pips. The middle of the range is at 1.1682. For today, it will act as the target level for euro bulls.
All the news items mentioned above will not have a strong impact on the Forex market, so I did not take them into account in my forecast today.
We are following the dynamics of US bond yields. There is a risk that 10-year bonds will fall from 2.96% to 2.94%, which will weaken the US dollar and strengthen the euro. Crosses on the euro are trading in positive territory, therefore, in light of the drop in US10Y yields, the euro could rise against the dollar to the upper border of the corridor (1.1755).
The key events of this week will be: the indices of business activity in China, the Eurozone, the United Kingdom, and the United States, the rate decisions of the Bank of Japan, the US Federal Reserve, and the Bank of England, and the US labor market (NFP) report for July.
In the last few years, cloud storage has burst onto the tech scene as the panacea solution for data storage. No longer do you have to keep expensive hardware on your premises for your increasingly gigabyte-consuming software. Nowadays you can stick all this ever-growing data up in the cloud.
Indeed, it sounds like the equivalent of throwing landfill off the face of the planet to fix environmental degradation. However, the reality is that data infrastructure is not where it needs to be to ensure the wild success of cloud storage.
A Clouded History
The benefit of storing data in a defined physical place is that it’s much easier to contain and secure. Once you put data in the cloud it becomes automatically vulnerable to hackers and data breaches. To date, there has been a torrent of incidents. Microsoft was one of the first to be breached, when in 2010 employee information was hacked, a disturbing harbinger of things to come. In 2012 Dropbox had more than 68 million user accounts hacked and close to 5 gigabytes of data stolen. That same year LinkedIn felt the sting of cybercriminals when 6 million user passwords were appropriated and then published on a Russian forum. Then again in May 2016, hackers stole and attempted to sell onwards the details of an estimated 167 million LinkedIn user accounts. As recently as 2017, Apple iCloud experienced what may be considered the most extensive high profile cloud security breach, when several celebrities had their private photos leaked online.
Not just restricted to the online world, security breaches can potentially have a damaging impact on the real world. In 2016, the National Electoral Institute of Mexico had over 93 million voter registration records compromised. The majority of the records were lost due to the poorly configured database which made confidential information publicly available. This situation was not resolved, with the potential threat to destabilizing national democratic foundations going unnoticed.
However, the company that holds the title for the largest breach of cloud security in history is tech titan Yahoo. Over the course of three years, Yahoo was able to tally up the full extent of the damage that occurred as a result of a breach in 2013. One billion user accounts were attacked, with data that included names, email addresses, dates of birth and answers to secret security questions, all swiped off their systems.
The Unsuspected Solution
One solution that is perhaps best equipped to address cloud security is the blockchain. Best known for Bitcoin and the ability to produce scarce tokens that incrementally increase in value, the genius behind blockchain is its ability to store enormous amounts of data behind an encrypted ledger that is generally immutable. The whole concept behind blockchain relies on the theory that all parties involved mutually distrust each other, and new “blocks” can only be added to the “chain” through advancing its encryption. This underlying structure means that with time it has become virtually impossible to hack. Its system of encryption is transparent and famously resistant to corruption, as it operates as a decentralized structure.
However, that is not to say that the blockchain is perfect either, as it has also endured security breaches in its somewhat murky past. However, those breaches are becoming less frequent as the technology becomes increasingly robust and resilient. There is also the concern that if you tie economic value to data security “tokens”, those tokens are subject to becoming volatile, where the cost of completing a transaction can fluctuate dramatically, being highly affordable at times of low volatility and extremely expensive at times of high volatility. Furthermore, it may also become unwieldy and slow if there is limited liquidity in the market for the data security tokens, making it potentially inoperable for large data centers.
While every solution carries its own dangers, the risks associated with cloud technology are undoubtedly worth persevering through, due to its numerous silver linings.
About the Author:
AmramMargalit is a professional writer who has worked in a wide range of settings, including technology companies, nonprofits, and the entertainment industry. Within these positions, Amram has provided quality content and advertising services and is currently the Content Manager at Leverate.
This past week has been very interesting in the US markets for a couple of reasons. It is time we took a hard look at what to expect going forward and how this news will likely drive future market moves.
First, the Q2 GDP number came in as a huge boost to the US economy and for the future expectations of economic growth in the US. 4.1% GDP for Q2 is massive compared to the previous administrations GDP levels. Granted, these levels may not be sustainable in the long term above 4%, but we can only assume levels above 3% are going to last for a while unless something dramatic changes the economic footing within America.
Secondly, Facebook and Twitter both missed on earnings and growth numbers. These two stocks got crushed in the process. One thing to consider is that Facebook is within a transitional phase with the Federal government and the SEC investigating the company for illegal activity and for illegally allowing external firms to data-mine the user base. These issues have likely resulted in a decrease in the total user base for Facebook and in a general dissatisfaction for existing users. A certain group of people will simply stop using Facebook because they don’t agree with or condone these activities and don’t want to be a part of these issues.
Twitter, on the other hand, has had a rough go of it for years. With a failure to properly monetize the company and users on top of recent concerns that “shadow banning” and “political bias” has infiltrated the SOP (standard operating procedures) of the company’s leadership, it appears Twitter is not being targeted as a “biased social platform” that could result in further headwinds for success.
The end result is that these two stocks don’t make up the entire stock market – they are just relatively large components of a much bigger market of stocks.
As we have been stating for months, the capital migration from foreign sources into the US markets have been a major driving force over the past 24 months. This capital is searching for safe and equitable growth opportunities. We are certain that a large portion of this capital found a home in Facebook and Twitter – as well as other stocks. These investors may be shocked by the recent collapse of FB and TWTR, but we are relatively certain that these investors will likely continue to hold their positions for one reason – the expectations that the US economy is strong and the recovery of these two stocks will likely take place over the next 6 to 12+ months without much issue.
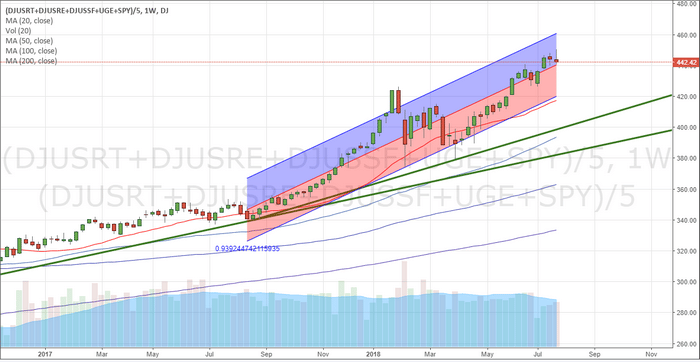
When we take a look at the longer term charts, we can see a fairly clear picture of the recent price rotation (January 2018) and the most recent upswing in prices. This, our Custom US Index Weekly chart, shows exactly what we see in terms of trend and expectations. The Std. Deviation channel is key to understanding future price rotation, if it happens. As long as the lower Std. Dev channel is nor breached, price should find support and rotate higher as expectations continue to drive prices higher and as foreign capital continues to rush into the US markets.
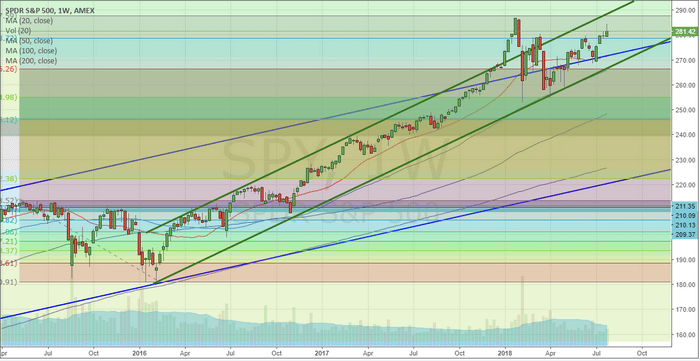
This Weekly SPY chart shows a similar price channel setting up from 2016. Actually, there are two price channels at play. The Blue levels originate from the lows in 2009 and track price trends all the way through 2015~2016. The upper Blue channel is currently creating support for prices moving forward. The Green channels are more recent and originate from 2016. Ideally, as long as price stays above the lower Green price channel, the trend is Bullish and we should expect mild price rotation.
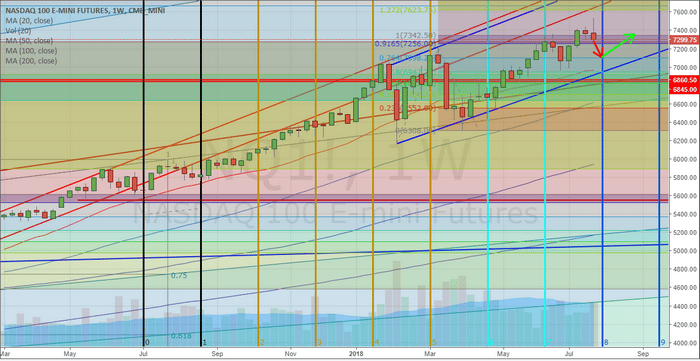
Lastly, this NQ Weekly chart shows a bit more detail including our Time/Price cycles that indicate we should see some moderate price rotation over the next few weeks. We don’t expect this rotation to be deep or excessively volatile, but we do expect some type of narrow price rotation to occur. You can see from the arrows we’ve drawn on the chart that we expect prices to hover below or near 7400 for the next 3~5+ weeks – as we’ve been warning about for the past 30+ days. The NQ will likely become range bound below 7400 for the next few months – possibly throughout the end of 2018.
The price channels shown on this chart, in Blue, are still critical to the longer term trends. Once these channels are broken to the downside, then we would be more concerned of further and deeper downside price pressures. As of right now, nothing is showing us any real concern and the Q2 GDP numbers will act as a booster rocket for the US economy unless something derails over the next 3~6 months.
The short sellers that have been setting up for a massive and deep price correction may see a bit of profits in some stocks that rotate lower, like FB and TWTR, but our analysis is showing these traders are taking a risky position getting setup for a deeper and broader market rotation downward. At this point, with incredible GDP growth, strong earnings, a strong US economy and foreign capital rushing into the US market/stocks – we just don’t see the downside potential that others seem to see.
For months we have been posting our analysis stating the markets would push higher from the February lows. We have stood by our analysis and weathered some criticism over the past few months. Still, the markets continue to push higher and the news just seems to support our predictive modeling systems analysis. Currently, a unique sector rotation is taking place that traders need to be aware of. This will likely not become a broad market rally where everything goes up for weeks of months. This will likely become a select sector rally in the markets based on expectations and opportunities. Last week to locked in 12% profit on the financial sector using FAS, and we feel its still headed higher!
If you want to learn more about our analysis and our opinions regarding what will move and when, then visit www.TheTechnicalTraders.comto learn how we can help you find greater profits in these markets. Our predictive modeling systems have been calling these markets almost perfectly for the past 8+ months. Isn’t it time you invested in your future success and take advantage of the features and benefits we can offer to you?
As we can see in the H4 chart, XAUUSD has reached the retracement of 23.6% and right now is still trading sideways. The next upside targets may be the retracements of 38.2%, 50.0% and 61.8% at 1249.00, 1260.00, and 1272.00 respectively. The support level is the local low at 1211.37.
The H1 chart shows the more detailed structure of the current movement. The pair is expected to break the low and then continue falling towards the post-correctional extension area between the retracements of 138.2% and 161.8% at 1202.40 and 1196.50 respectively.
USDCHF, “US Dollar vs Swiss Franc”
As we can see in the H4 chart, the divergence made USDCHF reverse and start a new correction downwards, which has already reached the retracement of 23.6% and may continue towards the ones of 38.2% and 50.0%. The key resistance level is at 1.0068. if the price breaks it, the instrument may continue growing towards the post-correctional extension area between the retracements of 138.2% and 161.8% at 1.0155 and 1.0218 respectively.
In the H1 chart, the pair is being corrected sideways.
Attention! Forecasts presented in this section only reflect the author’s private opinion and should not be considered as guidance for trading. RoboForex LP bears no responsibility for trading results based on trading recommendations described in these analytical reviews.
EURUSD is consolidating around 1.1658. According to the main scenario, the instrument may trade downwards to break 1.1570 and then continue falling with the short-term target at 1.1430.
GBPUSD, “Great Britain Pound vs US Dollar”
GBPUSD is forming the first descending impulse with the target at 1.3055. Later, the market may grow to reach 1.3130 and then resume trading to the downside with the target at 1.2888.
USDCHF, “US Dollar vs Swiss Franc”
USDCHF is still consolidating around 0.9940; right now, it is forming the structure to reach 0.9980. Later, the market may fall to return to 0.9940, thus forming another consolidation range. If later the instrument breaks this range to the downside, the price may continue trading downwards to reach 0.9870; if to the upside – form a new ascending structure with the target at 0.9999. The main upside target is at 1.0120.
USDJPY, “US Dollar vs Japanese Yen”
USDJPY is consolidating around 111.15. If later the instrument breaks this range to the upside, the price may continue trading upwards to reach 111.73; if to the downside – continue falling towards 110.10.
AUDUSD, “Australian Dollar vs US Dollar”
AUDUSD is moving upwards to reach 0.7416. After that, the instrument may form another descending structure towards 0.7285.
USDRUB, “US Dollar vs Russian Ruble”
USDRUB is falling towards 62.48. Later, the market may form a new ascending structure to reach 63.10 and then fall to break 61.61. After that, the instrument may continue trading to the downside with the short-term target at 60.16.
XAUUSD, “Gold vs US Dollar”
Gold is falling to reach 1218.00. Today, the price may break this level and continue falling towards 1209.00. Later, the market may return to 1218.00 and then resume trading to the downside with the target at 1206.00.
BRENT
Brent is moving upwards. Possibly, the pair may grow to reach 75.30. Later, the market may start another correction towards 73.15 and then trade upwards to reach 74.70, thus forming a new consolidation range. If later the instrument breaks this range to the upside, the price may continue the uptrend towards 82.00; if to the downside – continue the correction with the target at 70.50.
Attention! Forecasts presented in this section only reflect the author’s private opinion and should not be considered as guidance for trading. RoboForex LP bears no responsibility for trading results based on trading recommendations described in these analytical reviews.
US Dollar net speculator positions leveled at $20.33 billion as of Tuesday
The latest data for the weekly Commitment of Traders (COT) report, released by the Commodity Futures Trading Commission (CFTC) on Friday, showed that large traders and currency speculators continued to raise their bets in favor of the US dollar this week while cutting back on the Japanese yen, British pound and the Mexican peso. See full article
The non-commercial contracts of WTI crude futures totaled a net position of 610,471 contracts, according to data from this week. This was a slide of -20,823 contracts from the previous weekly total. See full article
The large speculator contracts of gold futures totaled a net position of 48,597 contracts. This was a weekly decline of -9,244 contracts from the previous week. See full article
The large speculator contracts of 10-year treasury note futures totaled a net position of -509,498 contracts. This was a weekly reduction of -40,360 contracts from the previous week. See full article
The non-commercial contracts of silver futures totaled a net position of 3,538 contracts, according to data from this week. This was a weekly fall of -5,344 contracts from the previous totals. See full article
The large speculator contracts of copper futures totaled a net position of 9,367 contracts. This was a weekly boost of 254 contracts from the data of the previous week. See full article
The Commitment of Traders report data is published in raw form every Friday by the Commodity Futures Trading Commission (CFTC) and shows the futures positions of market participants as of the previous Tuesday (data is reported 3 days behind).
US Dollar net speculator aggregate positions rose to $20.33 billion this week
The latest data for the weekly Commitment of Traders (COT) report, released by the Commodity Futures Trading Commission (CFTC) on Friday, showed that large traders and currency speculators continued to raise their bets in favor of the US dollar this week while cutting back on the Japanese yen, British pound and the Mexican peso.
Non-commercial large futures traders, including hedge funds and large speculators, had an overall US dollar net position totaling $20.33 billion as of Tuesday July 24th, according to the latest data from the CFTC and dollar amount calculations by Reuters. This was a weekly rise of $1.92 billion from the $18.41 billion total position that was registered the previous week, according to the Reuters calculation (totals of the US dollar contracts against the combined contracts of the euro, British pound, Japanese yen, Australian dollar, Canadian dollar and the Swiss franc).
The aggregate US dollar position increased for a sixth straight week and surpassed the +$20 billion level for the first time since January 24th of 2017.
Individual Currency Contract Data this week
For individual currency contracts this week, the non-commercial large futures traders, including hedge funds and large speculators, bet in favor of the US Dollar Index (6,347 weekly change in contracts) the euro (8,233 contracts), Canadian dollar (2,973 contracts) and the New Zealand dollar (697 contracts).
The currencies whose speculative bets declined this week versus the dollar were the British pound sterling (-7,991 contracts), Japanese yen (-15,119 contracts), Swiss franc (-3,665 contracts), Australian dollar (-4,961 contracts) and the Mexican peso (-9,494 contracts).
Table of Weekly Commercial Traders and Speculators Levels & Changes:
Currency
Net Commercials
Comms Weekly Chg
Net Speculators
Specs Weekly Chg
EuroFx
-45,073
-15,677
29,640
8,233
GBP
65,121
9,434
-46,743
-7,991
JPY
97,646
12,478
-73,769
-15,119
CHF
67,092
2,009
-45,808
-3,665
CAD
49,149
-9,392
-44,511
2,973
AUD
65,015
3,751
-45,486
-4,961
NZD
28,216
-1,006
-24,370
697
MXN
-21,531
9,043
19,584
-9,494
This latest COT data is through Tuesday and shows a quick view of how large speculators or non-commercials (for-profit traders) as well as the commercial traders (hedgers & traders for business purposes) were positioned in the futures markets. All currency positions are in direct relation to the US dollar where, for example, a bet for the euro is a bet that the euro will rise versus the dollar while a bet against the euro will be a bet that the dollar will gain versus the euro.
Weekly Charts: Large Trader Weekly Positions vs Price
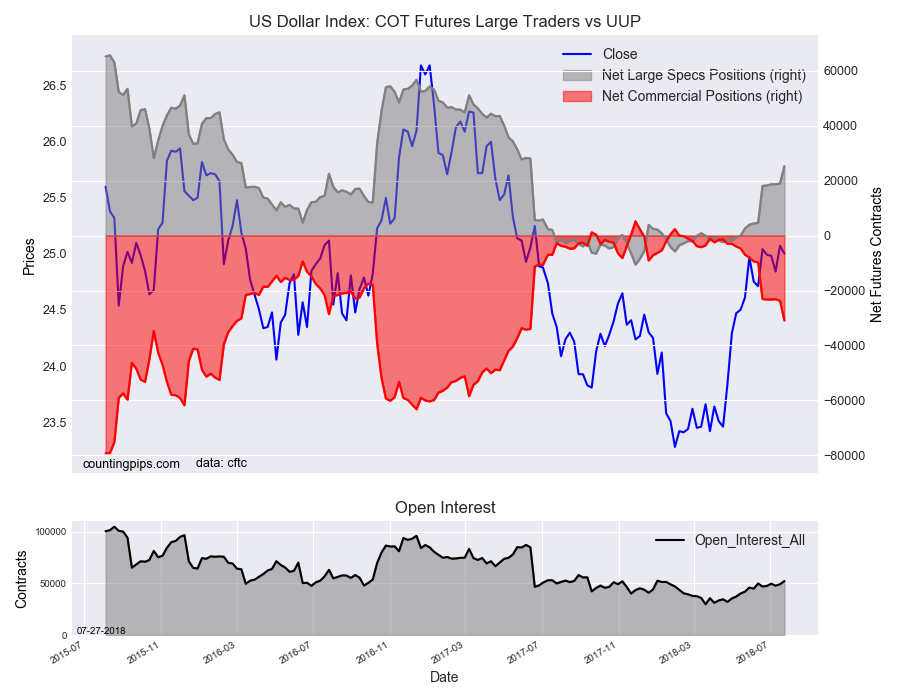
US Dollar Index:
Speculators once again raised bets for the US dollar index this week by 6,347 contracts to a total net position of 25,271 contracts. The US dollar index spec position has now seen improvement for fourteen straight weeks and is above the +20,000 net contract level for the first time since 2017.
EuroFX:
Euro positions rebounded this week after two down weeks. The euro speculator positions had fallen for ten out of the previous eleven weeks before this week’s turnaround. The overall standing is above the +20,000 level for a third week but is down from +109,744 net contracts only ten weeks ago.
British Pound Sterling:
British pound sterling positions dropped this week for the fifth time out of the past six weeks. The GBP is at the most bearish since September 5th of 2017 and has now been in bearish territory for six straight weeks.
Japanese Yen:
Japanese yen positions dropped sharply (above -10,000 contracts) for a second week and fell for a fourth straight week. The overall position level is at the most bearish since March 13th.
Swiss Franc:
Swiss franc positions declined for a second straight week and for the fourth out of the past five weeks. The overall net position continues to be bearish above the -40,000 net contract level for a fourth straight week while the overall spec position has now been bearish for 51 straight weeks dating back to August 2017.
Canadian Dollar:
Canadian dollar positions edged higher for a second straight week after falling for three weeks in a row. The overall net position has now been bearish for eighteen straight weeks and is above the -40,000 bearish level for a fourth week.
Australian Dollar:
Australian dollar bets fell lower this week for the second time out of three weeks. The overall net position continues to be in a bearish position for a seventeenth straight week and above -40,000 net contracts for a third week.
New Zealand Dollar:
New Zealand dollar bets advanced for a second week this week after four straight weeks of declines. The overall net position has now been bearish for six weeks while remaining above the -20,000 net contract level for a fourth week.
Mexican Peso:
Mexican peso bets dropped this week after three weeks of gains. The overall position remains in bullish territory for a fourth consecutive week after MXN positions were under heavy selling pressure prior to the recent presidential election.
*COT Report: The weekly commitment of traders report summarizes the total trader positions for open contracts in the futures trading markets. The CFTC categorizes trader positions according to commercial hedgers (traders who use futures contracts for hedging as part of the business), non-commercials (large traders who speculate to realize trading profits) and nonreportable traders (usually small traders/speculators). Find CFTC criteria here: (http://www.cftc.gov/MarketReports/CommitmentsofTraders/ExplanatoryNotes/index.htm).
The Commitment of Traders report is published every Friday by the Commodity Futures Trading Commission (CFTC) and shows futures positions data that was reported as of the previous Tuesday (3 days behind).
Each currency contract is a quote for that currency directly against the U.S. dollar, a net short amount of contracts means that more speculators are betting that currency to fall against the dollar and a net long position expect that currency to rise versus the dollar.
(The charts overlay the forex closing price of each Tuesday when COT trader positions are reported for each corresponding spot currency pair.) See more information and explanation on the weekly COT report from the CFTC website.
The strength of the U.S. dollar poses an obstacle to further gains in oil prices.
President Trump’s trade war with China, which is still in its early stages, has already battered the yuan. The dollar has gained more than 8 percent against the Chinese currency since March. As Reuters points out, in dollar terms the price of Brent oil has climbed 9 percent this year, but in yuan terms oil is now nearly 14 percent more expensive.
But it isn’t just the yuan that has been knocked down a peg or two by the greenback. The U.S. dollar index is at its strongest in a year, pushed along by steady rate tightening from the U.S. Federal Reserve and solid GDP growth.
There is a bit of a feedback effect at hand as well. As the Fed tightens rates and pushes up the dollar, emerging market currencies suffer from sudden shocks, sometimes severe. Argentina, Brazil, Turkey and South Africa have seen significant depreciations in their currencies this year. As capital flees some of these emerging markets and flows into safe haven assets, such as the U.S. dollar, it only magnifies the divergence between the greenback and other currencies.
The problem for many emerging markets is that oil prices have been going up at the same time. Typically, oil prices trade inversely to the U.S. dollar. A stronger dollar makes oil more expensive to much of the world, so oil prices typically fall as the dollar rises. But the dollar and oil have been climbing in tandem for much of this year. This amplifies the pain for many consumers around the world.
Painful price increases threatens oil demand. To some extent, governments around the world are trying to cushion the blow through price caps, fuel subsidies and currency support. Those market interventions from several countries could keep oil demand growth from diving too much, Bank of America Merrill Lynch said in a note in early June.
But those measures come at a huge cost to public coffers, and might not be enough to stave off demand destruction and/or economic slowdown. The hit to oil demand will be much larger than would be the case if the dollar had not strengthened. Dealing with a rise in oil prices is one thing, but for motorists in emerging markets to swallow double-digit price increases at the pump, driven by weakening currencies relative to the dollar, is an entirely different thing.
Even Donald Trump is a bit wary of the strengthening dollar, recognizing that it poses challenges to the U.S. economy. “I’m not thrilled,” Trump said in a CNBC interview last week “Because we go up and every time you go up they want to raise rates again. I don’t really — I am not happy about it. But at the same time I’m letting them do what they feel is best.”
It’s an odd position, however, since Trump’s trade war with China is helping to push the dollar and the yuan in opposite directions. China’s central bank has also taken the opportunity to loosen its grip over the yuan, which will save it from having to blow huge sums of reserves to keep the currency fixed, as it did during the summer of 2015. Of course, the U.S. has complained to China for years, demanding less intervention to artificially suppress the value of the yuan. Now that the yuan is sinking, Washington isn’t pleased. “This really shows the folly of waging trade war,” said Zhang Bin, an economist at the Chinese Academy of Social Sciences, told the FT. “China wants to promote market-based reform [of the exchange rate]. Isn’t this what America has been hoping for?”
Because China is a voracious consumer of commodities, including crude oil, the compounding effect of a slowdown in the Chinese economy and a weaker yuan creates new headwinds for the oil market. In fact, even as oil prices suffered a correction over the past few weeks, prices have not continued on a downward trajectory, even as other commodities have suffered from a deeper rout. Copper, for instance, is down 18 percent since May. “A looming trade war and uncertainty about Chinese demand weigh on commodity prices and related currencies,” Georgette Boele, currency and metals strategist at ABN Amro Bank NV, told Bloomberg. “As long as there’s nervousness about China, commodities will remain exposed to the trade war.”
Commodity prices are often a key barometer for global demand, which is to say that the recent selloff has some analysts worried about the health of the global economy.
The oil supply outages in Venezuela, Libya and Iran could yet drive oil prices much higher. But the strength of the U.S. dollar is a major roadblock. If the supply outages do not materialize, there is much more room on the downside for oil prices.
On H4, Bitcoin continues to form a correction uptrend. This correction has reached 38.2% Fibo and may go ahead to reach 50.0% (8.764.50) and 61.8 (9.472.00). The low at 5750.00 is acting as a support.
On H1, for Bitcoin we can see that after the divergence has been formed the market is entering the local correction stage. Once 23.6% Fibo is reached, the price may fall to 38.2% (7.567.00) and 50.0% (7.283.00). The resistance is at the maximum of 8484.10.
Ethereum
On H4, for Ethereum we can see the continued correction compared with the previous downtrend. The correction has reached 23.6% according to Fibonacci. The further uptrend targets may lie at 38.2% (567.00) and 50.0% (617.00). In case the low at 404.21 gets broken out, the price may go down to reach the post correctional extension at 138.2%-161.8% Fibo (362.20-336.10).
On H1, for Ethereum there is an uptrend after the correction descent to 76.0% according to Fibonacci. The main target of the current uptrend is 515.33.
Attention! Forecasts presented in this section only reflect the author’s private opinion and should not be considered as guidance for trading. RoboForex LP bears no responsibility for trading results based on trading recommendations described in these analytical reviews.
EUR/USD pair was not able to reach and manage to stay above 1.1700 and continue to head upwards. The market has broken out 1.1660 downwards and is on downmove. Today, 1.1560 may be reached, and then a rise to 1.1650 is possible. After this, the pair is likely to head down, reaching 1.1550.
GBPUSD
GBP/USD is on the first downward move. The target is at 1.3055, later a rise to 1.3120 is expected. After that, it may continue to head down to 1.2888.
USDCHF
The USDCFH is still consolidating around 0.9928. In case a breakout downwards occurs at 0.9910, the price is likely to go down to 0.9870. If the price goes up, the growth to 0.9999 may follow.
USDJPY
The USDJPY is consolidating around 111.15. In case of a rise the price may reach 111.73. If the price goes down, the trend may continue, with the price going to 110.10.
AUDUSD
The AUD/USD pair has finished its first down move. Today the rise to 0.7415 is possible, but later it is likely to fall to 0.7285. This is a strategic target.
USDRUB
USD/RUB price is falling to 62.49. After that, it may rise to 63.10, but later it is likely to fall to 61.61. With the further breakout, the price may head lower to 60.16. This is a local target.
GOLD
Gold has completed its first down move.Today, the yellow metal may rise and reach 1,228, but later it is likely to fall to 1206. After that, it may fall to 1240.
BRENT
Brent crude is under pressure and is going up. Today, 75.15 may be reached, but later it is likely to fall to 73.15. After that, the pair is likely to rise, reaching 74.20, after which the consolidation range may be expected. If the price goes up, the trend towards 82 may follow. If the price goes down, the correction towards 70.50 may follow.
Attention! Forecasts presented in this section only reflect the author’s private opinion and should not be considered as guidance for trading. RoboForex LP bears no responsibility for trading results based on trading recommendations described in these analytical reviews.