Author Archive for InvestMacro – Page 384

US Stock Market Sector Breakouts Taking Place

By TheTechnicalTraders.com

Now is the time for traders to really pay attention to the rotation in the US Stock market as well as the continued price rotation in certain sectors.  As we have been warning for the past few months, this really is a stock pickers market.  Take a minute to review our past articles highlighting these sector moves and the general market sentiment over the past few weeks: June 24: Could A Big Move In The Global Markets Be Setting Up? & Q2 GDP vs. Technology Concerns vs. Foreign Markets.  As traders, we need to understand how capital migrates towards opportunities and safety and how it migrates away from risks and price collapses.

Over the past months, our research team at Technical Trades Ltd. has been pouring over the charts to identify these moves and to keep our subscribers ahead of these trends.  The US Dollar and the recent Q2 earnings season reporting have acted like pouring fuel onto a burning fire.  BOOM.  We highlighted the potential for increased volatility and price rotation weeks ago and we continue to try to identify the best opportunities for our subscribers.

Today, our research has really paid off with moves in sectors that we’ve highlighted and been trading for weeks.  Our proprietary price modeling systems have shown us what to expect in the markets going forward many weeks and months.  We’ve been calling for the NQ to hover near 7400 while we’ve been expecting the DOW and S&P to continue to rally higher.  We’ve been sharing our research that we believe the Transports, Russell and many of the Blue Chips will perform much better than the hot technology sector and other sectors and its starting to happen now.

Capital appears to be migrating out of technology on weakness and expected continued pricing pressures and that capital will be attempting to find new sources of security and growth.  Earnings numbers have been generally strong, therefore, we expect this capital to migrate into stronger, dividend producing and transportation based equities. With the 4.1% GDP number, the expectations going into the end of this year should be that the economy may stay hot and these sectors could continue to rally.

This Weekly IWM Chart shows dual Fibonacci extension levels that coincide near $184.  These levels show us that the upside potential for this move in the Russell 2000 ETF, which is really only an 8~10% price rally) could accelerate upward throughout the end of this year as the US economy continues to push harder and the migration of capital continues to roll out of the hot technology sector and into more traditional sectors.

We’ve highlighted the projected price point where this targeted level seems to be a key element of our analysis.   This level also coincides with key Fibonacci price projection points.  It makes sense to us that as capital moves out of technology and other risky sectors, this capital will be seeking a safe and secure investment in stocks that have the opportunity to perform well throughout the end of the year with a strong US economy.  Retail, Transportation, the Russell 2000 and more traditional Blue-Chip equities seem to be the renewed targets for this capital.


This Weekly chart of the IYT (Transportation ETF) highlights the continued higher low price rotation patterns that have driven continued rallies in price.  The last three low price rotations were key to setting up a new Pennant Formation Breakout that has just started.  This breakout pattern is key to understanding the upside potential for the Transportation Index.  These upside targets are 3.6% & 6.8% higher than current prices.  This represents a very solid opportunity for traders over the next 4+ months as we head into the Christmas and Thanks Giving holidays – the Santa Rally.


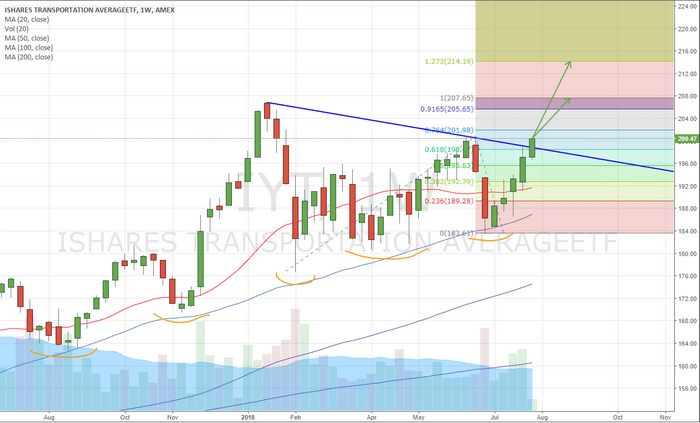
What was hot over the past 4+ months, may start to flatten out and rotate lower over the next few months as capital migrates into newer opportunities headed into the end of 2018 with a strong US economy.  Our opinion is that technology will become a weakening market sector for at least the next 30~60 days as revisions to earning and expectations, as well as continued issues from China and globally, drive a capital re-balancing process across the globe.  This migration of capital will move into new, more traditional, equities as a source of security and growth.  Capital always attempts to find the best environment for security, growth and limited risks.

For example, we just locked in a 12% profit on the financial sector using FAS, and we feel it is still headed higher, all this happened while technology stocks sold off.

If you want to see what our proprietary modeling tools are saying about the markets and what to expect in the near term future, then visit www.TheTechnicalTraders.com to learn how we can help you find and execute better trades while staying ahead of these market trends and cycles.  Our proprietary price modeling tools are second to none and have proven to be extremely accurate over the past 6+ months.  Don’t miss the next big moves in the markets.  Learn how we can help you find and execute better trades with our specialized research, daily videos, proprietary modeling systems and more.  Watch how these markets rotate over the next few weeks to see how accurate our analysis really is.

Chris Vermeulen

TheTechnicalTraders.com

Fibonacci Retracements Analysis 31.07.2018 (EURUSD, USDJPY)

Article By RoboForex.com

EURUSD, “Euro vs US Dollar”

As we can see in the H4 chart, the mid-term sideways movement continues. The most probable targets may be the retracements of 38.2% and 50.0% at 1.1853 and 1.1960 respectively. However, if EURUSD breaks the low at 1.1508, it may continue falling towards the post-correctional extension area between the retracements of 138.2% and 161.8% at 1.1377 and 1.1296 respectively.

EURUSD1
Risk Warning: the result of previous trading operations do not guarantee the same results in the future

In the H1 chart, the pair is moving upwards. The short-term target is the high at 1.1750. After breaking it, the instrument may continue growing towards the post-correctional extension area between the retracements of 138.2% and 161.8% at 1.1810 and 1.1854 respectively.

EURUSD2
Risk Warning: the result of previous trading operations do not guarantee the same results in the future


USDJPY, “US Dollar vs. Japanese Yen”

As we can see in the H4 chart, USDJPY is trading downwards and has already reached the retracement of 23.6%. The next downside targets may be the retracements of 38.2%, 50.0%, and 61.8% at 109.90, 108.89, and 107.89 respectively. The resistance level is the high at 113.17.

USDJPY1
Risk Warning: the result of previous trading operations do not guarantee the same results in the future

In the H1 chart, the pair is being corrected upwards and may soon reach the retracement of 38.2% at 111.57. The next possible target is the retracement of 50.0% at 111.88. the support level is the low at 110.58.

USDJPY2
Risk Warning: the result of previous trading operations do not guarantee the same results in the future

Article By RoboForex.com

Attention!
Forecasts presented in this section only reflect the author’s private opinion and should not be considered as guidance for trading. RoboForex LP bears no responsibility for trading results based on trading recommendations described in these analytical reviews.

Stats Support Australian Dollar

On Tuesday, the Australian Dollar continues rising against the USD. The reason is not only the weakness of the American currency in anticipation of another US Federal Reserve meeting, but the statistics published by Australia this morning as well.

The Building Approvals in Australia expanded by 6.4% m/m in June, which is much better than both previous and expected readings (-2.5% m/m and +1.1% m/m respectively). The report is very positive for the Australian economy and provides significant support to the Aussie.

Apart from this, China reported on the Manufacturing PMI and the Non-Manufacturing PMI in July today. The first indicator decreased up to 51.2 points after being 51.5 the month before, the second one – from 55.0 points to 54.0 points. It’s quite surprising, but these numbers didn’t make the Aussie retreat, although the Australian currency is usually very sensitive to the Chinese news and statistics.

Investors are waiting for the July meeting of the US Federal Reserve, that’s why the American currency is getting weaker. Not all of them truly believe that the US economy is strong enough to allow the regulator to increase the benchmark rate four times this year instead of three. The Federal Reserve still hasn’t informed investors about this. The Aussie may try to recover as long as the USD is under pressure.

From the technical point of view, the downtrend is still dominating. Such conclusion may be drawn because the price is still moving inside the long-term descending channel. At the same time, one should note that the mid-term movement is sideways. Still, the Flat pattern doesn’t necessarily mean a reverse or a continuation of the current tendency.

The short-term tendency may be described as an uptrend, which is moving not only towards the resistance line of the short term channel, but mid- and long-term ones as well. As a result, it may be assumed that the short-term upside target is at 0.7495. If the pair breaks this level, the long-term tendency may change. However, if the price breaks the local support line at 0.7395, the instrument may continue falling to reach 0.7325.

Author: Dmitriy Gurkovskiy, Chief Analyst at RoboForex


Disclaimer

Any forecasts contained herein are based on the authors’ particular opinion. This analysis may not be treated as trading advice. RoboForex bears no responsibility for trading results based on trading recommendations and reviews contained herein.


Ichimoku Cloud Analysis 31.07.2018 (AUDUSD, NZDUSD, USDCAD)

Article By RoboForex.com

AUDUSD, “Australian Dollar vs US Dollar”

AUDUSD is trading at 0.7422; the instrument is moving above Ichimoku Cloud, which means that it may continue growing. The markets could indicate that the price may test the upside border of the cloud at 0.7415 and then resume moving upwards to reach 0.7515. However, the scenario that Implies further growth may be cancelled if the price breaks the downside border of the cloud and fixes below 0.7370. In this case, the pair may continue falling towards 0.7305. After breaking the upside border of the Triangle pattern and fixing above 0.7465, the price may continue moving upwards.


AUDUSD
Risk Warning: the result of previous trading operations do not guarantee the same results in the future


NZDUSD, “New Zealand Dollar vs US Dollar”

NZDUSD is trading at 0.6823; the instrument is moving above Ichimoku Cloud, which means that it may continue growing. The markets could indicate that the price may test the upside border of the cloud at 0.6800 and then continue moving upwards to reach 0.6895. However, the scenario that implies further growth may be cancelled if the price breaks the downside border of the cloud and fixes below 0.6760. In this case, the pair may continue falling towards 0.6735. After breaking the upside border of the Triangle pattern and fixing above 0.6855, the price may continue moving upwards.


NZDUSD
Risk Warning: the result of previous trading operations do not guarantee the same results in the future


USDCAD, “US Dollar vs Canadian Dollar”

USDCAD is trading at 1.3049; the instrument is moving below Ichimoku Cloud, which means that it may continue falling. The markets could indicate that the price may test Tenkan-Sen and Kijun-Sen at 1.3065 and then continue moving downwards to reach 1.2930. Another signal to confirm further descending movement is the price’s rebounding from the channel’s upside border. However, the scenario that implies further decline may be cancelled if the price breaks the upside border of the cloud and fixes above 1.3160. In this case, the pair may continue growing towards 1.3305.


USDCAD
Risk Warning: the result of previous trading operations do not guarantee the same results in the future

Article By RoboForex.com

Attention!
Forecasts presented in this section only reflect the author’s private opinion and should not be considered as guidance for trading. RoboForex LP bears no responsibility for trading results based on trading recommendations described in these analytical reviews.

Meetings of the Central Banks Are in the Focus of Attention

by JustForex

The US dollar is moving in different directions against the basket of major currencies. Yesterday, the pending home sales index was published, which counted to 0.9% and was above the forecasted value of 0.4%. However, despite this, the US dollar index (#DX) closed in the negative zone (-0.34%) yesterday. In general, demand for the US currency is still high. Investors took a wait-and-see attitude before the Fed interest rate decision, which will be taken tomorrow, August 1. It is expected that the regulator will leave the interest rate unchanged at 2.00%.

Today during the Asian trading session the Bank of Japan meeting has taken place, at which it has been decided to leave the key interest rate unchanged at the level of -0.10%. Financial market participants expect important economic statistics from the Eurozone, the US and Canada. On Thursday, August 2, the Bank of England meeting will be held.

The “black gold” prices are rising. At the moment, futures for the WTI crude oil are testing a mark of $69.70 per barrel. At 23:30 (GMT+3:00), a report on the API weekly crude oil stock will be published.

Market Indicators

Yesterday, the bearish sentiment was observed in the US stock market: #SPY (-0.52%), #DIA (-0.55%), #QQQ (-1.41%).

At the moment, the 10-year US government bonds yield is at the level of 2.93-2.94%.

The news feed on 2018.07.31:

– German unemployment change at 10:55 (GMT+3:00);
– Consumer price index in the Eurozone at 12:00 (GMT+3:00);
– Data on Canada GDP at 15:30 (GMT+3:00);
– CB consumer confidence index in the US at 17:00 (GMT+3:00).

by JustForex

The Analytical Overview of the Main Currency Pairs on 2018.07.31

Analytics by JustForex

The EUR/USD currency pair

Technical indicators of the currency pair:
  • Prev Open: 1.16570
  • Open: 1.17033
  • % chg. over the last day: +0.41
  • Day’s range: 1.17022 – 1.17074
  • 52 wk range: 1.0571 – 1.2557

During yesterday’s trading session, the bullish sentiment was observed on the EUR/USD currency pair. The growth of quotes exceeded 60 points. At the moment, the technical pattern is ambiguous: a trading instrument is in a sideways trend. The key support and resistance levels are 1.17000 and 1.17300, respectively. We recommend opening positions from these marks.

The news feed on 2018.07.31:
  • – German unemployment change at 10:55 (GMT+3:00);
  • – Consumer price index in the Eurozone at 12:00 (GMT+3:00);
  • – CB consumer confidence index in the US at 17:00 (GMT+3:00).
EUR/USD

Indicators point to the power of buyers: the price has fixed above 50 MA and 200 MA.

The MACD histogram is in the positive zone, but below the signal line, which gives a weak signal to buy EUR/USD.

Stochastic Oscillator is in the neutral zone, the %K line is crossing the %D line. There are no accurate signals.

Trading recommendations
  • Support levels: 1.17000, 1.16700, 1.16400
  • Resistance levels: 1.17300, 1.17600

If the price fixes below the round level of 1.17000, we recommend considering sales of EUR/USD. The movement is tending to 1.16700-1.16400.

Alternative option. If the price fixes above the resistance level of 1.17300, the EUR/USD quotes are expected to rise. The movement is tending to 1.17600-1.17800.

The GBP/USD currency pair

Technical indicators of the currency pair:
  • Prev Open: 1.31090
  • Open: 1.31359
  • % chg. over the last day: +0.20
  • Day’s range: 1.31343 – 1.31452
  • 52 wk range: 1.2361 – 1.4345

There is a variety of trends on the GBP/USD currency pair. At the moment, the local support and resistance levels are 1.31200 and 1.31550, respectively. The positions should be opened from these marks. Investors expect the Bank of England interest rate decision, which will be taken on Thursday, August 2.

Today, the publication of important news from the UK is not expected.

GBP/USD

The price has fixed above 50 MA and 200 MA, which indicates the power of buyers.

The MACD histogram is near the 0 mark.

Stochastic Oscillator is located near the overbought zone, the %K line is above the %D line, which gives a signal to buy GBP/USD.

Trading recommendations
  • Support levels: 1.31200, 1.30750, 1.30300
  • Resistance levels: 1.31550, 1.32000

If the price fixes below 1.31200, we recommend considering sales of GBP/USD. The movement is tending to 1.30750-1.32300.

Alternative option. If the price fixes above the resistance of 1.31550, the GBP/USD currency pair is expected to grow. The movement is tending to the round level of 1.32000.

The USD/CAD currency pair

Technical indicators of the currency pair:
  • Prev Open: 1.30515
  • Open: 1.30315
  • % chg. over the last day: -0.28
  • Day’s range: 1.30322 – 1.30449
  • 52 wk range: 1.2059 – 1.3795

There is a variety of trends on the USD/CAD currency pair. Investors took a wait-and-see attitude before the Fed meeting, which will be held tomorrow, August 1. At the moment, the key support and resistance levels are 1.30200 and 1.30600, respectively. The positions should be opened from these marks. We recommend paying attention to the dynamics of oil quotes.

At 15:30 (GMT+3:00) data on Canada GDP will be published.

USD/CAD

Indicators point to the power of sellers: the price has fixed below 50 MA and 200 MA.

The MACD histogram is near the 0 mark. There are no signals.

Stochastic Oscillator is in the neutral zone, the %K line is below the %D line, which gives a signal to sell USD/CAD.

Trading recommendations
  • Support levels: 1.30200, 1.29800
  • Resistance levels: 1.30600, 1.31000, 1.31500

If the price fixes below the support level of 1.30200, we recommend considering sales of USD/CAD. The movement is tending to 1.29800-1.29600.

If the price fixes above 1.30600, it is necessary to look for entry points to the market to open long positions. The target movement level is 1.31000-1.31200.

The USD/JPY currency pair

Technical indicators of the currency pair:
  • Prev Open: 110.936
  • Open: 112.120
  • % chg. over the last day: +0.05
  • Day`s range: 110.919 – 110.994
  • 52 wk range: 104.56 – 114.74

The technical pattern on the USD/JPY currency pair is ambiguous. Quotes are still in a sideways trend. Investors expect additional drivers. At the moment, the trading instrument is moving in the range of 110.900-111.350. Positions should be opened from the key support and resistance levels. We recommend paying attention to the 10-year US government bonds yield.

Today, during the Asian trading session, the Bank of Japan meeting has taken place.

USD/JPY

Indicators do not send accurate signals: the price is being traded between 50 MA and 200 MA.

The MACD histogram is near the 0 mark.

Stochastic Oscillator is located in the neutral zone, the %K line is above the %D line, which indicates the USD/JPY quotes growth.

Trading recommendations
  • Support levels: 110.900, 110.600
  • Resistance levels: 111.350, 111.800, 112.200

If the price fixes below the support of 110.900, we recommend considering sales of USD/JPY. The movement is tending to 110.600-110.300.

Alternative option. If the price fixes above the level of 111.350, the USD/JPY currency pair is expected to grow. The movement is tending to 111.800-112.000.

Analytics by JustForex, 2018.07.31


EURUSD: resistance at 1.1735

By Gabriel Ojimadu, Alpari

Previous:

On Monday the 30th of July, trading on the euro closed up. The euro rose against the dollar to 1.1719. The key driver behind the euro’s recovery was the universal decline of the greenback. As trading got underway in Europe, the dollar took a dive despite a rise in US10Y bond yields.

Market participants may be selling them off ahead of the conclusion of the Fed’s meeting on Wednesday. We can’t rule out the possibility that given the current situation, people may be taking up positions against the dollar, fearing that the Fed won’t raise interest rates another 2 times this year. The Fed’s accompanying statement should shed some light on this issue.

Day’s news (GMT+3):

  • 09:00 Germany: retail sales (Jun).
  • 09:30 Japan: BoJ press conference.
  • 09:45 France: CPI (Jul).
  • 10:55 Germany: unemployment rate (Jul), unemployment change (Jul).
  • 12:00 Eurozone: GDP (Q2), unemployment rate (Jun), CPI (Jul).
  • 15:30 Canada: GDP (May), industrial product price (Jun).
  • 15:30 US: core personal consumption expenditure – price index (Jun), personal income (Jun), personal spending (Jun).
  • 16:00 US: S&P/Case-Shiller home price indices (May).
  • 16:45 US: Chicago PMI (Jul).
  • 23:30 US: API weekly crude oil stock.

Fig 1. EURUSD hourly chart. Source: TradingView

Current situation:

My target in yesterday’s forecast (1.1682) was reached. After breaking this level, I set a new target of 1.1735. As expected, the 67th degree was broken on the back of rising euro crosses. The euro rose to 1.1719. Traders may have been dumping the dollar ahead of the FOMC meeting.

On Tuesday the 31st of July, Eurozone GDP data is being released, which should give an idea of the current state of the economy. Today we’ll also get preliminary consumer inflation figures for the Eurozone in July.

I thought that buyers would be able to reach the upper boundary of the range at 1.1735 without the need for a correction. My forecast has the euro rising to this level, but given the wave structure we have, I’m not confident that it’ll turn out exactly this way.

If we consider the possibility that prices will rise as part of a 5-wave pattern (normally I don’t look at Elliot waves), then the target of 1.1640/45 is realistic. If the euro first drops to 1.1680, then it would be better to refrain from selling at 1.1730 – 1.1735. In this case, we should prepare for the price to exit the range of 1.1635 – 1.1735.

Today’s economic calendar is rich. Remember that there are several key events this week, with interest rate decisions from the Bank of Japan, Bank of England, and Federal Reserve, and July’s NFP report.

The FOMC’s two-day meeting will conclude on Wednesday. The key rate is expected to be left unchanged. Traders will be listening out for any information on future rate hikes, nothing else matters to them at the moment.

The Bank of England will announce its interest rate decision on Thursday. The consensus is that the key rate will be increased by 0.25%. Although this hike is already factored into prices, traders can buy the pound against the euro until Thursday. Traders will start to take profit after the meeting. The euro crosses will be under pressure this whole time.

Source: EURUSD: resistance at 1.1735

Coke, Meth And Booze: The Flip Side Of The Permian Oil Boom

By OilPrice.com

The fastest-growing oil region in the U.S. is fueling not only the second American shale revolution—it’s fueling a subculture of drug and alcohol abuse among oil field workers.

The Permian shale play in West Texas is once again booming with drilling and is full of oil field workers, some of which are abusing drugs and alcohol to help them get through long shifts, harsh working conditions, and loneliness and isolation.

Drugs are easily accessible in the Permian, which is close to highways and to Mexico. For oil field workers making six-figure salaries, money is not a problem to buy all kinds of illegal substances to shoot, snort and swallow to get through 24-hour-plus shifts. The physically exhaustive work also sometimes causes aches for workers, making them susceptible to getting hooked on prescription painkillers.

The drug and alcohol abuse subculture in the Permian is a known—yet rarely reported or discussed—issue in the most prolific U.S. shale play, where oil production is booming, and relentless drilling attracts oil field workers from all over Texas and all parts of the United States.

In Midland, in the very heart of the Permian oil boom, The Springboard Center—a drug and alcohol addiction treatment facility—has many clients from the oil fields, Christopher Pierce, director of marketing for center, tells Rigzone’s Valerie Jones in an interview.

“We get a lot of clients who work in the oilfield because of where we’re located,” says Pierce, 35, a former oil field worker, and a former addict.

Pierce and The Springboard Center in Midland are now working on building a gated living camp community free of drugs or alcohol for people who want to be in a safe place.

Oil workers are not speaking up at work about their addiction for fear of getting fired, Pierce said, adding that he doesn’t have anything negative to say about the oil industry, which is the backbone of the economic growth in the Permian.

Some oil field workers and contractors use drug cocktails or various substances depending on the condition they seek to achieve during their 24-hour-plus shifts. At the beginning of a long or overnight shift, they would use ‘uppers’ like cocaine and methamphetamines, and finish the shift with ‘downers’ such as prescription medication or alcohol, Kayla Fishbeck, regional evaluator for Prevention Resource Center Region 9, a data repository for 30 counties in West Texas, told Rigzone.

“In Region 9, the most screened drug last year was amphetamines and that was largely in the oilfield,” she said.

Thanks to the oil boom, the unemployment rate in Midland is at a record low 2.1 percent, and the unemployment rate in Odessa is also a historically low of 2.8 percent.

According to Fishbeck, Midland and Odessa are the top two Texas cities for drunken-driving fatalities.

“We hear stories of guys getting off their shift, getting a six-pack or 12-pack on their way home and start drinking in their truck,” Fishbeck told Rigzone.

The Permian’s drug of choice is crystal meth, a stimulant increasingly supplied by Mexican drug cartels, according to law enforcement officials who spoke to the Houston Chronicle in May.

There is a strong correlation between the rise of drilling activity and the number of crystal meth seizures by authorities in the Permian area, Houston Chronicle’s cross-analysis of data from the Texas Department of Public Safety and the rig count shows.

Eddy Lozoya, a former oil field trucker and a recovering addict at 23, has recently found a job at a local department store selling shoes. At least for the next few months, he doesn’t plan to return to the oil field.

“I don’t see myself being able to work 100 hours a week sober,” he told the Houston Chronicle. “The oil field is tough.”

By Tsvetana Paraskova for Oilprice.com 

Link to original article: https://oilprice.com/Energy/Crude-Oil/Coke-Meth-And-Booze-The-Flip-Side-Of-The-Permian-Oil-Boom.html


The Analytical Overview of the Main Currency Pairs on 2018.07.30

Analytics by JustForex

The EUR/USD currency pair

Technical indicators of the currency pair:
  • Prev Open: 1.16417
  • Open: 1.16570
  • % chg. over the last day: +0.13
  • Day’s range: 1.16444 – 1.16727
  • 52 wk range: 1.0571 – 1.2557

On Friday, there was a variety of trends on the EUR/USD currency pair. A report on the US GDP was published, according to which the indicator grew to 4.1% in the second quarter, as experts expected. At the moment, the technical pattern is ambiguous: quotes are in a sideways trend. The key support and resistance levels are 1.16450 and 1.16750, respectively. We recommend opening positions from these marks.

The news feed on 2018.07.30:
  • – German consumer price index at 15:00 (GMT+3:00);
  • – Pending home sales index in the US at 17:00 (GMT+3:00).
EUR/USD

Indicators do not send accurate signals: 50 MA crossed 200 MA.

The MACD histogram is near the 0 mark. There are no accurate signals.

Stochastic Oscillator is in the neutral zone, the %K line is above the %D line, which signals to buy EUR/USD.

Trading recommendations
  • Support levels: 1.16450, 1.16100, 1.15800
  • Resistance levels: 1.16750, 1.17100, 1.17400

If the price fixes below 1.16450, we recommend considering sales of EUR/USD. The movement is tending to 1.16100-1.15800.

Alternative option. If the price fixes above the resistance level of 1.16750, the EUR/USD quotes are expected to rise. The movement is tending to 1.17100-1.17400.

The GBP/USD currency pair

Technical indicators of the currency pair:
  • Prev Open: 1.31075
  • Open: 1.31090
  • % chg. over the last day: +0.05
  • Day’s range: 1.30927 – 1.31196
  • 52 wk range: 1.2361 – 1.4345

The technical pattern on the GBP/USD currency pair is ambiguous. Quotes are moving in flat. Investors expect additional drivers. At the moment, the local support and resistance levels are still 1.31000 and 1.31400, respectively. The positions should be opened from these marks.

Today, the publication of important news from the UK is not expected.

GBP/USD

The price has fixed above 50 MA and 200 MA, which indicates the power of buyers.

The MACD histogram is near the 0 mark.

Stochastic Oscillator is located near the overbought zone, the %K line is above the %D line, which gives a signal to buy GBP/USD.

Trading recommendations
  • Support levels: 1.31000, 1.30600, 1.30100
  • Resistance levels: 1.31400, 1.31800, 1.32100

If the price fixes above 1.31400, we recommend considering purchases of GBP/USD. The movement is tending to 1.31800-1.32100.

Alternative option. If the price fixes below the round level of 1.31000, the GBP/USD currency pair is expected to decline. The movement is tending to 1.30600-1.30300.

The USD/CAD currency pair

Technical indicators of the currency pair:
  • Prev Open: 1.30708
  • Open: 1.30515
  • % chg. over the last day: -0.16
  • Day’s range: 1.30505 – 1.30601
  • 52 wk range: 1.2059 – 1.3795

The USD/CAD currency pair is in a sideways trend. Investors expect additional drivers. The key support and resistance levels are 1.30500 and 1.30800, respectively. The positions should be opened from these marks. We recommend paying attention to the dynamics of oil quotes.

The news feed on the economy of Canada is calm.

USD/CAD

Indicators do not send accurate signals: the price is testing 50 MA.

The MACD histogram is near the 0 mark. There are no signals.

Stochastic Oscillator is in the neutral zone, the %K line is below the %D line, which gives a signal to sell USD/CAD.

Trading recommendations
  • Support levels: 1.30500, 1.30100
  • Resistance levels: 1.30800, 1.31200, 1.31600

If the price fixes below the support level of 1.30500, we recommend considering sales of USD/CAD. The movement is tending to 1.30100-1.29800.

If the price fixes above 1.30800, it is necessary to look for entry points to the market to open long positions. The target movement level is 1.31200-1.31400.

The USD/JPY currency pair

Technical indicators of the currency pair:
  • Prev Open: 111.219
  • Open: 110.936
  • % chg. over the last day: -0.15
  • Day`s range: 110.919 – 110.994
  • 52 wk range: 104.56 – 114.74

The technical pattern on the USD/JPY currency pair is ambiguous. Quotes are in a sideways trend. Investors expect additional drivers. The key support and resistance levels are 110.900 and 111.200, respectively. The positions should be opened from these marks. We recommend paying attention to the 10-year US government bonds yield.

The news feed on the economy of Japan is calm.

USD/JPY

Indicators do not send accurate signals: the price is testing 50 MA.

The MACD histogram is near the 0 mark.

Stochastic Oscillator is located in the neutral zone, the %K line is below the %D line, which indicates a decrease in quotes.

Trading recommendations
  • Support levels: 110.900, 110.600
  • Resistance levels: 111.200, 111.600, 112.000

If the price fixes below the support of 110.900, the USD/JPY currency pair is expected to decline. The movement is tending to 110.600-110.300.

Alternative option. If the price fixes above the level of 111.200, it is necessary to consider purchases of USD/JPY. The movement is tending to 111.600-111.800.

Analytics by JustForex


The US Dollar Weakened Despite Data on GDP

by JustForex

On Friday, the US currency weakened against the basket of major currencies despite a positive report on GDP. The value rose to 4.1% in the second quarter, as experts expected. The growth of the US economy gives grounds for the Fed to adhere to a gradual increase in the interest rate. However, the tension between the US and trading partners is still high. The US dollar index (#DX) closed in the negative zone (-0.08%).

This week, economic reports from the US, Japan, the Eurozone and the UK will be in the focus of attention. Also, the conflict between the US and China is still not closed. It is expected that on Wednesday the United States will introduce again additional duties on Chinese goods $16 billion worth. China is likely to respond the same. We recommend following the economic calendar, as well as the up-to-date information regarding the trade war.

The “black gold” prices are consolidating. At the moment, futures for the WTI crude oil are testing a mark of $69.00 per barrel.

Market Indicators

On Friday, the bearish sentiment was observed in the US stock market: #SPY (-0.68%), #DIA (-0.34%), #QQQ (-1.35%).

At the moment, the 10-year US government bonds yield is at the level of 2.96-2.97%.

The news feed on 2018.07.30:

– German consumer price index at 15:00 (GMT+3:00);
– Pending home sales index in the US at 17:00 (GMT+3:00).

by JustForex