As we can see in the H4 chart, USDCAD continues falling; from time to time, it forms slight pullbacks with Hammer, Inverted Hammer, and Doji reversal patterns. Right now, it may be assumed that the instrument continues trading downwards.
AUDUSD, “Australian Dollar vs US Dollar”
As we can see in the H4 chart, AUDUSD continues moving sideways with pullbacks towards support and resistance levels, where it is forming Harami, Hammer, and Engulfing reversal patterns. Right now, the pair is being corrected again. Judging by the previous movements, it may be assumed that the instrument may complete the correction and then continue moving upwards.
Attention! Forecasts presented in this section only reflect the author’s private opinion and should not be considered as guidance for trading. RoboForex LP bears no responsibility for trading results based on trading recommendations described in these analytical reviews.
AUDUSD is trading at 0.7388; the instrument is moving below Ichimoku Cloud, which means that it may continue falling. The markets could indicate that the price may test the downside border of the cloud at 0.7395 and then resume moving downwards to reach 0.7325. However, the scenario that Implies further decline may be cancelled if the price breaks the upside border of the cloud and fixes above 0.7420. In this case, the pair may continue growing towards 0.7465. After breaking the downside border of the Triangle pattern and fixing below 0.7365, the price may continue moving downwards.
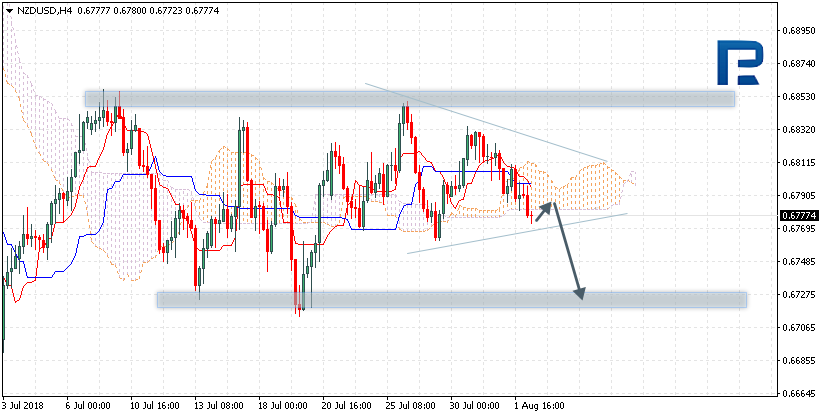
NZDUSD, “New Zealand Dollar vs US Dollar”
NZDUSD is trading at 0.6777; the instrument is moving below Ichimoku Cloud, which means that it may continue falling. The markets could indicate that the price may test the downside border of the cloud at 0.6785 and then continue moving downwards to reach 0.6735. However, the scenario that implies further decline may be cancelled if the price breaks the upside border of the cloud and fixes above 0.6815. In this case, the pair may continue growing towards 0.6850. After breaking the downside border of the Triangle pattern and fixing below 0.6760, the price may continue moving downwards.
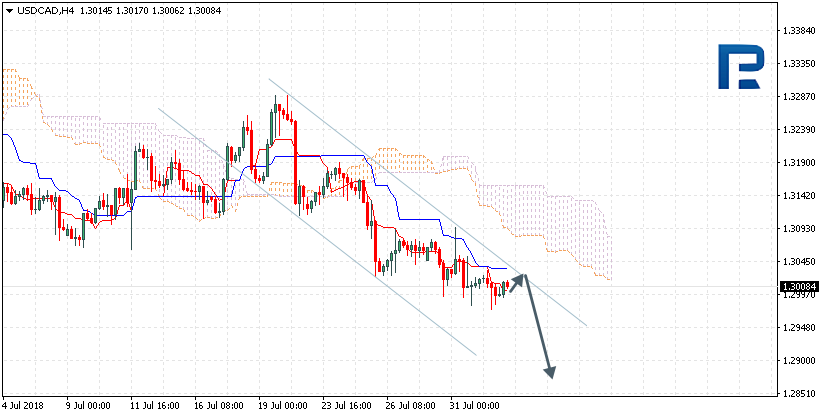
USDCAD, “US Dollar vs Canadian Dollar”
USDCAD is trading at 1.3008; the instrument is moving below Ichimoku Cloud, which means that it may continue falling. The markets could indicate that the price may test Tenkan-Sen and Kijun-Sen at 1.3015 and then continue moving downwards to reach 1.2890. Another signal to confirm further descending movement is the price’s rebounding from the channel’s upside border. However, the scenario that implies further decline may be cancelled if the price breaks the upside border of the cloud and fixes above 1.3140. In this case, the pair may continue growing towards 1.3285.
Attention! Forecasts presented in this section only reflect the author’s private opinion and should not be considered as guidance for trading. RoboForex LP bears no responsibility for trading results based on trading recommendations described in these analytical reviews.
On Wednesday the 1st of August trading on bitcoin closed down. That being said, buyers managed to recover most of their losses after hitting a new low. As a result, a candlestick with a long tail was formed. Because of its large body, it does not count as a reversal.
Today I expect the continuation of the upward correction to the 7,830-8,000 USD zone. The zone is a strong resistance. If buyers can pass it, then the change from the bull phase to the bearish will be delayed for three days.
According to the forecast, I had envisaged bitcoin to grow to 7,920 USD. There is such potential for the emerging price model, although this would hinder the continuation of the downward movement. If the price increase stops at around $7,830 and the price bounces from there by 1.5%, then be prepared for $7,000 to be tested.
Earlier, we reported that the XBTUSD pair had begun a phase of decline, and if the pressure on bitcoin in the coming days increases, then buyers would need to defend the level of $6,800, otherwise you can forget about the rally at the end of the year.
The US dollar slightly strengthened against the basket of major currencies. Yesterday, the Fed left the interest rate unchanged at 1.75-2.00%, as experts supposed. The regulator noted the stable growth of the US economy. Demand for the American currency is still high. The US dollar index (#DX) closed in the positive zone (+0.19%).
Yesterday, economic data were also published in the Eurozone, the United Kingdom and the United States. So, the index of economic activity in the manufacturing sector in Germany counted to 56.9 in July and was worse than the forecasted value of 57.3. The index of economic activity in the UK manufacturing sector counted to 54.0 in July, while experts expected 54.2. ADP nonfarm employment change in the US rose to 219K in July instead of the forecasted value of 186K. The index of economic activity in the US manufacturing sector from the ISM counted to 58.1 in July, although investors expected 59.4. Today, financial market participants took a wait-and-see attitude before the Bank of England interest rate decision.
The “black gold” prices are recovering after a sharp fall the day before. At the moment, futures for the WTI crude oil are testing a mark of $67.80 per barrel.
Market Indicators
Yesterday, there was a variety of trends in the US stock market: #SPY (-0.17%), #DIA (-0.42%), #QQQ (+0.38%).
At the moment, the 10-year US government bonds yield is at the level of 2.98-2.99%.
The news feed on 2018.08.02:
– The index of economic activity in the UK construction sector at 11:30 (GMT+3:00); – Bank of England interest rate decision and inflation report at 14:00 (GMT+3:00).
On Wednesday the 1st of August, trading on the euro closed down against the US dollar. The euro’s slide was brought about by growth on the dollar across the board as well as a rise in US10Y bond yields.
Bond yields hit 3% ahead of the conclusion of the Federal Reserve’s two-day meeting as well as in response to the US Treasury announcing plans to raise long-term debt issuance to 78bn USD in this quarter, compared to 73bn USD in the previous quarter.
The Federal Open Market Committee (FOMC) decided to leave interest rates unchanged at 1.75 – 2.00%. This decision matched market expectations. In its statement on monetary policy, the FOMC said that it expects to raise interest rates gradually. The euro closed at 1.1659.
US data:
ISM manufacturing PMI (Jul): 58.1 (forecast: 59.5, previous: 60.2).
ADP employment change (Jul): 219k (forecast: 186k, previous reading revised from 177k to 181k).
Day’s news (GMT+3):
11:30 UK: PMI construction (Jul).
12:00 Eurozone: PPI (Jun).
14:00 UK: BoE interest rate decision – Markets expect the regulator to raise the key rate by 0.25% to 0.75%. Volatility will be high despite the fact that this has already been factored into the price.
14:30 UK: BoE’s Governor Carney speech.
15:30 US: initial jobless claims (27 Jul).
17:00 US: factory orders (Jun).
Fig 1. EURUSD hourly chart. Source: TradingView
Current situation:
My two-day forecast has worked out. The euro rose to 1.1748, and then over the course of 39 hours, returned to the lower boundary of the range at 1.1650.
In Asia, the euro dropped to 1.1654 against the greenback. In my new forecast, I’m expecting a rebound from the support with a target around the 45th degree. I don’t know what the low will be in the Asian session, but I’ve made my calculation from 1.1650.
I don’t see the euro going any higher than 1.1705, because there’s a risk of dropping to 1.1615. According to the US Trade Representative Robert Lighthizer, on Wednesday, President Trump ordered an increase in tariffs on 200bn USD worth of Chinese goods from 10% to 25%. Most of the euro crosses are trading up, but there’s no guarantee that investors won’t start retreating to the safe haven assets.
Today’s key event is the Bank of England’s interest rate decision and Mark Carney’s subsequent speech. The market is expecting a 25 base point hike to bring the key rate to 0.75%. Volatility is expected to be high, despite the fact that the market has already factored in this rise. No one knows what Carney will say, so keep an eye on the dynamics of the EURGBP pair.
US10Y bond yields are at 3%. There’s a chance they could rise to 3.02%. If they don’t go any higher, we’ll get a downwards correction to 2.98%, which will be good for the single currency. I’m all for an upwards correction today.
On Wednesday afternoon, AUDUSD is trading downwards after Australia and China published some unimpressive statistics.
The Australian Dollar is falling against the USD in the middle of the week. The current quote for the instrument is 0.7403.
Australia published the AIG Manufacturing Index in July, which disappointed investors. The indicator fell up to 52.0 points after being 57.4 points in the previous month.
The statistics from China weren’t impressive as well. The Caixin Manufacturing PMI in July was worse than expected and moved from 51.0 points to 50.8 points. The indicator was expected to fall, but not so much. The actual reading is the worst over the last 8 months. However, the country’s economy is still improving, because the indicator is above 50 points, a psychologically-crucial level that defines optimism and lack of confidence.
News relating to the increase of the US import duties on Chinese goods is also important for the Aussie. It seems that concerns about American trade aggression weren’t groundless: the USA continues to develop measures to protect their domestic market from outsiders, thus hurting other global economies and China in the first place.
This news are essential for the Australian currency, because China remains the country’s major trade and economic partner.
Attention! Forecasts presented in this section only reflect the author’s private opinion and should not be considered as guidance for trading. RoboForex LP bears no responsibility for trading results based on trading recommendations described in these analytical reviews.
During yesterday’s trading session, there was a variety of trends on the EUR/USD currency pair. Yesterday, important economic statistics from the US and the Eurozone were published. Today, investors took a wait-and-see position before the Fed interest rate decision. It is expected that the regulator will leave the interest rate unchanged at 2.00%. At the moment, the technical pattern is ambiguous: a trading instrument is in a sideways trend. The key support and resistance levels are 1.16700 and 1.17000, respectively. We recommend opening positions from these marks.
The news feed on 2018.08.01:
– The index of economic activity in the manufacturing sector in Germany at 10:55 (GMT+3:00);
– ADP nonfarm employment change at 15:15 (GMT+3:00);
– The index of economic activity in the US manufacturing sector from ISM at 17:00 (GMT+3:00);
– Fed interest rate decision at 21:00 (GMT+3:00).
Indicators do not send accurate signals: the price is testing 200 MA.
The MACD histogram is in the negative zone, but above the signal line, which gives a weak signal to sell EUR/USD.
Stochastic Oscillator is in the neutral zone, the %K line is above the %D line, which indicates the growth of the currency pair.
Trading recommendations
Support levels: 1.16700, 1.16400, 1.16100
Resistance levels: 1.1700, 1.17300, 1.17600
If the price fixes below 1.16700, we recommend considering sales of EUR/USD. The movement is tending to 1.16400-1.16100.
Alternative option. If the price fixes above the already “mirror” resistance level of 1.17000, the EUR/USD quotes are expected to grow. The movement is tending to 1.17300-1.17600.
The GBP/USD currency pair
Technical indicators of the currency pair:
Prev Open: 1.31359
Open: 1.31179
% chg. over the last day: -0.11
Day’s range: 1.31083 – 1.31265
52 wk range: 1.2361 – 1.4345
Yesterday, there was a variety of trends on the GBP/USD currency pair. At the moment, the technical pattern is ambiguous. Local support and resistance levels are 1.30900 and 1.31300, respectively. The positions should be opened from these marks. We recommend paying attention to the news feed of the United Kingdom and the United States.
At 11:30 (GMT+3:00), the index of economic activity in the UK manufacturing sector will be published.
The price has fixed below 50 MA and 200 MA, which indicates the power of sellers.
The MACD histogram is in the negative zone, but above the signal line, which gives a weak signal to sell GBP/USD.
Stochastic Oscillator is located near the overbought zone, the %K line is above the %D line, which gives a signal to buy GBP/USD.
Trading recommendations
Support levels: 1.30900, 1.30500, 1.30000
Resistance levels: 1.31300, 1.31700, 1.32000
If the price fixes below 1.30900, we recommend looking for entry points to the market to open short positions. The movement is tending to 1.30500-1.30300.
Alternative option. If the price fixes above the resistance of 1.31300, the GBP/USD currency pair is expected to grow. The movement is tending to 1.31700-1.32000.
The USD/CAD currency pair
Technical indicators of the currency pair:
Prev Open: 1.30315
Open: 1.30117
% chg. over the last day: -0.13
Day’s range: 1.30152 – 1.30254
52 wk range: 1.2059 – 1.3795
During yesterday’s trading, the USD/CAD currency pair slightly weakened. The Canadian dollar was supported by positive statistics on Canada GDP. The indicator rose to 0.5% in May, although investors forecasted a value of 0.3%. At the moment, the technical pattern is ambiguous. Local support and resistance levels are 1.30000 and 1.30350, respectively. The positions should be opened from these marks. We recommend paying attention to the dynamics of oil quotes, as well as to economic statistics from the US.
The news feed on the economy of Canada is calm.
Indicators point to the power of sellers: the price has fixed below 50 MA and 200 MA.
The MACD histogram is in the negative zone, but above the signal line, which gives a weak signal to sell USD/CAD.
Stochastic Oscillator is in the neutral zone, the %K line is below the %D line, which also gives a signal to sell USD/CAD.
Trading recommendations
Support levels: 1.30000, 1.29600
Resistance levels: 1.30350, 1.30800, 1.31300
If the price fixes below the round level of 1.30000, we recommend considering sales of USD/CAD. The movement is tending to 1.29600-1.29400.
If the price fixes above 1.30350, it is necessary to look for entry points to the market to open long positions. The target movement level is 1.30800-1.31000.
The USD/JPY currency pair
Technical indicators of the currency pair:
Prev Open: 111.120
Open: 111.787
% chg. over the last day: +0.69
Day`s range: 112.084 – 112.105
52 wk range: 104.56 – 114.74
The bullish sentiment is observed on the USD/JPY currency pair. During yesterday’s and today’s trading sessions, the growth of quotes has exceeded 100 points. At the moment, the trading instrument is moving in the range of 111.850-112.200. Positions should be opened from the key support and resistance levels. The trading instrument has the potential for further growth.
The news feed on the economy of Japan is calm.
Indicators point to the power of buyers: the price has fixed above 50 MA and 200 MA.
The MACD histogram is in the positive zone, but below the signal line, which gives a weak signal to buy USD/JPY.
Stochastic Oscillator is located in the overbought zone, the %K line has crossed the %D line. There are no accurate signals.
Trading recommendations
Support levels: 111.850, 111.500, 111.150
Resistance levels: 112.200, 112.550, 112.850
If the price fixes above the resistance level of 112.200, further growth of the USD/JPY quotes is expected. The movement is tending to 112.550-112.850.
Alternative option. If the price fixes below the level of 111.850, we recommend considering sales of USD/JPY. The movement is tending to 111.500-111.150.
On Tuesday the 31st of July, trading on the euro closed down. In the US session, the dollar recovered its daily losses and moved into positive territory against the majors. It got a boost from positive US data as well as a Bloomberg report. The euro dropped from its high of 1.1748 to 1.1684.
Consumer spending and the consumer confidence index both rose. The Chicago PMI also exceeded market expectations.
The US and China are trying to revive talks in an attempt to alleviate the tensions in their trade relationship. A meeting between representatives of both countries is planned for this week.
US data:
Consumer confidence index (Jul): 127.4 (forecast: 126.5, previous reading revised from 126.4 to 127.1).
Chicago PMI (Jul): 65.5 (forecast: 63.0, previous: 64.1).
Personal income (Jun): +0.4%.
Personal spending (Jun): +0.4%.
Day’s news (GMT+3):
10:50 France: Markit manufacturing PMI (Jul).
10:55 Germany: Markit manufacturing PMI (Jul).
11:00 Eurozone: Markit manufacturing PMI (Jul).
11:30 UK: Markit manufacturing PMI (Jul).
15:15 US: ADP employment change (Jul).
16:45 US: Markit manufacturing PMI (Jul).
17:00 US: ISM manufacturing PMI (Jul).
17:30 US: EIA crude oil stocks change (27 Jul).
21:00 US: Fed interest rate decision and monetary policy statement.
Fig 1. EURUSD hourly chart. Source: TradingView
Current situation:
The upper boundary of the range was tested just as I expected. The rate jumped to 1.1748 and returned to the balance line. At the time of writing this review, the euro is trading at 1.1683. My forecast expects the euro to slide further against the dollar to around 1.1640/45.
The centre of attention today will be the FOMC meeting. At 21:00 (GMT+3), the US Fed will announce its decision on interest rates. No one is expecting a hike. There will be no press conference with Jerome Powell to follow. Everyone is anticipating the accompanying statement in order to get an idea of what to expect at the next meeting.
I’m not going to take any notice of today’s PMI data. They tend not to influence the market. The British PMI, however, does have the potential to shake up the GBP pairs. So, keep an eye on the EURGBP pair at 11:30 (GMT+3) today. Hopefully, the EURUSD will drop to 1.1645 ahead of the Fed’s rate statement.
The US currency strengthened against the basket of major currencies. The US dollar was supported by the CB consumer confidence index published yesterday, the value of which counted to 127.4 in July, while experts expected 126.5. It has also become known that the US and China intend to repeat negotiations in order to avoid a trade war. The US dollar index (#DX) closed yesterday in the positive zone (+0.23%). Today, investors took a wait-and-see position before the Fed meeting. It is expected that the regulator will leave the interest rate unchanged at 2.00%.
Yesterday, important economic statistics were also published in the Eurozone and Canada. Thus, the number of unemployed in Germany reduced by 6K, while experts expected a decrease by 10K. The consumer price index in the Eurozone counted to 2.1% and was above the forecasted value of 2.0%. However, GDP (year-on-year) slowed down to 2.1% instead of 2.2%. The indicator of Canada GDP increased to 0.5% in May, although investors forecasted a value of 0.3%.
Today during the Asian trading session, a report on employment change (q/q) in New Zealand has been published. The value counted to 0.5% and was above the forecasted value of 0.4%. However, the unemployment rate in New Zealand rose to 4.5% in the second quarter instead of 4.4%. In China, the index of economic activity in the manufacturing sector from Caixin was published, which counted to 50.8 in July, while investors forecasted a value of 50.9.
The “black gold” prices are declining due to the increase in supply. At the moment, futures for the WTI crude oil are testing a mark of $68.10 per barrel. At 17:30 (GMT+3:00), a report on the US crude oil inventories will be published.
Market Indicators
Yesterday, the bullish sentiment was observed in the US stock market: #SPY (+0.49%), #DIA (+0.51%), #QQQ (+0.77%).
At the moment, the 10-year US government bonds yield is at the level of 2.96-2.97%.
The news feed on 2018.08.01:
– The index of economic activity in the manufacturing sector in Germany at 10:55 (GMT+3:00); – The index of economic activity in the UK manufacturing sector at 11:30 (GMT+3:00); – ADP nonfarm employment change at 15:15 (GMT+3:00); – The index of economic activity in the US manufacturing sector from ISM at 17:00 (GMT+3:00); – Fed interest rate decision at 21:00 (GMT+3:00).
EURUSD has finished the descending impulse. Possibly, today the pair may grow to reach 1.1711 and then trade downwards with the target at 1.1647. After that, the instrument may resume growing towards 1.1680 and then fall to reach 1.1614.
GBPUSD, “Great Britain Pound vs US Dollar”
GBPUSD is moving downwards. Today, the price may fall to break 1.3076 and then continue trading to the downside to reach the short-term target at 1.2982.
USDCHF, “US Dollar vs Swiss Franc”
USDCHF has competed the ascending impulse. Possibly, today the pair may start another correction towards 0.9900 and then form a new ascending structure with the short-term target at 0.9955.
USDJPY, “US Dollar vs Japanese Yen”
USDJPY has almost finished the ascending correctional structure. Today, the price may fall to reach 111.44 and then form a new ascending structure towards 112.30. Later, the market may continue falling with the first target at 110.10.
AUDUSD, “Australian Dollar vs US Dollar”
AUDUSD is moving downwards. Possibly, the pair may reach 0.7366. After that, the instrument may break this level and then form another descending structure towards the short-term target at 0.7290.
USDRUB, “US Dollar vs Russian Ruble”
USDRUB is consolidating around 62.37. If later the instrument breaks this range to the upside, the price may start another correction towards 63.06; if to the downside – continue falling to reach 61.61.
XAUUSD, “Gold vs US Dollar”
Gold is consolidating near the lows. Possibly, the pair may continue falling towards 1207.00. Later, the market may return to 1221.00 and then resume trading to the downside with the target at 1205.00.
BRENT
Brent is falling with the target at 73.15. Possibly, today the pair may grow to reach 74.44. After that, the instrument may form another descending structure towards 73.15 and then start a new growth with the target at 76.00.
Attention! Forecasts presented in this section only reflect the author’s private opinion and should not be considered as guidance for trading. RoboForex LP bears no responsibility for trading results based on trading recommendations described in these analytical reviews.