Author Archive for InvestMacro – Page 380

The Analytical Overview of the Main Currency Pairs on 2018.08.09

Analytics by JustForex

The EUR/USD currency pair

Technical indicators of the currency pair:
  • Prev Open: 1.15980
  • Open: 1.16098
  • % chg. over the last day: +0.09
  • Day’s range: 1.15934 – 1.16046
  • 52 wk range: 1.0571 – 1.2557

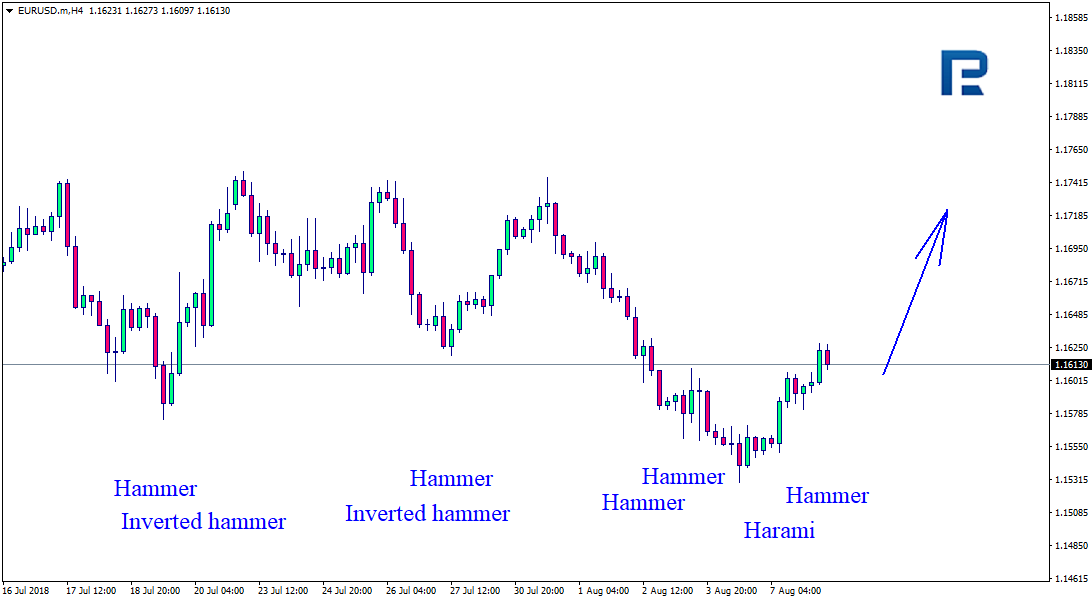
Yesterday, there was a variety of trends on the EUR/USD currency pair. At the moment, the technical pattern is ambiguous. Investors expect additional drivers. The key support and resistance levels are 1.15800 and 1.16150, respectively. We recommend opening positions from these marks.

The news feed on 2018.08.09:
  • – The number of initial jobless claims in the US at 15:30 (GMT+3:00);
  • – Producer price index in the US at 15:30 (GMT+3:00).
EUR/USD

Indicators do not send accurate signals. The price has crossed 200 MA.

The MACD histogram is located near the 0 mark.

Stochastic Oscillator is in the neutral zone, the %K line is below the %D line, which signals to sell EUR/USD.

Trading recommendations
  • Support levels: 1.15800, 1.15400
  • Resistance levels: 1.16150, 1.16600, 1.17000

If the price fixes above the resistance level of 1.16150, the EUR/USD quotes are expected to rise. The movement is tending to 1.16600-1.16800.

Alternative option. If the price fixes below the support level of 1.15800, it is necessary to consider sales of EUR/USD. The movement is tending to 1.15400-1.15200.

The GBP/USD currency pair

Technical indicators of the currency pair:
  • Prev Open: 1.29378
  • Open: 1.28790
  • % chg. over the last day: -0.48
  • Day’s range: 1.28446 – 1.29757
  • 52 wk range: 1.2361 – 1.4345

The bearish sentiment prevails on the GBP/USD currency pair. During yesterday’s and today’s trading sessions, quotes have been decreased by more than 100 points. Investors are still concerned about the consequences of Brexit. At the moment, the local support and resistance levels are 1.28350 and 1.28800, respectively. The trading instrument has the potential for further reduce.

The news feed on the UK economy is calm.

GBP/USD

Indicators point to the power of sellers: the price has fixed below 50 MA and 200 MA.

The MACD histogram is in the negative zone and continues to decline, which gives a strong signal to sell GBP/USD.

Stochastic Oscillator is located in the neutral zone, the %K line is below the %D line, which also indicates the bearish sentiment.

Trading recommendations
  • Support levels: 1.28350, 1.28000
  • Resistance levels: 1.28800, 1.29400, 1.30000

If the price fixes below 1.28350, the GBP/USD quotes are expected to fall. The movement is tending to 1.28000-1.27750.

Alternative option. If the price fixes above the resistance of 1.28800, correction movement is expected. The movement is tending to 1.29200-1.29500.

The USD/CAD currency pair

Technical indicators of the currency pair:
  • Prev Open: 1.30521
  • Open: 1.30481
  • % chg. over the last day: -0.25
  • Day’s range: 1.30125 – 1.30210
  • 52 wk range: 1.2059 – 1.3795

Yesterday, aggressive sales were observed on the USD/CAD currency pair. Quotes rose, but then fell by more than 100 points. At the moment, the technical pattern is ambiguous. The key support and resistance levels are 1.30000 and 1.30300, respectively. The USD/CAD currency pair is tending to grow.

Today, the news feed on the economy of Canada is calm.

USD/CAD

Indicators do not send accurate signals: the price has crossed 50 MA and 200 MA.

The MACD histogram is in the negative zone and below the signal line, which gives a signal to sell USD/CAD.

Stochastic Oscillator is located in the neutral zone, the %K line has crossed the %D line. There are no signals at the moment.

Trading recommendations
  • Support levels: 1.30000, 1.29700
  • Resistance levels: 1.30300, 1.30600, 1.30900

If the price fixes above the key resistance of 1.30300, the USD/CAD quotes are expected to rise. The target movement level is 1.30600-1.30800.

Alternative option. If the price fixes below the round level of 1.30000, it is necessary to consider sales of USD/CAD. The movement is tending to 1.29700-1.29500.

The USD/JPY currency pair

Technical indicators of the currency pair:
  • Prev Open: 111.357
  • Open: 110.967
  • % chg. over the last day: -0.43
  • Day`s range: 110.966 – 111.034
  • 52 wk range: 104.56 – 114.74

During yesterday’s trading session, a downward trend was observed on the USD/JPY currency pair. Quotes fell by more than 70 points. At the moment, the USD/JPY quotes are consolidating. Local support and resistance levels are 110.900 and 111.200, respectively. We recommend paying attention to the dynamics of the US government bonds yield. Further growth of the currency pair is not excluded.

The news feed on the economy of Japan is calm.

USD/JPY

The price has fixed below 50 MA and 200 MA, which indicates the power of sellers.

The MACD histogram is in the negative zone, but above the signal line, which gives a weak signal to sell USD/JPY.

Stochastic Oscillator is located in the overbought zone, the %K line is crossing the %D line. There are no accurate signals.

Trading recommendations
  • Support levels: 110.900, 110.650
  • Resistance levels: 111.200, 111.500, 111.800

If the price fixes below 110.900, it is necessary to look for entry points to the market to open short positions. The movement is tending to 110.650-110.500.

An alternative is the USD/JPY quotes growth to 111.500-111.800.

Analytics by JustForex

Currency Majors Showed Mixed Results

by JustForex

During yesterday’s trading, the US dollar fell slightly against the basket of major currencies. As the Office of the US Trade Representative reported, the US authorities would impose a 25% duty on the import of Chinese goods to the United States from August 23. The list of goods subject to sanctions will also be expanded. China, in turn, will impose duties on American goods in the same amount on August 23. Experts believe that the trade war may strengthen. The US dollar index (#DX) closed in the negative zone (-0.11%) yesterday.

The British pound continued to decline due to uncertainty concerning Brexit. Today, during the Asian trading session, the Reserve Bank of New Zealand has decided on the interest rate that counted to 1.75%, as investors expected. China also published positive statistics on consumer prices. We expect important statistics from the US.

The “black gold” prices are moderately recovering after the fall the day before. At the moment, futures for the WTI crude oil are testing a mark of $67.00 per barrel.

Market Indicators

Yesterday, there was a variety of trends in the US stock market: #SPY (-0.04%), #DIA (-0.20%), #QQQ (+0.12%).

At the moment, the 10-year US government bonds yield is at the level of 2.95% -2.96%.

The news feed on 2018.08.09:

– The number of initial jobless claims in the US at 15:30 (GMT+3:00);
– Producer price index in the US at 15:30 (GMT+3:00).

by JustForex

Japanese Candlesticks Analysis 08.08.2018 (EURUSD, USDJPY)

Article By RoboForex.com

EURUSD, “Euro vs. US Dollar”

As we can see in the H4 chart, after reaching the support level once again and forming several Hammer and Harami reversal patterns there, EURUSD has rebounded from it. At the moment, it may be assumed that the instrument is trying to start another ascending movement.

EURUSD
Risk Warning: the result of previous trading operations do not guarantee the same results in the future


USDJPY, “US Dollar vs. Japanese Yen”

As we can see in the H4 chart, USDJPY is still trading close to the support level and forming Doji, Hammer, and Engulfing reversal patterns. Judging by the previous movement, it may be assumed that the instrument may complete its sideways movement soon, rebound from the support level, and start a new rising tendency.

USDJPY
Risk Warning: the result of previous trading operations do not guarantee the same results in the future

Article By RoboForex.com

Attention!
Forecasts presented in this section only reflect the author’s private opinion and should not be considered as guidance for trading. RoboForex LP bears no responsibility for trading results based on trading recommendations described in these analytical reviews.

The Analytical Overview of the Main Currency Pairs on 2018.08.08

Analytics by JustForex

The EUR/USD currency pair

Technical indicators of the currency pair:
  • Prev Open: 1.15233
  • Open: 1.15980
  • % chg. over the last day: +0.42
  • Day’s range: 1.15939 – 1.16281
  • 52 wk range: 1.0571 – 1.2557

The euro has started recovering. During yesterday’s and today’s trading, growth of the EUR/USD quotes has exceeded 70 points. At the moment, the price is testing the “mirror” resistance of 1.16250. The round level of 1.16000 is a key support. The trading instrument has the potential for further correction.

Today, the news feed is calm. The publication of important economic reports is not planned.

EUR/USD

The signals of the indicators are different. The price has fixed between 50 MA and 200 MA.

The MACD histogram is located in the positive zone and above the signal line, which indicates the bullish sentiment.

Stochastic Oscillator is in the neutral zone, the %K line is below the %D line, which signals to sell EUR/USD.

Trading recommendations
  • Support levels: 1.16000, 1.15650, 1.15350
  • Resistance levels: 1.16250, 1.16550, 1.16750

If the price fixes above the resistance level of 1.16250, the EUR/USD quotes are expected to grow. The movement is tending to 1.16500-1.16750.

Alternative option. If the price fixes below the round level of 1.16000, it is necessary to consider sales of EUR/USD. The movement is tending to 1.15700-1.15500.

The GBP/USD currency pair

Technical indicators of the currency pair:
  • Prev Open: 1.29445
  • Open: 1.29378
  • % chg. over the last day: +0.02
  • Day’s range: 1.29282 – 1.29596
  • 52 wk range: 1.2361 – 1.4345

The technical pattern on the GBP/USD currency pair is ambiguous. Quotes are in a sideways trend. The pound is testing annual lows. Investors are still concerned about the consequences of Brexit. At the moment, the local support and resistance levels are 1.29250 and 1.29600, respectively. In the near future, we do not rule out a technical correction.

The news feed on the UK economy is calm.

GBP/USD

Indicators do not send accurate signals. The price is testing 50 MA.

The MACD histogram is in the negative zone, but above the signal line, which gives a weak signal to sell GBP/USD.

Stochastic Oscillator is located in the neutral zone, the %K line is below the %D line, which indicates the bearish sentiment.

Trading recommendations
  • Support levels: 1.29250, 1.29000
  • Resistance levels: 1.29600, 1.29800, 1.30300

If the price fixes below 1.29250, the GBP/USD quotes are expected to fall. The movement is tending to 1.29000-1.28750.

Alternative option. If the price fixes above the resistance of 1.29600, correction movement is expected. The movement is tending to the round level of 1.30000.

The USD/CAD currency pair

Technical indicators of the currency pair:
  • Prev Open: 1.30025
  • Open: 1.30521
  • % chg. over the last day: +0.42
  • Day’s range: 1.30491 – 1.30736
  • 52 wk range: 1.2059 – 1.3795

Yesterday, the Canadian dollar significantly weakened against the US dollar. The trading instrument has updated local extremes. This is due to the publication of weak data on economic activity from Ivey in Canada. At the moment, the USD/CAD quotes are consolidating in the range of 1.30500-1.30750. The USD/CAD currency pair has the potential for further growth.

Today, the news feed is rather calm:
  • – Building permits in Canada at 15:30 (GMT+3:00).
USD/CAD

Indicators point to the power of buyers: the price has fixed above 50 MA and 200 MA.

The MACD histogram is in the positive zone, but below the signal line, which gives a weak signal to buy USD/CAD.

Stochastic Oscillator is located in the neutral zone, the %K line is above the %D line, which also gives a signal to buy.

Trading recommendations
  • Support levels: 1.30500, 1.30300, 1.30000
  • Resistance levels: 1.30750, 1.31200

If the price fixes above the key resistance of 1.30750, we recommend considering purchases of USD/CAD. The target movement level is 1.31000-1.31200.

Alternative option. If the price fixes below 1.30500, it is necessary to consider sales of USD/CAD. The movement is tending to 1.30300-1.30100.

The USD/JPY currency pair

Technical indicators of the currency pair:
  • Prev Open: 111.322
  • Open: 111.357
  • % chg. over the last day: -0.05
  • Day`s range: 110.837 – 111.437
  • 52 wk range: 104.56 – 114.74

The USD/JPY currency pair is declining. The trading instrument has overcome the round level of 111.000, which is already a “mirror” resistance. The key support is 110.650. The USD/JPY quotes are tending to decline. We recommend paying attention to the dynamics of the US government bonds yield.

The news feed on the economy of Japan is calm.

USD/JPY

The price has fixed below 50 MA and 200 MA, which indicates the power of sellers.

The MACD histogram has started declining and moved to the negative zone, which signals the bearish sentiment.

Stochastic Oscillator is located in the oversold zone, the %K line is crossing the %D line. There are no accurate signals.

Trading recommendations
  • Support levels: 110.650, 110.150, 110.000
  • Resistance levels: 111.000, 111.350, 111.550

If the price fixes below the level of 110.850, it is necessary to look for entry points to the market to open short positions. The movement is tending to 110.500-110.250. When following the positions, we recommend using a trailing stop.

Analytics by JustForex

Ichimoku Cloud Analysis 08.08.2018 (AUDUSD, NZDUSD, USDCAD)

Article By RoboForex.com

AUDUSD, “Australian Dollar vs US Dollar”

AUDUSD is trading at 0.7421; the instrument is moving above Ichimoku Cloud, which means that it may continue growing. The markets could indicate that the price may test the upside border of the cloud at 0.7410 and then resume moving upwards to reach 0.7495. However, the scenario that Implies further growth may be cancelled if the price breaks the downside border of the cloud and fixes below 0.7375. In this case, the pair may continue falling towards 0.7465. After breaking the upside border of the Triangle pattern and fixing above 0.7440, the price may continue moving upwards.

AUDUSD
Risk Warning: the result of previous trading operations do not guarantee the same results in the future


NZDUSD, “New Zealand Dollar vs US Dollar”

NZDUSD is trading at 0.6748; the instrument is moving below Ichimoku Cloud, which means that it may continue falling. The markets could indicate that the price may test Tenkan-Sen and Kijun-Sen at 0.6765 and then continue moving downwards to reach 0.6680. Another signal to confirm further descending movement is the price’s rebounding from the resistance level. However, the scenario that implies further decline may be cancelled if the price breaks the upside border of the cloud and fixes above 0.6815. In this case, the pair may continue growing towards 0.6850. After breaking the downside border of the Triangle pattern and fixing below 0.6705, the price may continue moving downwards.

NZDUSD
Risk Warning: the result of previous trading operations do not guarantee the same results in the future


USDCAD, “US Dollar vs Canadian Dollar”

USDCAD is trading at 1.3067; the instrument is moving inside Ichimoku Cloud, which means that it is moving sideways. The markets could indicate that the price may test the downside border of the cloud at 1.3015 and then continue moving upwards to reach 1.3175. Another signal to confirm further ascending movement is the price’s rebounding from the channel’s upside border. However, the scenario that implies further growth may be cancelled if the price breaks the downside border of the cloud and fixes below 1.2975. In this case, the pair may continue falling towards 1.2895.

USDCAD
Risk Warning: the result of previous trading operations do not guarantee the same results in the future

Article By RoboForex.com

Attention!
Forecasts presented in this section only reflect the author’s private opinion and should not be considered as guidance for trading. RoboForex LP bears no responsibility for trading results based on trading recommendations described in these analytical reviews.

The US Currency Weakened

by JustForex

The US dollar slightly weakened against the basket of major currencies during yesterday’s trading. The US dollar index (#DX) closed in the negative zone (-0.20%). Yesterday, a report on JOLTS job openings was published. In June, the number of jobs increased to 6.662M, but it was still worse than the forecasts of investors who expected the value of 6.740M. In May, the value was revised from 6.638M to 6.659M.

The Canadian dollar fell against the US dollar. The index of business activity from Ivey counted to 61.8 in July and was worse than the forecasted value of 64.2. Today, during the Asian trading session, mixed data on China’s trade balance have been also published.

The “black gold” prices are rising after the US sanctions against Iran have again come into effect. At the moment, futures for the WTI crude oil are testing a mark of $69.15 per barrel. At 17:30 (GMT+3:00), a report on the US crude oil inventories will be published.

Market Indicators

Yesterday, the bullish sentiment was observed in the US stock market: #SPY (+0.33%), #DIA (+0.50%), #QQQ (+0.36%).

At the moment, the 10-year US government bonds yield is at the level of 2.96% -2.97%.

by JustForex

EURUSD: the first significant resistance is 1.1665

By Gabriel Ojimadu, Alpari

Previous:

Despite the tense trade relations between the US and China, EURUSD finished trading up on Tuesday. The dollar index corrected from 95.36 to 94.99.

It was under pressure from the European session and fell against the backdrop of growing 10-year US bonds. I believe that this was a technical rebound in light of an empty economic calendar. Today the calendar is also empty. During today’s Asian session, the correction on the dollar index continued.

Day’s news (GMT+3):

  • 06:05 Australia: RBA Governor Lowe speaks.
  • 15:30 Canada: building permits (MoM) (Jun).
  • 17:30 USA: crude oil inventories.
  • 23:00 New Zealand: RBNZ interest rate decision, monetary policy statement, RBNZ press conference.
  • 01:00 New Zealand: RBNZ press conference.

Fig 1. EURUSD hourly chart. Source: TradingView

Current situation:

Expectations were fully justified regarding yesterday’s forecast. Growth was held up at the 67th degree, where it sat for 14 hours, then, during the Asian session, bulls broke through it. The euro is trading at 1.1618 against the session high of 1.1620.

The economic calendar is empty. In terms of significant events there’s the meeting of the RBNZ. As the meeting is going to take place quite late, it will not affect the euro. All is clear up to 1.1665. The 112th degree will act as a strong resistance and we will see what comes of this in the European session on Thursday.

If you paid attention, then you’ll see the euro is fixed at 1.1665 in the form of two triples. At the moment, nothing is preventing the bulls from moving northward. Euro crosses are trading in positive territory. With such a formation, the price should shoot up. A support is passing through 1.1592. A breakout of the channel will quash any growth prospects.

The Trump Administration will impose a 25% tariff on 16bn USD in Chinese goods to the US, starting the 23rd of August. The White House said that tariffs are a response to China’s unfair trade practices related to the forced transfer of American technology and intellectual property. As we can see, the trade war has not lead to anything good. With the escalating the trade conflict, market participants are dropping risky assets. Therefore, the growth of the EURUSD pair may end at any time. If buyers reach the level of 1,1660/65 today, that’s okay with me.

PART II – US Markets Higher Until November 2018

By TheTechnicalTraders.com

Now, we are ready to share some new research that will help all of us understand the current and future market conditions given the ratios of the capital markets to GDP as represented in our previous article Part I.  The research team at www.TheTechnicalTraders.com believe we have identified a means of structurally understanding the US capital markets in relation to risks or reversal and crisis contagion.  As the Buffet Indicator is now warning that the US capital market may be nearing a critical price top, we can now attempt to put this data into perspective in relation to capital flows and capabilities.  Yes, in terms of historical price appreciation, we are now at or near levels that have historically been associated market tops and price collapses.  Let’s look at how the Buffet Indicator has reacted at times using our new Custom Market Cap Volatility Index.


This Daily Custom Market Cap Volatility Index shows data from 2016 until now.  It clearly shows the deeper price rotation near the elections in 2016 and the deep price rotation in February 2018.  Let’s compare these levels to the Buffet Indicator reactions.  In 2016, the Buffet Indicator fell nearly 15% as the US stock market indexes fell 13.5%.  In February 2018, the Buffet Indicator fell nearly 8.5% as the US stock market fell 11.88%.  Our Custom Market Cap Volatility index operates as a range of price rotation that assists us in determining if and when the price is outside normal price ranges.  We are attempting to map price appreciation in relation to volatility in a historical form.  When price retraces or contracts, volatility spikes higher.  With this process of volatility increasing and price decreasing, the increased VIX levels will show up as very deep Custom Market Cap Volatility price corrections.  The VIX will increase much faster than price will collapse, thus any price collapse will likely stay within these ranges, or fall outside these ranges if the price collapse is more extended.

Extended price collapses will result in much higher VIX levels while prices continue to decrease.  If the price collapse is very aggressive, the increase in VIX will shoot higher and our Custom Market Cap Volatility Index will crash to very low levels.  If the price collapse is an orderly price decline, then the VIX levels will increase as price decreases more gradually and the Custom Market Cap Index will likely stay within moderate ranges.  At least we hope this works as we are suggesting.  Let’s take a look a longer-term data.


This Weekly Custom Market Cap Volatility Index shows the same date range as the previous Daily chart.  We should be able to see the Blue channel levels that originate much earlier as normal price channel ranges.  We have added a Std. Deviation channel to this chart originating from the 2010 lows that show the range as associated by the deviation ranges.

This data tells us that US stock market prices have recently rallied from near the middle of these historical channels and still has quite a bit of room to the upside.  This would indicate to us that the US stock market is not overly priced and that capital is still working into the US stock market in ways that support further price appreciation.  Once price reaches above the Std. Deviation channel and above our Blue price channel levels, then we would start to become concerned that prices may retrace as they did in February 2018.

Take a look at the rally from 2016 until now.  Notice how the lows near 2016 represented a relatively depressed price channel range with our Custom Market Cap Volatility Index. In other words, prices were hovering near the lower channels with no real signs of risk as prices did not collapse below these levels.  One correlation we can make with the Buffet Indicator that may become evident in our Custom Market Cap Volatility Index is that as US Bond rates increase, capital is usually moving away from the stock market and into Treasuries.  When we consider the past actions of the US Fed and the correlations of the Buffet Indicator to these central bank actions – we might find a direct correlation.

Yet we believe our Custom Market Cap Volatility Index is valuable for a number of reasons; first, we can use this index as a measure of price rotation and standard deviation low price identification. This will allow us to determine when prices are poised to form a bottom setup and when an opportunity exists for upside price acceleration.  Second, we can identify when prices are nearing the upper channel as an early warning that prices may be attempting to hammer out a longer-term top formation – allowing us to reduce risk and scale back our positions.  Lastly, we can look for cycles that may help us determine key dates for price rotation.

This cycle chart highlights the deeper low price rotations in our Custom Market Cap Volatility Index.  These low points are when the US stock market has seen increases in volatility and moderately deep or deep price corrections.  Notice how the early 2018 price collapse is clearly shown as a very deep price rotation in our Custom Market Cap Volatility Index.  Notice how the 2016 and 2017 deeper price rotation on the Custom Market Cap Volatility Index correlate with price rotation in the US major indexes.  Also, pay attention to the price appreciation that took place after these deeper price corrections.

These cycles suggest that the US stock market should continue to push higher for at least the next 90+ days till near November 2018.  Near this date, there is a relatively strong likelihood that some type of deeper price correction will hit the US markets – possibly a bit sooner or after this date.  The cycle frequency and accuracy of these bottoms suggest that the price of the US stock market will likely push higher over the next 30+ days – then possibly stall while attempting to form a potential top.  It is likely that this top formation or horizontal price range will become extended consolidation before any deeper price correction begins.  In the meantime, we believe the US stock market will continue to push higher as our Custom Market Cap Volatility Index shows.

Our suggestion at this point is that the Buffet Indicator is failing to correlate the global capital pool that exists currently and is also failing to adequately reflect the capital migration that is currently taking place throughout the globe.  We believe the US stock market could continue much higher at this point, depending on how the global markets react to this shift in capital and the longer term debt issues that are playing out.  We certainly don’t want to mislead anyone – so we are alerting you that November or December of 2018 appears to be a time where prices may rotate a bit more violently to the downside.  This may be correlated to some type of global crisis event or it could be an extended capital shift away from the US stock market where capital flees to new opportunities in other global markets.  All we know right now is that the US stock market is still on a path to move higher and we still have quite a bit of room for market cap growth over the next 3+ months.

If you want to know how our other proprietary price modeling systems and indicators help us keep our valued members and subscribers informed of future market moves, then visit www.TheTechnicalTraders.com to learn how we can help you find and execute better trading decisions with our specialized research, daily video updates, detailed trading signals and more.  Don’t let the other news fool you with generic content and comments – true researchers pull from resources or create new resources to give them a much clearer understanding of the market dynamics ahead.  Get ready for further upside prices and watch for an end of year price rotation that could be dramatic.

53 years experience in researching and trading makes analyzing the complex and ever-changing financial markets a natural process. We have a simple and highly effective way to provide our customers with the most convenient, accurate, and timely market forecasts available today. Our stock and ETF trading alerts are readily available through our exclusive membership service via email and SMS text. Our newsletter, Technical Trading Mastery book, and 3 Hour Trading Video Course are designed for both traders and investors. Also, some of our strategies have been fully automated for the ultimate trading experience.

By TheTechnicalTraders.com


The Analytical Overview of the Main Currency Pairs on 2018.08.07

Analytics by JustForex

The EUR/USD currency pair

Technical indicators of the currency pair:
  • Prev Open: 1.15699
  • Open: 1.15233
  • % chg. over the last day: -0.03
  • Day’s range: 1.15760 – 1.15805
  • 52 wk range: 1.0571 – 1.2557

The technical pattern on the EUR/USD currency pair is ambiguous. During yesterday’s trading session, quotes were in a sideways trend. Today, the currency pair has slightly increased, but there is no exact trend. Investors expect additional drivers. The key support and resistance levels are 1.15600 and 1.15900, respectively. We recommend opening positions from these marks. In the near future, the EUR/USD correction is not ruled out.

The news feed on 2018.08.07:
  • – JOLTS job openings in the US at 17:00 (GMT+3:00).
EUR/USD

Indicators do not send accurate signals: the price has fixed between 50 MA and 200 MA.

The MACD histogram is located near the 0 mark.

Stochastic Oscillator is in the neutral zone, the %K line is above the %D line, which indicates the bullish sentiment.

Trading recommendations
  • Support levels: 1.15600, 1.15300
  • Resistance levels: 1.15900, 1.16200, 1.16600

If the price fixes below the support level of 1.15600, the EUR/USD quotes are expected to fall. The movement is tending to 1.15300-1.15000.

Alternative option. If the price fixes above the resistance level of 1.15900, it is necessary to consider purchases of EUR/USD. The movement is tending to 1.16200-1.16400.

The GBP/USD currency pair

Technical indicators of the currency pair:
  • Prev Open: 1.29952
  • Open: 1.29445
  • % chg. over the last day: -0.45
  • Day’s range: 1.29614 – 1.29715
  • 52 wk range: 1.2361 – 1.4345

During yesterday’s trading session, the pound continued to lose ground against the US dollar. The British pound is significantly weakened after a Secretary of State for International Trade Liam Fox announced that the UK is likely to exit from the European Union without signing any agreements. At the moment, the GBP/USD quotes are moving in the range of 1.29400-1.29800. The positions should be opened from these marks.

The news feed on the UK economy is calm.

GBP/USD

Indicators point to the power of sellers. The price has fixed below 50 MA and 200 MA.

The MACD histogram is in the negative zone, but above the signal line, which gives a weak signal to sell GBP/USD.

Stochastic Oscillator is located in the neutral zone, the %K line is crossing the %D line. There are no accurate signals.

Trading recommendations
  • Support levels: 1.29400, 1.29000
  • Resistance levels: 1.29800, 1.30200, 1.30700

If the price fixes below 1.29400, a further decline of the currency pair is expected. The movement is tending to 1.29000-1.28800.

Alternative option. If the price fixes above the resistance of 1.29800, it is necessary to look for entry points to the market to open long positions. The movement is tending to 1.30200-1.30400.

The USD/CAD currency pair

Technical indicators of the currency pair:
  • Prev Open: 1.29925
  • Open: 1.30025
  • % chg. over the last day: -0.09
  • Day’s range: 1.29880 – 1.29943
  • 52 wk range: 1.2059 – 1.3795

Yesterday, there was a variety of trends on the USD/CAD currency pair. At the moment, quotes are declining. Local support and resistance levels are 1.29700 and 1.30000, respectively. The positions should be opened from these marks. We recommend paying attention to the dynamics of oil quotes.

At 17:00 (GMT+3:00) the index of economic activity from Ivey will be published in Canada.

USD/CAD

Indicators point to the power of sellers: the price has fixed below 50 MA and 200 MA.

The MACD histogram is in the negative zone and below the signal line, which gives a strong signal to sell USD/CAD.

Stochastic Oscillator is located in the oversold zone, the %K line is crossing the %D line. There are no accurate signals.

Trading recommendations
  • Support levels: 1.29700, 1.29300, 1.29000
  • Resistance levels: 1.30000, 1.30300, 1.30700

If the price fixes above the round level of 1.30000, we recommend considering purchases of USD/CAD. The target movement level is 1.30300-1.30500.

Alternative option. If the price fixes below 1.29700, the USD/CAD quotes are expected to decline. The movement is tending to 1.29400-1.29200.

The USD/JPY currency pair

Technical indicators of the currency pair:
  • Prev Open: 111.214
  • Open: 111.322
  • % chg. over the last day: +0.09
  • Day`s range: 111.312 – 111.367
  • 52 wk range: 104.56 – 114.74

The technical pattern on the USD/JPY currency pair is ambiguous. The USD/JPY quotes are in a sideways trend. Investors expect additional drivers. Local support and resistance levels are 111.200 and 111.450, respectively. The positions should be opened from these marks.

The news feed on the economy of Japan is calm.

USD/JPY

Indicators do not send accurate signals. 50 MA has crossed 200 MA.

The MACD histogram is near the 0 mark.

Stochastic Oscillator is located in the neutral zone, the %K line is crossing the %D line. There are no accurate signals.

Trading recommendations
  • Support levels: 111.200, 111.000, 110.750
  • Resistance levels: 111.450, 111.700, 112.000

If the price fixes below 111.200, the USD/JPY quotes are expected to decline. The movement is tending to 111.000-110.750.

Alternative option. If the price fixes above the level of 111.450, it is necessary to consider purchases of USD/JPY. The movement is tending to 111.700-112.000.

Analytics by JustForex

Demand for the US Dollar Is Still High

by JustForex

Yesterday, the US currency strengthened against the basket of major currencies. The US dollar index (#DX) updated a two-week high and closed in the positive zone (+0.24%). Investors’ expectations regarding further increase in the key interest rate support the dollar. Last week, the US published mixed data on the labor market. At the same time, the Fed officials note that labor market conditions are good and expect a stable growth in the US economy.

The British pound has updated annual lows after the Secretary of State for International Trade Liam Fox announced that the UK is more likely to exit from the European Union without signing any agreements. The official also accused the European Commission that it did not make concessions and did not seek to achieve economic prosperity.

Today, during the Asian trading session, the Reserve Bank of Australia has decided on the key interest rate. The regulator, as expected, kept the interest rate at the previous level of 1.50%.

The “black gold” prices are rising. At the moment, futures for the WTI crude oil are testing a mark of $69.2 per barrel. At 23:30 (GMT+3:00), a report on the API weekly crude oil stock will be published.

Market Indicators

Yesterday, the bullish sentiment was observed in the US stock market: #SPY (+0.37%), #DIA (+0.18%), #QQQ (+0.59%).

At the moment, the 10-year US government bonds yield is at the level of 2.94-2.95%.

The news feed on 2018.08.07:

– JOLTS job openings in the US at 17:00 (GMT+3:00);
– The index of economic activity in Canada from Ivey at 17:00 (GMT+3:00).

by JustForex