Author Archive for InvestMacro – Page 379

Currency Speculators continue boosting US Dollar bets higher

August 11, 2018 – By CountingPips.comGet our weekly COT Reports by Email

US Dollar aggregate speculator positions rose to $22.02 billion this week

The latest data for the weekly Commitment of Traders (COT) report, released by the Commodity Futures Trading Commission (CFTC) on Friday, showed that large traders and currency speculators continued to boost their bets in favor of the US dollar this week while sharply cutting back on euro and British pound bets.

Non-commercial large futures traders, including hedge funds and large speculators, had an overall US dollar aggregate net position totaling $22.02 billion as of Tuesday August 7th, according to the latest data from the CFTC and dollar amount calculations by Reuters. This was a weekly rise of $1.96 billion from the $20.06 billion total position that was registered the previous week, according to the Reuters calculation (totals of the US dollar contracts against the combined contracts of the euro, British pound, Japanese yen, Australian dollar, Canadian dollar and the Swiss franc).

The aggregate speculative position has now risen for seven out of the past eight weeks to the highest level since January 17th of 2107 when the aggregate measure totaled +$24.44 billion.


US Dollar Index Speculator Positions rise for 16th Straight Week

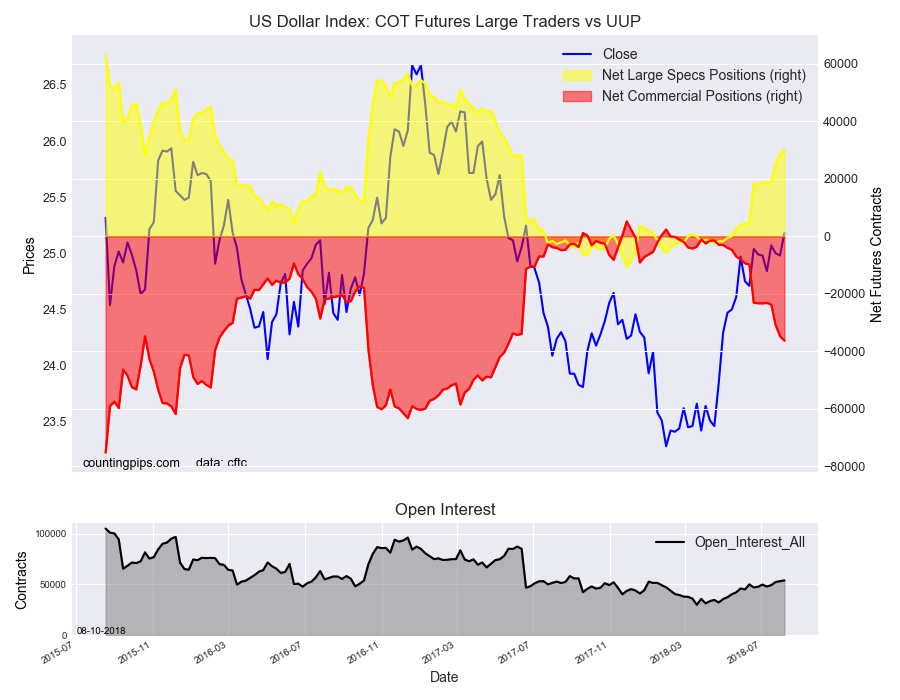
The latest data also showed that currency speculators continued to raise their bets in favor of the US Dollar Index futures for a sixteenth consecutive week.

The non-commercial futures contracts of US Dollar Index futures, traded by large speculators and hedge funds, totaled a net position of 30,102 contracts in the data reported through Tuesday August 7th. This was a weekly gain of 1,646 contracts from the previous week which had a total of 28,456 net contracts.

The bullish improvement in the US Dollar Index positions dates back to April 24th (sixteen straight weeks) and the overall net standing is now at the best level since May 23rd of 2017 when bullish bets equaled 31,324 contracts.


Individual Currency Contracts Data this week

We saw two substantial changes (+ or – 10,000 contracts) in the individual currency contract levels for the speculators category this week.

  • Euro positions dropped this week by over -10,000 bets and fell for a second straight week. The overall net position is now at the lowest level since May 2nd 2017 when net positions totaled -1,653 contracts. The euro position has seen a rather swift decline after reaching a record high bullish position recently on April 17th (+151,476 contracts).
  • British pound sterling positions declined by over -11,000 bets this week and have now dropped for three straight weeks (as well as seven out of the past eight weeks). The bearish net standing is at the highest bearish level since May 2nd of 2017 when the position totaled -81,364 contracts.

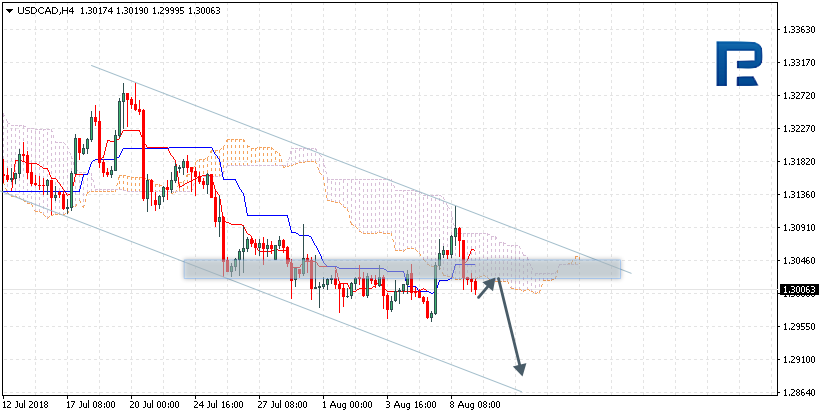
Overall, the non-commercial speculators bet in favor of the US Dollar Index (1,646 weekly change in contracts), Japanese yen (5,650 contracts), Canadian dollar (6,671 contracts) and the Mexican peso (6,745 contracts) this week.

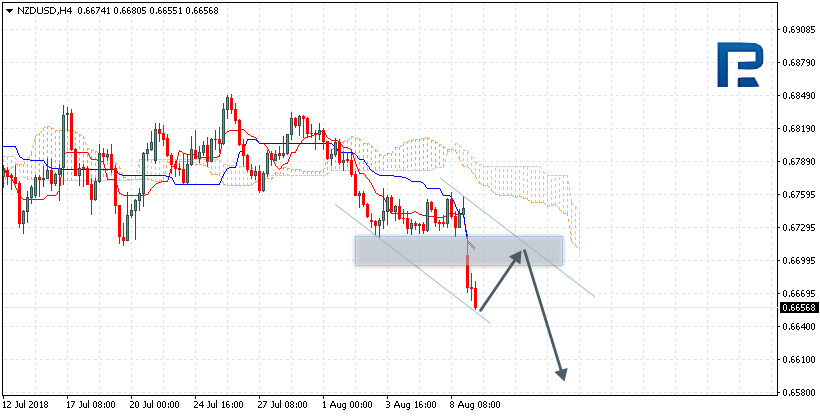
The currencies whose speculative bets declined this week were the euro (-12,260 weekly change in contracts), British pound sterling (-11,466 contracts), Swiss franc (-1,686 contracts),  Australian dollar (-3,064 contracts) and the New Zealand dollar (-847 contracts).


Table of Weekly Commercial Traders and Speculators Levels & Changes:

CurrencyNet CommercialsComms Weekly ChgNet SpeculatorsSpecs Weekly Chg
EuroFx-26,09420,50010,565-12,260
GBP76,23914,647-58,852-11,466
JPY86,358-6,749-62,8075,650
CHF66,1081,235-46,108-1,686
CAD29,728-5,376-24,8986,671
AUD76,6175,470-54,540-3,064
NZD28,648383-24,527-847
MXN-36,004-7,34233,2606,745


This latest COT data is through Tuesday and shows a quick view of how large speculators or non-commercials (for-profit traders) as well as the commercial traders (hedgers & traders for business purposes) were positioned in the futures markets. All currency positions are in direct relation to the US dollar where, for example, a bet for the euro is a bet that the euro will rise versus the dollar while a bet against the euro will be a bet that the dollar will gain versus the euro.


Weekly Charts: Large Trader Weekly Positions vs Price

EuroFX:


British Pound Sterling:


Japanese Yen:


Swiss Franc:


Canadian Dollar:


Australian Dollar:


New Zealand Dollar:


Mexican Peso:


*COT Report: The weekly commitment of traders report summarizes the total trader positions for open contracts in the futures trading markets. The CFTC categorizes trader positions according to commercial hedgers (traders who use futures contracts for hedging as part of the business), non-commercials (large traders who speculate to realize trading profits) and nonreportable traders (usually small traders/speculators). Find CFTC criteria here: (http://www.cftc.gov/MarketReports/CommitmentsofTraders/ExplanatoryNotes/index.htm).

The Commitment of Traders report is published every Friday by the Commodity Futures Trading Commission (CFTC) and shows futures positions data that was reported as of the previous Tuesday (3 days behind).

Each currency contract is a quote for that currency directly against the U.S. dollar, a net short amount of contracts means that more speculators are betting that currency to fall against the dollar and a net long position expect that currency to rise versus the dollar.

(The charts overlay the forex closing price of each Tuesday when COT trader positions are reported for each corresponding spot currency pair.) See more information and explanation on the weekly COT report from the CFTC website.

Article by CountingPips.com


Ichimoku Cloud Analysis 10.08.2018 (AUDUSD, NZDUSD, USDCAD)

Article By RoboForex.com

AUDUSD, “Australian Dollar vs US Dollar”

AUDUSD is trading at 0.7301; the instrument is moving below Ichimoku Cloud, which means that it may continue falling. The markets could indicate that the price may test Tenkan-Sen and Kijun-Sen at 0.7335 and then resume moving downwards to reach 0.7230. Another signal to confirm further descending movement is the price’s rebounding from the resistance level. However, the scenario that Implies further decline may be cancelled if the price breaks the upside border of the cloud and fixes above 0.7415. In this case, the pair may continue growing towards 0.7505.

AUDUSD
Risk Warning: the result of previous trading operations do not guarantee the same results in the future


NZDUSD, “New Zealand Dollar vs US Dollar”

NZDUSD is trading at 0.6579; the instrument is moving below Ichimoku Cloud, which means that it may continue falling. The markets could indicate that the price may test Tenkan-Sen and Kijun-Sen at 0.6640 and then continue moving downwards to reach 0.6490. Another signal to confirm further descending movement is the price’s rebounding from the channel’s upside border. However, the scenario that implies further decline may be cancelled if the price breaks the upside border of the cloud and fixes above 0.6735. In this case, the pair may continue growing towards 0.6850.

NZDUSD
Risk Warning: the result of previous trading operations do not guarantee the same results in the future


USDCAD, “US Dollar vs Canadian Dollar”

USDCAD is trading at 1.3096; the instrument is moving above Ichimoku Cloud, which means that it may continue growing. The markets could indicate that the price may test the upside border of the cloud at 1.3065 and then continue moving upwards to reach 1.3205. However, the scenario that implies further growth may be cancelled if the price breaks the downside border of the cloud and fixes below 1.2995. In this case, the pair may continue falling towards 1.2905.

USDCAD
Risk Warning: the result of previous trading operations do not guarantee the same results in the future

Article By RoboForex.com

Attention!
Forecasts presented in this section only reflect the author’s private opinion and should not be considered as guidance for trading. RoboForex LP bears no responsibility for trading results based on trading recommendations described in these analytical reviews.

Forex Technical Analysis & Forecast 10.08.2018 (EURUSD, GBPUSD, USDCHF, USDJPY, AUDUSD, USDRUB, GOLD, BRENT)

Article By RoboForex.com

EURUSD, “Euro vs US Dollar”

EURUSD is still moving downwards. Today, the price may reach 1.1515 and then form another consolidation range between 1.1560 and 1.1480. If later the pair breaks this range to the downside, the instrument may continue falling inside the downtrend with the target at 1.1414.

EURUSD
Risk Warning: the result of previous trading operations do not guarantee the same results in the future


GBPUSD, “Great Britain Pound vs US Dollar”

GBPUSD is also moving downwards and forming a downside continuation pattern around 1.2870. The instrument is expected to break the pattern to the downside and reach the target at 1.2727.

GBPUSD
Risk Warning: the result of previous trading operations do not guarantee the same results in the future


USDCHF, “US Dollar vs Swiss Franc”

USDCHF is trading upwards to break 0.9980. Later, the market may continue growing with the short-term target at 1.0066.

USDCHF
Risk Warning: the result of previous trading operations do not guarantee the same results in the future


USDJPY, “US Dollar vs Japanese Yen”

USDJPY is moving downwards. Possibly, the pair may reach 110.63 and then grow towards 110.94. After that, the instrument may resume falling inside the downtrend with the first target at 110.30.

USDJPY
Risk Warning: the result of previous trading operations do not guarantee the same results in the future


AUDUSD, “Australian Dollar vs US Dollar”

AUDUSD is also moving downwards. Possibly, today the pair may reach 0.7306 and then start another correction towards 0.7370. Later, the market may resume falling inside the downtrend with the target at 0.7288.

AUDUSD
Risk Warning: the result of previous trading operations do not guarantee the same results in the future


USDRUB, “US Dollar vs Russian Ruble”

After a gap that took place during the trading session opening, USDRUB has completed another ascending wave. Today, the price may form the fifth descending structure to reach 50.50. The instrument is expected to form a new consolidation range with a reversal pattern near the current highs. The first target is at 63.40.

USDRUB
Risk Warning: the result of previous trading operations do not guarantee the same results in the future


XAUUSD, “Gold vs US Dollar”

Gold is moving downwards. Possibly, today the pair may break 1209.00. The main downside target is at 1200.00.

GOLD
Risk Warning: the result of previous trading operations do not guarantee the same results in the future


BRENT

Brent is still consolidating close to the downside border of the Triangle pattern. If later the instrument breaks this range to the downside, the price may fall to reach 70.90; if to the upside – resume trading upwards with the target at 73.90.

BRENT
Risk Warning: the result of previous trading operations do not guarantee the same results in the future

Article By RoboForex.com

Attention!
Forecasts presented in this section only reflect the author’s private opinion and should not be considered as guidance for trading. RoboForex LP bears no responsibility for trading results based on trading recommendations described in these analytical reviews.

The Analytical Overview of the Main Currency Pairs on 2018.08.10

Analytics by JustForex

The EUR/USD currency pair

Technical indicators of the currency pair:
  • Prev Open: 1.16098
  • Open: 1.15260
  • % chg. over the last day: -0.75
  • Day’s range: 1.14564 – 1.14719
  • 52 wk range: 1.0571 – 1.2557

There are aggressive sales on the EUR/USD currency pair. During yesterday’s and today’s trading sessions, quotes have decreased by more than 150 points. At the moment, the key support and resistance levels are 1.14400 and 1.15000, respectively. We recommend opening positions from these marks. In the near future, technical correction is not ruled out.

The news feed on 2018.08.10:
  • – Core consumer price index in the US at 15:30 (GMT+3:00).
EUR/USD

Indicators point to the power of sellers: the price has fixed below 50 MA and 200 MA.

The MACD histogram is located in the negative zone and below the signal line, which gives a strong signal to sell EUR/USD.

Stochastic Oscillator is in the neutral zone, the %K line is crossing the %D line. There are no accurate signals.

Trading recommendations
  • Support levels: 1.14400, 1.14000
  • Resistance levels: 1.15000, 1.15500, 1.16000

If the price fixes above the round level of 1.15000, the EUR/USD quotes are expected to correct. The movement is tending to 1.15500-1.15700.

Alternative option. If the price fixes below the support level of 1.14400, it is necessary to consider sales of EUR/USD. The movement is tending to 1.14000-1.13800.

The GBP/USD currency pair

Technical indicators of the currency pair:
  • Prev Open: 1.28790
  • Open: 1.28240
  • % chg. over the last day: -0.41
  • Day’s range: 1.27727 – 1.27921
  • 52 wk range: 1.2361 – 1.4345

The bearish sentiment prevails on the GBP/USD currency pair. During yesterday’s and today’s trading sessions, quotes have decreased by more than 100 points. Financial market participants expect statistics on the UK GDP. At the moment, the local support and resistance levels are 1.27400 and 1.28000, respectively. In the near future, technical correction is not ruled out.

The news feed on 2018.08.10:
  • – Data on the UK GDP at 11:30 (GMT+3:00);
  • – Manufacturing production in the UK at 11:30 (GMT+3:00).
GBP/USD

Indicators point to the power of sellers: the price has fixed below 50 MA and 200 MA.

The MACD histogram is in the negative zone and below the signal line, which gives a strong signal to sell GBP/USD.

Stochastic Oscillator is located in the neutral zone, the %K line is below the %D line, which also indicates the bearish sentiment.

Trading recommendations
  • Support levels: 1.27400, 1.27000
  • Resistance levels: 1.28000, 1.28700, 1.29400

If the price fixes below the level of 1.27400, the GBP/USD quotes are expected to fall. The movement is tending to 1.27000-1.26800.

Alternative option. If the price fixes above the round level of 1.28000, correction movement is expected. The movement is tending to 1.28500-1.28700.

The USD/CAD currency pair

Technical indicators of the currency pair:
  • Prev Open: 1.30481
  • Open: 1.30494
  • % chg. over the last day: +0.18
  • Day’s range: 1.30432 – 1.30496
  • 52 wk range: 1.2059 – 1.3795

There is the bullish sentiment on the USD/CAD currency pair. During yesterday’s and today’s trading sessions, quotes have risen by more than 80 points. At the moment, the key support and resistance levels are 1.30700 and 1.31000, respectively. The trading instrument has the potential for further growth.

At 15:30 (GMT+3:00) a report on the labor market will be published in Canada.

USD/CAD

Indicators point to the power of buyers: the price has fixed above 50 MA and 200 MA.

The MACD histogram is in the positive zone and above the signal line, which signals to buy USD/CAD.

Stochastic Oscillator is located in the neutral zone, the %K line is crossing the %D line. There are no signals at the moment.

Trading recommendations
  • Support levels: 1.30700, 1.30400, 1.30000
  • Resistance levels: 1.31000, 1.31500

If the price fixes above the key resistance of 1.31000, the USD/CAD quotes are expected to grow. The target movement level is 1.31500-1.31700.

Alternative option. If the price fixes below 1.30700, it is necessary to consider sales of USD/CAD. The movement is tending to 1.30400-1.30200.

The USD/JPY currency pair

Technical indicators of the currency pair:
  • Prev Open: 110.967
  • Open: 111.005
  • % chg. over the last day: +0.10
  • Day`s range: 110.616 – 111.011
  • 52 wk range: 104.56 – 114.74

There is a variety of trends on the USD/JPY currency pair. At the moment, the trading instrument has started declining. The key support and resistance levels are 110.600 and 111.000, respectively. The positions should be opened from these marks. We recommend paying attention to the dynamics of the US government bonds yield.

Today, positive data on Japan GDP have been published.

USD/JPY

The price has fixed below 50 MA and 200 MA, which indicates the power of sellers.

The MACD histogram is in the negative zone and below the signal line, which gives a strong signal to sell USD/JPY.

Stochastic Oscillator is located in the neutral zone, the %K line is crossing the %D line. There are no accurate signals.

Trading recommendations
  • Support levels: 110.600, 110.200
  • Resistance levels: 111.000, 111.400, 111.800

If the price fixes below the level of 110.600, it is necessary to look for entry points to the market to open short positions. The movement is tending to 110.200-110.000.

An alternative is the USD/JPY quotes growth to 111.400-111.600.

Analytics by JustForex

The US Dollar Index Has Updated the Weekly High. The Potential for Growth Remains

by JustForex

The US dollar rose against the basket of major currencies during yesterday’s trading. The US dollar index (#DX) updated the weekly high and closed in the positive zone (+0.60%). Yesterday, the producer price index was published in the US, which counted to 0.0% in July and was worse than the forecasted value of 0.2%. However, this did not prevent the dollar from strengthening. Trade relations between the United States and its partners are still in the focus of attention. Today, the US dollar rally has continued.

During the Asian trading session, data on Japan GDP have been published. So, GDP growth counted to 0.5% in the second quarter and was better than the forecasted value of 0.3%. Financial market participants expect data on the UK GDP. We also recommend paying attention to economic statistics from the US and Canada.

The “black gold” prices are consolidating. At the moment, futures for the WTI crude oil are testing a mark of $66.60 per barrel.

Market Indicators

Yesterday, the bearish sentiment was observed in the US stock market: #SPY (-0.14%), #DIA (-0.18%), #QQQ (-0.06%).

At the moment, the 10-year US government bonds yield is at the level of 2.89%-2.90%.

The news feed on 2018.08.10:

– Data on the UK GDP at 11:30 (GMT+3:00);
– Manufacturing production in the UK at 11:30 (GMT+3:00);
– Core consumer price index in the US at 15:30 (GMT+3:00);
– Report on the labor market in Canada at 15:30 (GMT+3:00).

by JustForex

EURUSD: the euro is resting on the weekly support

By Gabriel Ojimadu, Alpari

On Thursday the 9th of August, trading on EURUSD closed down. Bears resumed the downtrend after the break of the trend line at 1.1582. By the close of trading, the euro fell to 1.1526, surpassing Monday’s low (1.1530).

In the first half of the day, the major currencies were under pressure against the US dollar due to the collapse of NZD. It crumbled following the RBNZ’s interest rate meeting in which the regulator decided to keep rates at the current level until 2020.

Before the opening of the US session, bulls tried to win back losses, but were crushed by the statements of FRB of Chicago President Charles Evans, who said he admits the possibility of two increases by yearend.

Day’s news (GMT+3):

  • 09:45 France: industrial output (MoM) (Jun).
  • 11:30 UK: total business investment (QoQ) (Q2), GDP (YoY) (Q2), manufacturing production (MoM) (Jun), industrial production (YoY) (Jun), total trade balance (Jun), construction output (MoM) (Jun).
  • 15:30 Canada: net change in employment, unemployment rate (Jul).
  • 20:00 USA: Baker Hughes US oil rig count.
  • 21:00 USA: monthly budget statement (Jul).

Fig 1. EURUSD hourly chart. Source: TradingView

Current situation:

The bears broke the trend line at 1.1530 and the 45th degree (1.1574). I will write about the reasons behind the drop in the afternoon review. It stopped at the 90th degree. Technically, nothing is keeping the price from sliding down to 1.1495.

On the weekly chart sellers haven’t been able to pass 1.1510 since May. You can short the euro for a few weeks once the price falls below 1.15.

For today, we have a correction to 1.1550 , from 1.1560. Purchases are risky, so the risk to the deal needs to be reduced by 2-3 times. The stochastic oscillator is on top in the sell zone, so we do not know whether we will drop to 1.1520 or make a new Asian session low. The stochastic signal will be perceived by the trend, so it is unlikely that sellers will ignore it on the hourly timeframe.

Today, traders’ attention will be focused on British data and US CPI data.

Ichimoku Cloud Analysis 09.08.2018 (AUDUSD, NZDUSD, USDCAD)

Article By RoboForex.com

AUDUSD, “Australian Dollar vs US Dollar”

AUDUSD is trading at 0.7433; the instrument is moving above Ichimoku Cloud, which means that it may continue growing. The markets could indicate that the price may test the upside border of the cloud at 0.7415 and then resume moving upwards to reach 0.7505. However, the scenario that Implies further growth may be cancelled if the price breaks the downside border of the cloud and fixes below 0.7375. In this case, the pair may continue falling towards 0.7335. After breaking the upside border of the Triangle pattern and fixing above 0.7460, the price may continue moving upwards.

AUDUSD
Risk Warning: the result of previous trading operations do not guarantee the same results in the future


NZDUSD, “New Zealand Dollar vs US Dollar”

NZDUSD is trading at 0.6656; the instrument is moving below Ichimoku Cloud, which means that it may continue falling. The markets could indicate that the price may test Tenkan-Sen and Kijun-Sen at 0.6705 and then continue moving downwards to reach 0.6590. Another signal to confirm further descending movement is the price’s rebounding from the resistance level. However, the scenario that implies further decline may be cancelled if the price breaks the upside border of the cloud and fixes above 0.6785. In this case, the pair may continue growing towards 0.6850.

NZDUSD
Risk Warning: the result of previous trading operations do not guarantee the same results in the future


USDCAD, “US Dollar vs Canadian Dollar”

USDCAD is trading at 1.3006; the instrument is moving below Ichimoku Cloud, which means that it may continue falling. The markets could indicate that the price may test the downside border of the cloud at 1.3015 and then continue moving downwards to reach 1.2900. Another signal to confirm further descending movement is the price’s rebounding from the resistance. However, the scenario that implies further decline may be cancelled if the price breaks the upside border of the cloud and fixes above 1.3080. In this case, the pair may continue growing towards 1.3185.

USDCAD
Risk Warning: the result of previous trading operations do not guarantee the same results in the future

Article By RoboForex.com

Attention!
Forecasts presented in this section only reflect the author’s private opinion and should not be considered as guidance for trading. RoboForex LP bears no responsibility for trading results based on trading recommendations described in these analytical reviews.

Which Companies Generate More Revenue Per Employee Than Every S&P 500 Stock?

There are many who focus on the mining sector being poor places to invest because miners have a history of poorly allocating capital. But there is a segment within the mining sector, particularly the gold sector that many investors miss, is the royalty & streaming model. They are asset light businesses, with teams under 40. They are some of the most scalable businesses in the world. This business model creates more revenue per employee and market cap per employee than any other group in the S&P 500.  The Three Gold Kings (Franco-Nevada, Wheaton Precious Metals, and Royal Gold), are the largest royalty and streaming companies in mining.

THE THREE GOLD KING vs. S&P 500 COMPANIES (REVENUE/EMPLOYEE)

21 out of the top 50 companies from the S&P 500 that generated the most revenue per employee came from the energy sector. The oil companies saw a resurgence in 2017 because of a recovery in the oil price, accelerating their revenue growth, along with their increased oil production. But, when you compare the top S&P 500 companies on a revenue per employee basis, the top company, Valero Energy, generated less than 50% of the smallest of the three companies generated, Royal Gold. Valero Energy generated almost 60% less than the #1 spot, Wheaton Precious Metals. This is in 2017 when gold and oil produced the similar returns.

THE THREE GOLD KING vs. S&P 500 COMPANIES (MARKET CAP/EMPLOYEE)

Here is where it gets very interesting when you look at the market capitalization per employee, how do the companies stack up? At the beginning of August 2018, based on the fiscal year 2017 staffing, Toronto basedFranco-Nevada is on a completely different league on a market capitalization per employee at more than $400 million in market capitalization value per employee. This almost 2X more than its nearest competitors (Wheaton Precious Metals and Royal Gold), and more than 11X more than EOG. Apple, the world’s largest company, it’s per employee value was less than $8.3 million in market cap value per employee in 2017, or 97% less than each employee was to Franco Nevada.

THREE GOLD KINGS vs BANKERS ON WALL STREET

For the bankers out there, this will interest you. The Three Gold Kings once again in 2017, generated 25X more revenue per employee than the key wall street investment banks (Goldman Sachs and Morgan Stanley). When you compare the Three Kings to diversified bank J.P. Morgan Chase & Co., Royal Gold generates almost 50X as much revenue per employee, and Wheaton Precious Metals generates more than 55X more. As of August, on a market capitalization basis, Franco-Nevada had 175X higher value, on a market capitalization per employee basis than Goldman Sachs, and 277X more than Morgan Stanley.

THREE GOLD KINGS vs FAANGs

Netflix is the main FAANG winner on a revenue per employee basis ($2.1 million), this is still well below that of Wheaton Precious Metals which generated $22.2 million in revenue per employee, more than 10X more. Apple was again ahead of Facebook and Google on the same metric in 2017, from 2016. Amazon is the laggard because of the number of employees it needs to hire to build out its distribution network.  Google and Facebook switched on a revenue per employee position from 2016. While nowhere as extreme as the investment banks, Franco-Nevada had $425 million in market cap. per employee, more than 50X M that of Apple $8.3 million. This is AFTER Apple became a trillion-dollar company.

DEPRESSED GOLD PRICE IS GOOD FOR THE THREE GOLD KINGS

Depressed gold prices are ideal for the royalty and streaming model because both producers and explorers get starved for capital because investors are focused on other sectors. Now is no different, with gold prices down and a marijuana boom pulling in all the capital in Canada, and tech sector pulling in investor capital in the United States. This allows the royalty and streaming companies to be the bankers of last resort and get better terms than they would normally be able to get when the sector is doing well. Good luck to the banker trying to pitch a potential mine development in Africa, where a royalty and streaming company can step in and take on the risk. Their deal flow tends to be inversely related to the commodity price.

SECTOR ROTATION IS COMING?

The gold sector is incredibly unloved and unwanted, whereas the tech companies continue to be in favor. Over the next 2-3 years, we would expect the gap to widen on the two metrics, between the Three Gold Kings and the FAANG’s because of rotation out of tech and into materials. Market capitalization per employee will accelerate for the Three Gold Kings as capital flows increase to them because they tend to be in most of the gold ETFs, have liquidity, pay dividends, have reduced exposure to any one particular mine, and have a proven track record of creating shareholder wealth.On the revenue side, the Three Gold Kings are growing the attributable gold ounces, each year over the next few years, that will further push them ahead of the FAANG’s. The Three Gold Kings are doing this without having to add any new employees.

Okay, okay, but you say, show me the share price:

Royal Gold and Franco-Nevada outperformed both gold and the S&P 500, by a wide margin. Wheaton Precious Metals outperformed silver but didn’t outperform the S&P 500, because of its heavier weighting to silver. In last place, was the GDX ETF (gold miners ETF). It highlights the mining sector is more of a stock pickers environment. By outsourcing to the ETF, shouldn’t necessarily expect outperformance.  Gold has been down, and the royalty and streaming model has held up well.

Three Gold King Share Price

Why the Royalty and Streaming Model works for the Three Gold Kings?

  • Wall Street and Bay Street (Canada) bankers flee the mining sector when the commodities sector is plummeting because risk and compliance assume the sector is riskier when the price is down. Which is completely illogical and irrational. This allows the Three Gold Kings to deploy capital when capital markets and traditional bank lending seizes up. Allowing them to get preferential terms because they are the banker of last resort. This is even more important when the larger miners need capital because there are fewer options to go for capital needs, particularly during challenging times. The royalty and streaming companies know the miners need capital because banks and investors have fleed.
  • “Production” growth tends to continue to grow year in and year out because as each new royalty and/or stream comes online, it adds to the existing streams and royalty.
  • Optionality
    • Optionality to the commodity price when the commodity price increases for that the royalty or stream is tied to. The change in the gold price will flow right down to the bottom line, WITHOUT having to deploy more capital.
    • Optionality to the resource. Many generalist investors completely miss this area because many times the mine can operate for many years, if not decades well after the initial mine plan because the deposit continues to grow. This allows the royalty companies to continue collecting from the mine without having to deploy any more capital.


About the Author:

Paul Farrugia, BCom. Paul is the President & CEO of First Macro Capital. He helps his readers identify mining stocks that you can hold for the long-term. He provides a checklist to find winning gold and silver mining producer stocks, including battery metals.


Murrey Math Lines 09.08.2018 (USDCHF, GOLD)

Article By RoboForex.com

USDCHF, “US Dollar vs Swiss Franc”

In the H4 chart, USDCHF is trading above the 5/8 level and may continue growing to reach the resistance at the 8/8 one.

USDCHF1
Risk Warning: the result of previous trading operations do not guarantee the same results in the future

As we can see in the H1 chart, the pair may break the 2/8 level and then continue trading downwards to reach the support at the 0/8 one.

USDCHF2
Risk Warning: the result of previous trading operations do not guarantee the same results in the future


XAUUSD, “Gold vs US Dollar”

In the H4 chart, XAUUSD may test the support at the 5/8 level, rebound from it, and then resume growing towards the resistance at the 7/8 one.

XAUUSD1
Risk Warning: the result of previous trading operations do not guarantee the same results in the future

As we can see in the H1 chart, the price is trading below the 3/8 level and may continue falling towards the support at the 0/8one.

XAUUSD2
Risk Warning: the result of previous trading operations do not guarantee the same results in the future

Article By RoboForex.com

Attention!
Forecasts presented in this section only reflect the author’s private opinion and should not be considered as guidance for trading. RoboForex LP bears no responsibility for trading results based on trading recommendations described in these analytical reviews.

EURUSD: the target of 1.1665 remains in force

By Gabriel Ojimadu, Alpari

Previous:

On Wednesday the 8th of August, trading on the euro closed slightly up. High volatility on the market was observed during the European session. The euro rose from 1.1573 to 1.1628 amid a lack of important events and news concerning Sino-US trade relations.

The Chinese authorities announced the introduction of import duties on goods from the United States in the amount of 16bn USD (25%) as a response to the US’ tariffs set to take effect on the 23rd of August. By the close of trading, the euro recovered to 1.1620.

Day’s news (GMT+3):

  • 11:00 Eurozone: ECB economic bulletin.
  • 15:15 Canada: housing starts s.a (YoY) (Jul).
  • 15:30 Canada: new housing price index (MoM) (Jun).
  • 15:30 USA: PPI (MoM) (Jul), initial jobless claims (Jul 30).

Fig 1. EURUSD hourly chart. Source: TradingView

Current situation:

I expected to reach 1.1665 on Thursday during the European session. On Wednesday, the geopolitical factor reduced the speed at which the euro could strengthen against the dollar. Despite the breakthrough of the trend line (L1,1530 – L1552), bulls were able to regroup around the Lb balance line and the 45th degree, winning back most of the losses by the end of the trading day. That’s just how it goes. News makes the market move.

  • On Wednesday, the euro saw a false breakout of the trend line.
  • The price bounced from the 45th degree.
  • In Asia, the euro is rising against USD, GBP, and NZD. The EURCHF, EURCAD, EURAUD, and EURJPY crosses are all trading slightly down.

If the pair maintains its positive trend during the European session, then according to the W-shaped model (shown on the chart) I expect growth to the 67th degree (1.1654). Additionally, at this level, the trend line intersects with the upper line of the ascending channel. Bulls have enough momentum to reach 1.1690. Whether or not we will move there will depend on where the market goes when the London session opens.

Now let’s pause for a second and turn our attention to US Treasury bonds. Should they drop amid the escalating conflict between the US and China, then the euro will sink as a result of risk aversion. If bond yields go unaffected by geopolitical events, then the decline will put pressure on the dollar and act as a support for the single currency.

In other news, I suppose it is worth paying attention to the ECB’s economic bulletin.