In the H4 chart, AUDUSD is expected to test the 3/8 level, rebound from it, and then resume falling towards the support at the 0/8 one.
The lines in the H4 and H1 charts are completely the same and confirm the scenario described above.
As we can see in the M15 chart, the pair has broken the downside line of the VoltyChannel indicator and, as a result, may continue trading downwards.
NZDUSD, “New Zealand Dollar vs US Dollar”
In the H4 chart, NZDUSD is consolidating between the 3/8 and 5/8 levels. In this case, the price may continue falling towards the support at the 3/8 level.
As we can see in the H1 chart, the pair has left the “oversold zone”. In this case, the instrument is expected to break the resistance at the 1/8 level and then continue trading upwards to reach the 3/8 one.
Attention! Forecasts presented in this section only reflect the author’s private opinion and should not be considered as guidance for trading. RoboForex LP bears no responsibility for trading results based on trading recommendations described in these analytical reviews.
On Monday the 13th of August, trading on the euro closed slightly up. Markets took a breather after a sharp drop which started on Friday due to increased tensions between The US and Turkey as well as the fact that Trump ordered the doubling of tariffs on Turkish metal.
The Turkish crisis first started affecting developing markets and has gone on from there to impact the developed world. The US dollar and Japanese yen have been the safe haven assets of choice. The EURUSD pair dropped to 1.1365. In Monday’s European session, the EURUSD rate rose to 1.1433.
Day’s news (GMT+3):
09:00 Germany: GDP (Q2), CPI (Jul).
09:45 France: CPI (Jul).
10:15 Switzerland: producer and import prices (Jul).
Since the USDTRY pair is consolidating at around 6.90 USD, the EURUSD pair recovered from the 225thdegree to 1.1433 as part of a correction. The rate returned to the LB balance line (sma 55). While the market is currently in equilibrium, prices may deviate from this line. The lira isn’t getting any stronger, so the correction could come to an end as the European session gets underway. Stay alert.
Trading on the dollar is mixed in today’s Asian session. The euro crosses are in negative territory. Considering that an important support has been broken on the weekly timeframe, after a pullback, the first target levels for sellers will be 1.1380 (45 degrees) and 1.1351 (67 degrees).
At 12:00, Eurozone GDP and industrial production figures will be released. At the same time, a ZEW survey on economic sentiment for both Germany and the Eurozone will be published. These are important indicators, so expect a surge in volatility around this time on all pairs involving the euro. If volatility does rise, this should last for about 30 – 40 minutes.
This simple moving average “works equally well in commodities, currencies, and stocksquot;
By Elliott Wave International
The “moving average” is a technical indicator of market strength which has stood the test of time.
Over 30 years ago, Robert Prechter described this indicator in his essay, “What a Trader Really Needs to be Successful.” What he said then remains true today:
…a simple 10-day moving average of the daily advance-decline net, probably the first indicator a stock market technician learns, can be used as a trading tool, if objectively defined rules are created for its use.
So, what is a moving average?
Learn How You Can Find High-Confidence Trading Opportunities Using Moving Averages
Moving averages are one of the most widely-used methods of technical analysis because they are simple to use, and they work. Learn how to apply them to your trading and investing with this free 10-page eBook from Trader’s Classroom editor Jeffrey Kennedy.
Elliott Wave International’s Jeffrey Kennedy, a 25-year veteran of technical analysis, provides an answer:
A moving average is simply the average value of data over a specified time period, and it is used to figure out whether the price of a stock or commodity is trending up or down.
One way to think of a moving average is that it’s an automated trend line.
Kennedy offers an array of examples and insights about moving averages in the instructive guide, “How to Find High-Confidence Trading Opportunities Using Moving Averages.” Below, you see some of Kennedy’s charts.
Let’s begin with the most commonly-used moving averages among market technicians: the 50- and 200-day simple moving averages. These two trend lines often serve as areas of resistance or support, levels the market needs to “respect” in order for the trend to continue.
For example, the circled areas in the chart below show you where the 200-period SMA provided resistance in the DJIA’s rally back in April-May (top circle), and the 50-period SMA provided support (lower circle):
Let’s look at another widely used simple moving average which “works equally well in commodities, currencies, and stocks,” according to Kennedy: the 13-period SMA.
In the sugar chart below, prices first crossed above the red SMA line, which led to a substantial rally. The circled area shows you the first time the price crossed below the SMA, which came to indicate a change in trend from bullish to bearish:
Kennedy’s “How to Find High-Confidence Trading Opportunities Using Moving Averages” also informs you about a useful tool to help you avoid “whipsaws.”
Indeed, the first two chapters reveal:
The Dual Moving Average Cross-Over System
Moving Average Price Channel System
Combining the Crossover and Price Channel Techniques
Jeffrey Kennedy’s insights are all about making you a better trader.
Learn How You Can Find High-Confidence Trading Opportunities Using Moving Averages
Moving averages are one of the most widely-used methods of technical analysis because they are simple to use, and they work. Learn how to apply them to your trading and investing with this free 10-page eBook from Trader’s Classroom editor Jeffrey Kennedy.
This article was syndicated by Elliott Wave International and was originally published under the headline Moving Averages Help You Define Trend – Here’s How. EWI is the world’s largest market forecasting firm. Its staff of full-time analysts led by Chartered Market Technician Robert Prechter provides 24-hour-a-day market analysis to institutional and private investors around the world.
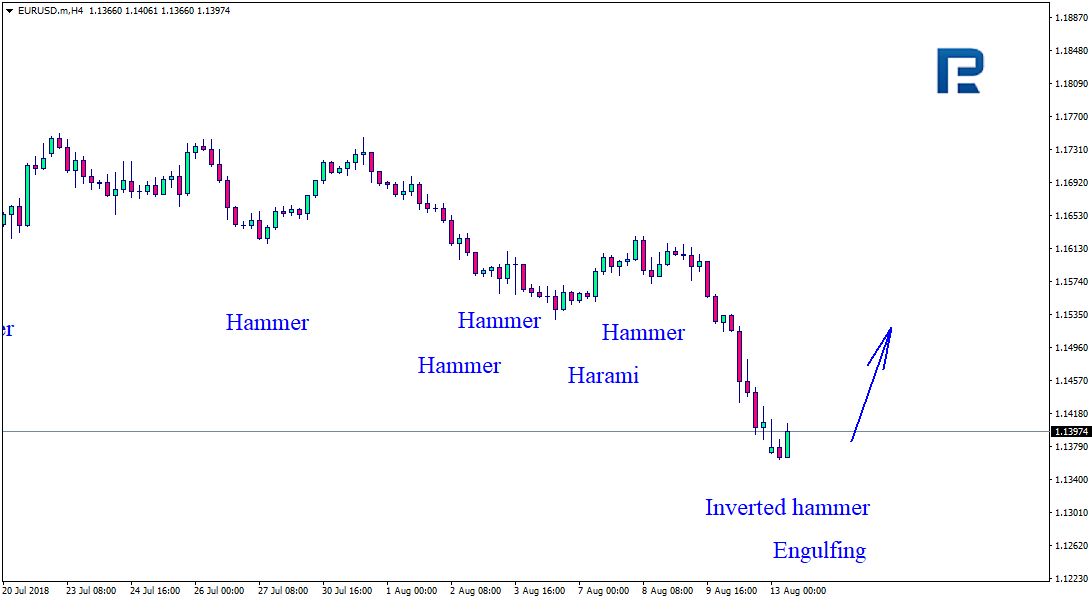
As we can see in the H4 chart, after breaking the support level once again, EURUSD has formed several Inverted Hammer and Engulfing reversal patterns. At the moment, it may be assumed that the instrument may try to confuse and mislead investors before starting a new growth.
USDJPY, “US Dollar vs. Japanese Yen”
As we can see in the H4 chart, USDJPY has broken the support level and formed several Inverted Hammer and Harami reversal patterns. Judging by the previous movement, it may be assumed that the instrument may complete the correction and start a new rising tendency.
Attention! Forecasts presented in this section only reflect the author’s private opinion and should not be considered as guidance for trading. RoboForex LP bears no responsibility for trading results based on trading recommendations described in these analytical reviews.
Last week, aggressive sales were observed on the EUR/USD currency pair. The euro has overcome the key mark of 1.14000. Investors continue to assess the risks for the European banking system due to a significant weakening of the Turkish lira. At the moment, the EUR/USD quotes are consolidating. Local support and resistance levels are 1.13650 and 1.14100. We recommend opening positions from these marks.
Today, the news feed is calm. The publication of important economic reports is not planned.
The price has fixed below 50 MA and 200 MA, which indicates the power of sellers.
The MACD histogram is located in the negative zone, but above the signal line, which gives a weak signal to sell EUR/USD.
Stochastic Oscillator is in the neutral zone, the %K line is above the %D line, which indicates a possible correction.
Trading recommendations
Support levels: 1.13650, 1.13250, 1.13000
Resistance levels: 1.14100, 1.14700, 1.15350
If the price fixes below the support level of 1.13650, it is necessary to look for entry points to the market to open short positions. The movement is tending to 1.13250-1.13000.
Alternative option. If the price fixes above 1.14100, a correction of the EUR/USD currency pair is expected. The movement is tending to 1.14500-1.14700.
The GBP/USD currency pair
Technical indicators of the currency pair:
Prev Open: 1.28240
Open: 1.27406
% chg. over the last day: -0.43
Day’s range: 1.27405 – 1.27795
52 wk range: 1.2361 – 1.4345
At the moment, the GBP/USD currency pair is consolidating after a prolonged fall. The technical pattern is ambiguous. Quotes are testing local support and resistance levels: 1.27350 and 1.27800, respectively. Investors expect new information regarding Brexit. In the near future, a technical correction is not ruled out. Positions should be opened from the key levels.
The news feed on the UK economy is calm.
The price has fixed below 50 MA and 200 MA, which indicates the power of sellers.
The MACD histogram is in the negative zone, but above the signal line, which gives a weak signal to sell GBP/USD.
Stochastic Oscillator is located in the neutral zone, the %K line is crossing the %D line. There are no signals at the moment.
Trading recommendations
Support levels: 1.27350, 1.27000
Resistance levels: 1.27800, 1.28200, 1.28500
If the price fixes below 1.27350, the GBP/USD quotes are expected to fall. The immediate goal for profit taking is a round level of 1.27000.
Alternative option. If the price fixes above the resistance level of 1.27800, correction movement is expected. The movement is tending to 1.28200-1.28500.
The USD/CAD currency pair
Technical indicators of the currency pair:
Prev Open: 1.30494
Open: 1.31601
% chg. over the last day: +0.73
Day’s range: 1.31371 – 1.31665
52 wk range: 1.2059 – 1.3795
The bullish sentiment continues to prevail on the USD/CAD currency pair. On Friday, August 10, the growth of quotes exceeded 100 points. At the moment, the trading instrument is testing monthly highs. The key range is 1.31350-1.31650. The USD/CAD currency pair has the potential for further growth. We recommend opening positions from the key levels.
The publication of important economic reports from Canada is not planned.
The price has fixed above 50 MA and 200 MA, which indicates the power of buyers.
The MACD histogram is in the positive zone, but below the signal line, which gives a weak signal to buy USD/CAD.
Stochastic Oscillator is located in the neutral zone, the %K line is below the %D line, which indicates the USD/CAD correction.
Trading recommendations
Support levels: 1.31350, 1.30750, 1.30300
Resistance levels: 1.31650, 1.32000
If the price fixes above the resistance level of 1.31650, the USD/CAD quotes are expected to grow. The movement is tending to 1.32000-1.32250.
Alternative option. If the price fixes below 1.31350, it is necessary to consider sales of USD/CAD. The movement is tending to 1.31000-1.30750.
The USD/JPY currency pair
Technical indicators of the currency pair:
Prev Open: 111.005
Open: 110.429
% chg. over the last day: -0.13
Day`s range: 110.109 – 110.751
52 wk range: 104.56 – 114.74
Sales are prevailing on the USD/JPY currency pair. The demand for safe assets grew due to political tension between the US and Turkey. At the moment, the USD/JPY quotes are testing local support of 110.150. The 110.500 mark is already a “mirror” resistance. The trading instrument has the potential for further reduce. We recommend opening positions from the key levels.
The news feed on the economy of Japan is calm.
The price has fixed below 50 MA and 200 MA, which indicates the power of sellers.
The MACD histogram is in the negative zone and below the signal line, which gives a strong signal to sell USD/JPY.
Stochastic Oscillator is located in the neutral zone, the %K line is above the %D line, which gives a signal to buy USD/JPY.
Trading recommendations
Support levels: 110.150, 110.000, 109.500
Resistance levels: 110.500, 110.750, 111.150
If the price fixes below the level of 110.150, it is necessary to look for entry points to the market to open short positions. The movement is tending to 109.750-109.500.
Alternative option. If the price fixes above the level of 110.500, the USD/JPY currency pair is expected to grow. The movement is tending to the round level of 111.000.
On Friday, the US dollar strengthened significantly against the basket of major currencies. The US dollar index (#DX) updated the monthly high and closed in the positive zone (+0.90%). The growth of the US currency was triggered by the conflict between the US and Turkey. The US imposed sanctions for Turkey due to the arrest of Andrew Brunson, a Protestant pastor and the US citizen. On Friday, Donald Trump doubled duties on Turkish steel and aluminum. Financial market participants assess risks for the European banking system due to a significant weakening of the Turkish lira.
The British pound weakened after the release of weak data on the UK GDP. On a monthly basis, GDP growth slowed down to 0.1%, while experts expected 0.2%. In annual terms, GDP counted to 1.3% in the second quarter, as investors expected. In turn, the manufacturing production in the UK increased by 0.4% in June and was above the expected value of 0.3%. Core consumer price index in the US, as expected, counted to 0.2% in July. The number of employed in Canada rose to 54.1K instead of 17.5K in July.
The “black gold” prices are consolidating. At the moment, futures for the WTI crude oil are testing a mark of $67.45 per barrel.
Market Indicators
On Friday, there was the bearish sentiment in the US stock market: #SPY (-0.67%), #DIA (-0.73%), #QQQ (-0.76%).
At the moment, the 10-year US government bonds yield is at the level of 2.86%-2.87%.
The news feed on 2018.08.13:
Today, important economic data are not expected to be published.
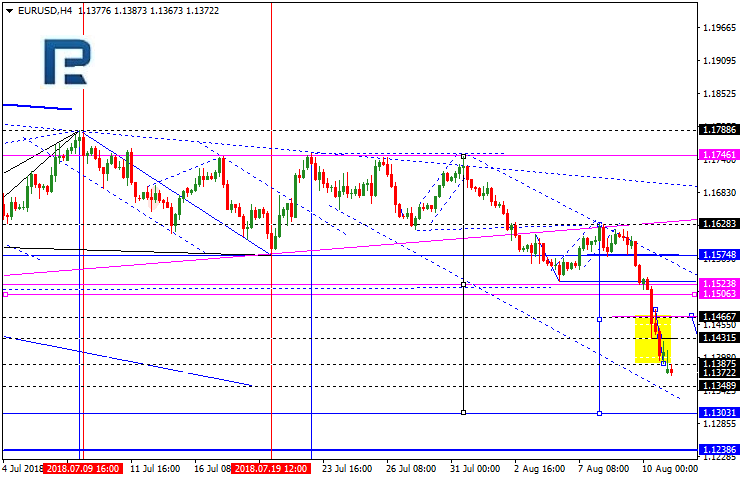
EURUSD is still moving downwards. Today, the price may reach 1.1348 and then form another consolidation range between 1.1431 and 1.1303. If later the pair breaks this range to the downside, the instrument may continue falling inside the downtrend with the target at 1.1240.
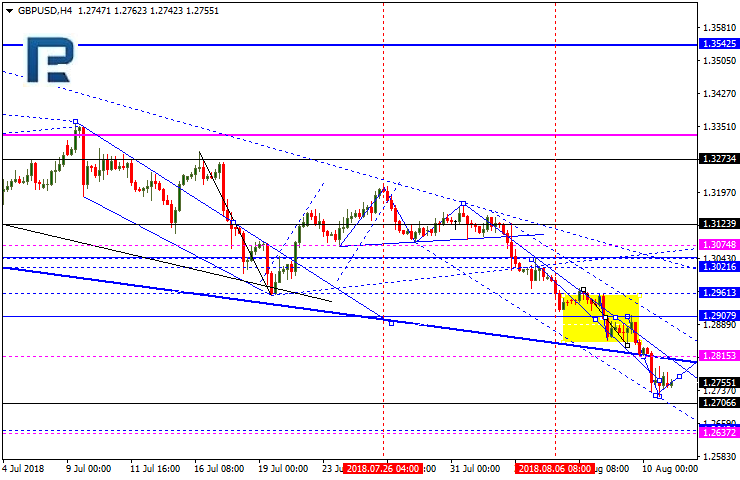
GBPUSD, “Great Britain Pound vs US Dollar”
In case of GBPUSD, the downtrend continues; right now, the price is consolidating around 1.2761. If later the instrument breaks this range to the downside, the pair may fall to reach 1.2637; if to the upside – start another correction with the target at 1.2815 and then resume falling towards 1.2637.
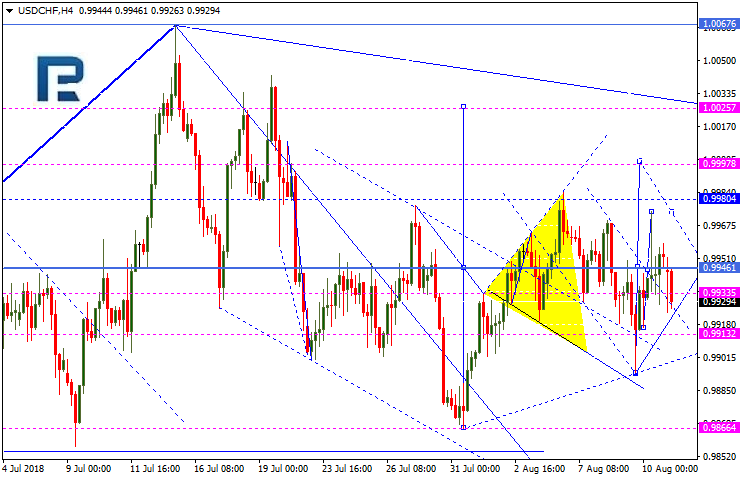
USDCHF, “US Dollar vs Swiss Franc”
USDCHF is consolidating around 0.9945. Possibly, today the pair may break the range to the upside to reach 1.0000. Later, the market may be corrected to return to 0.9945 and then resume growing with the target at 1.0025.
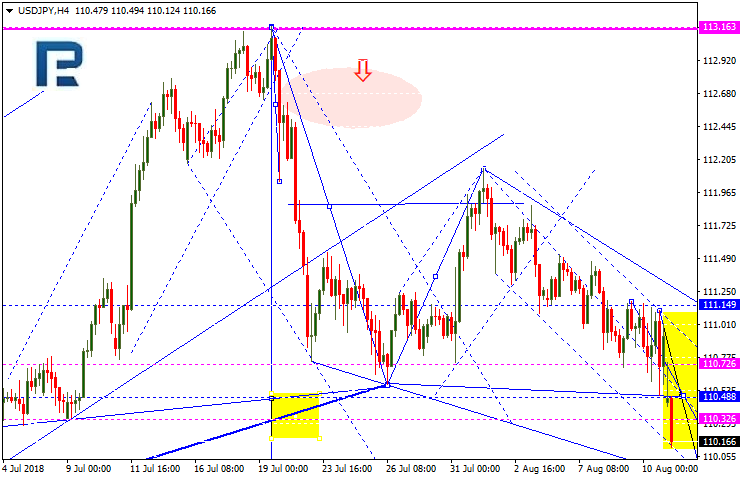
USDJPY, “US Dollar vs Japanese Yen”
USDJPY is moving downwards; it has broken 110.48 to the downside. Possibly, the pair may continue growing to reach 109.86 and then start another correction to return to 110.48. After that, the instrument may resume falling inside the downtrend with the short-term target at 108.85.
AUDUSD, “Australian Dollar vs US Dollar”
AUDUSD is also moving downwards. Possibly, today the pair may reach 0.7260 and then start another correction towards 0.7370. Later, the market may resume falling inside the downtrend with the target at 0.7230.
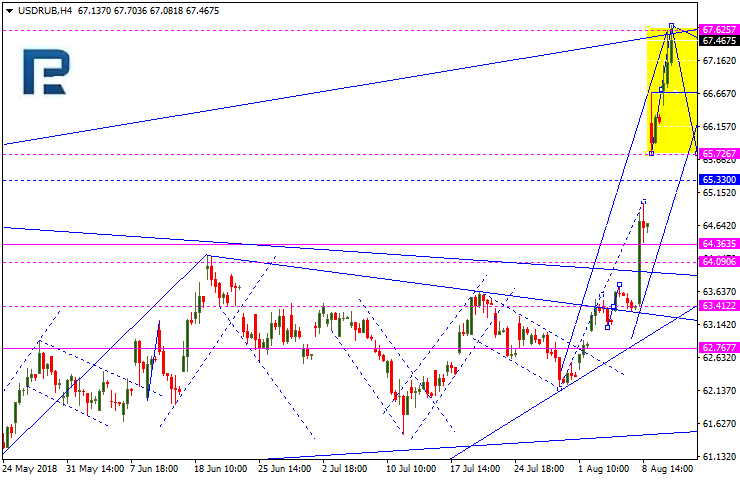
USDRUB, “US Dollar vs Russian Ruble”
USDRUB has formed the consolidation range and broken it to the upside. Possibly, the pair may grow towards 67.80 and then resume trading downwards to break 65.72. After that, the instrument may continue falling inside the downtrend with the target at 64.00.
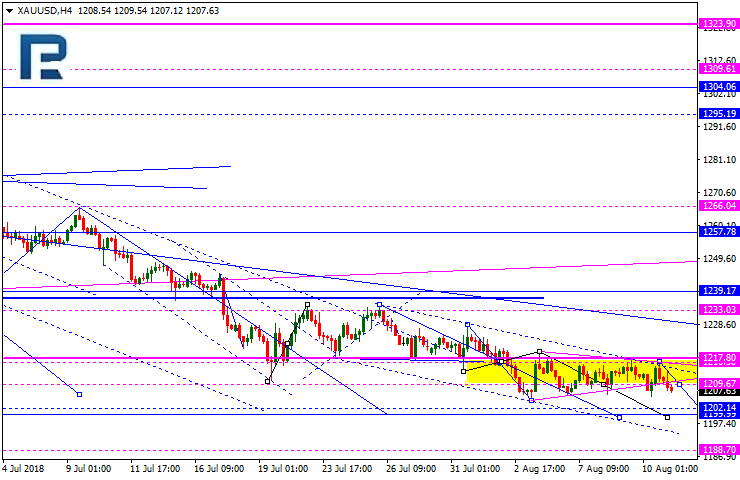
XAUUSD, “Gold vs US Dollar”
Gold is still consolidating near the lows around 1209.00. Today, the price may fall towards 1202.00 and then return to 1209.00. Later, the market may continue trading downwards to reach 1200.00.
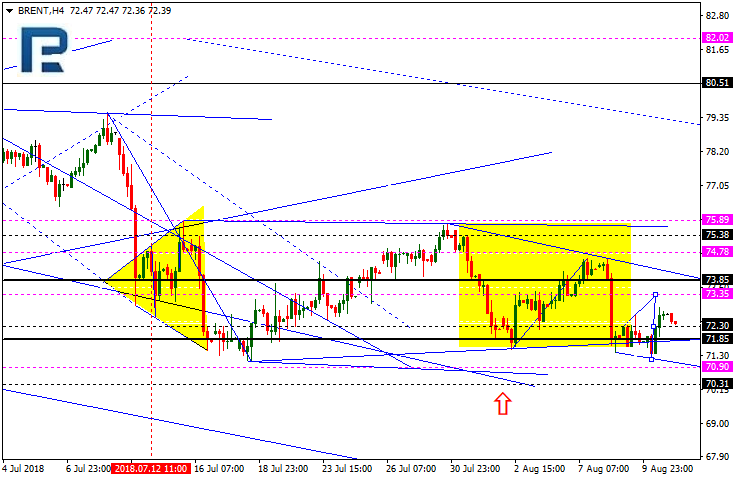
BRENT
Brent is still consolidating close to the downside border of the Triangle pattern. If later the instrument breaks this range to the downside, the price may fall to reach 70.90; if to the upside – resume trading upwards with the target at 73.35 and then fall towards 70.30.
Attention! Forecasts presented in this section only reflect the author’s private opinion and should not be considered as guidance for trading. RoboForex LP bears no responsibility for trading results based on trading recommendations described in these analytical reviews.
On Friday the 10th of August, trading on the US dollar index closed up by a decent amount. The dollar’s rally against the lira had a ripple effect on other currencies. The lira’s rapid drop on Friday took its toll on the euro, with the EURUSD pair, in turn, dropping to 1.1388.
According to the Financial Times, the ECB has expressed concerns over the potential impact the Turkish lira crisis could have on certain French, Italian, and Spanish banks. Shares dropped across the European banking sector on Friday.
Fig 1. USD over the last week.
Last week, nearly all the major currencies dropped against the dollar. The biggest drop came from NZD (-2.45%). The British pound shed 1.78%, the Aussie dollar lost 1.35%, the euro 1.34%, the Canadian dollar 1.11%, and the Swiss franc dropped 0.06%. The Japanese yen gained 0.37%.
Fig 2. USD on Friday
The Aussie and euro were the biggest losers against the dollar on Friday. With the lira’s collapse, market participants ignored everything else.
Day’s news (GMT+3):
Today’s economic calendar in empty.
Monthly OPEC report.
Fig 3. EURUSD hourly chart. Source: TradingView.
The euro dropped to 1.1388 on Friday on the back on the Turkish lira’s collapse and a retreat from risky assets. The lira has lost 30% against the dollar in 3 days, including today’s trading.
Since the the euro is under the influence of geopolitical factors, as well as being in the reversal zone (below the MA D3 line, the first blue line), I’ve decided not to make a forecast. The euro hasn’t been in this zone for long, so a rebound could happen at any minute to take us back to the LB balance line (sma 55). On the current bar, this line runs through 1.1505. The euro will probably meet this line in tomorrow’s Asian session at around 1.14.
Sellers have broken the weekly trend line at 1.1560. This suggests that the euro could return to 1.12. The worst case scenario for buyers would be a drop to 1.0867 by November.
Today’s economic calendar is empty. All eyes are fixed on Turkey and European stock indices. In Asia, the euro has dropped to 1.1368. If trading in Europe opens peacefully, there’s a chance of a correction to 1.1421.
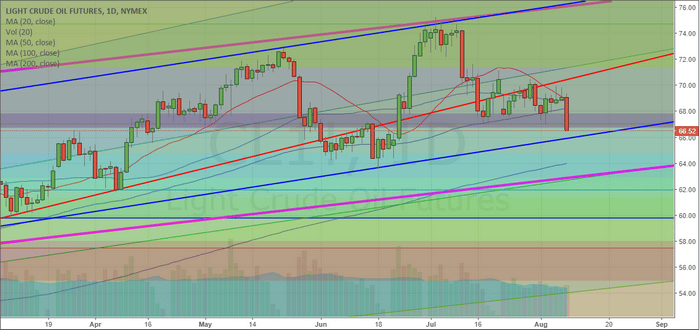
If you have been following our analysis and research of the Crude Oil trend and the energy sector, you know we’ve been suggesting Crude would attempt a move lower and attempt to retest the $58~63 level. It appears the breakdown in prices has begun.
Our research team, at www.TheTechnicalTraders.com, uses an array of proprietary technology, price modeling tools and price cycle modeling tools to attempt to keep our followers up to date with trend reversals, trend expansions and more. This recent downside price move is something we have been expecting for the last 20+ days. The breakdown of support in the Crude oil market, as well as the oversupply of oil on the planet, is setting up for a downside move that could be extraordinary.
This Daily Crude Oil chart shows some of our trend following work where we attempt to identify break ranges, channels, Fibonacci levels and other advanced technical analysis studies. The daily chart only shows a shorter time span and is perfect for attempting to identify immediate support or resistance levels for the price. One can see from this chart that the current breakdown in price is attempting to breach a number of key Fibonacci levels. Should the $66.50 level be broken, we would expect Crude prices to fall to near $64.75 or $62.90. These are the next support levels below the current Fibonacci levels.
The Blue and Magenta levels on this chart are price channels that will become more evident on the next chart – the Weekly chart.
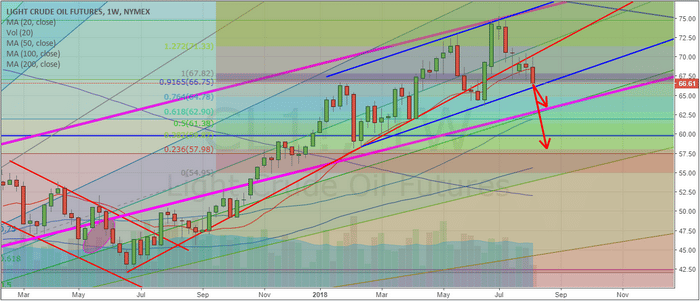
This Weekly Crude Oil chart provides a better, longer-term, perspective of the Oil market. We can see from this chart the Magenta price channel originates from 2016 price rotation. The Blue price channel originates from early 2018 price rotation. The lower, Red, support level originates from the low in June 2017. All of these play an important role in understanding how the price is breaking free of these price channels and may attempt to move dramatically lower.
We’ve already broken the Red support levels, are attempting to breach the Blue price channels and that only leaves the Magenta price channels as final support. Breaking all three of these levels would put Crude prices below $63.00 ppb and we believe that type of move could draw prices to below $60 ppb.
Pay close attention to the size of the most recent Weekly candles – they are much bigger in range than the late 2017 candle ranges. This indicates that volatility in the Crude Oil market is extended and any breakout/breakdown trend could be very aggressive in nature.
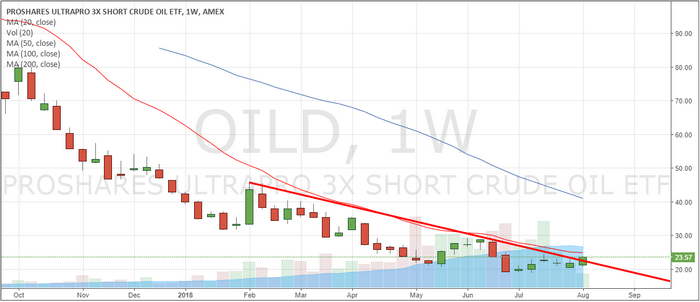
The last chart we have for you today is the OILD 3x Short Oil ETF. It is pretty easy to see that any downside price break in oil, with any longer-term capitulation, would likely drive the OILD prices from about $23.50 to possibly well above $27~32. This type of move could present an opportunity for a 20~40% ROI on a small position if Crude Oil breaks further to the downside. Any opportunity to buy OILD below $22.50 should be considered a strong potential setup as we believe Crude Oil will move to between $60~63 ppb before attempting to find any real support.
Follow our analysis and read all of our past research posts by visiting www.TheTechnicalTraders.com. Learn how we can help you stay ahead of these moves and find new opportunities in the markets. 53 years experience in researching and trading makes analyzing the complex and ever-changing financial markets a natural process. We have a simple and highly effective way to provide our customers with the most convenient, accurate, and timely market forecasts available today. Our stock and ETF trading alerts are readily available through our exclusive membership service via email and SMS text. Our newsletter, Technical Trading Mastery book, and 3 Hour Trading Video Course are designed for both traders and investors. Also, some of our strategies have been fully automated for the ultimate trading experience.
US Dollar net speculator positions leveled at $22.02 billion as of Tuesday
The latest data for the weekly Commitment of Traders (COT) report, released by the Commodity Futures Trading Commission (CFTC) on Friday, showed that large traders and currency speculators continued to boost their bets in favor of the US dollar this week while sharply cutting back on euro and British pound bets. See full article
The non-commercial contracts of WTI crude futures totaled a net position of 608,927 contracts, according to data from this week. This was a slide of -4,473 contracts from the previous weekly total. See full article
The large speculator contracts of gold futures totaled a net position of 12,688 contracts. This was a weekly decline of -22,649 contracts from the previous week. See full article
The large speculator contracts of 10-year treasury note futures totaled a net position of -586,299 contracts. This was a weekly increase of 3,829 contracts from the previous week. See full article
Large stock market speculators cut back on their bullish net positions in the S&P500 Mini futures markets for a third consecutive week. See full article
The non-commercial contracts of silver futures totaled a net position of 4,341 contracts, according to data from this week. This was a weekly fall of -1,523 contracts from the previous totals. See full article
The large speculator contracts of copper futures totaled a net position of 2,190 contracts. This was a weekly shortfall of -6,034 contracts from the data of the previous week. See full article
The Commitment of Traders report data is published in raw form every Friday by the Commodity Futures Trading Commission (CFTC) and shows the futures positions of market participants as of the previous Tuesday (data is reported 3 days behind).