Author Archive for InvestMacro – Page 381

PART I – US Markets Higher Until November 2018

By TheTechnicalTraders.com

Our research team at Technical Traders Ltd. have been laboring over the recent market moves attempting to identify if and when the market may be likely to turn lower or contract.  We’ve been pouring over all types of various data from numerous sources and have concluded the following is the most likely outcome for when the US stock markets may find a reason to pause of contract.  As you read this research post, please allow us a brief introduction of the facts that supported our research.

(source: https://palisade-research.com/warren-buffet-indicator-signaling-market-crash/)


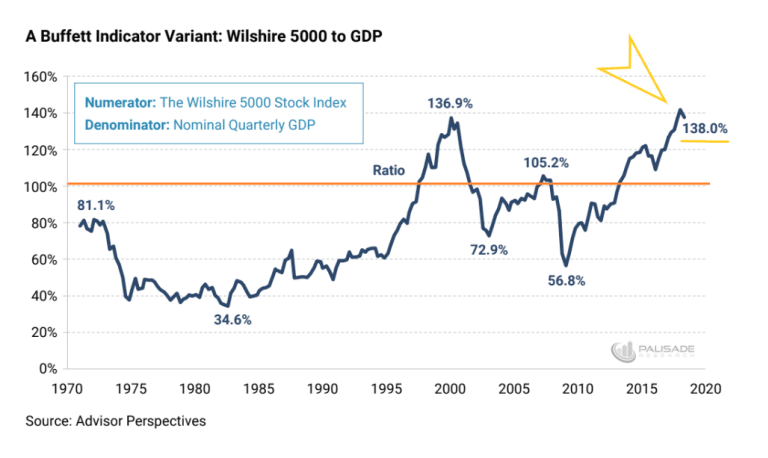
First, our research team started this investigative work after watching the Buffet Indicator climb from the 2015~16 rotation levels to new highs and achieve some recent news events.  This indicator, being one of Warren Buffet’s favorite tools for understanding market valuations in comparison to debt levels provides some interesting components for our team to study.  Yet, we believed this indicator chart lacked something relating to the global markets and the use of the debt capital to spur future global economic activity.

Therefore, our team went off in search of something that could help us rationalize these high Buffet Indicator levels in true relation to the global markets and in relation to the capital shift that we believe is currently taking place throughout the planet.  The first component of our assumption about the global markets is that capital is rushing away from riskier markets and towards more stable markets.  The second component of our assumption is that national debt obligations are being re-evaluated based on perceived risks and contagion issues throughout the globe.  The last component of our assumption is that the new US President is shaking up quite a bit of the old constructs throughout the globe and that the processes and policies put in place by President Trump are creating a very dynamic global capital market environment at the moment.


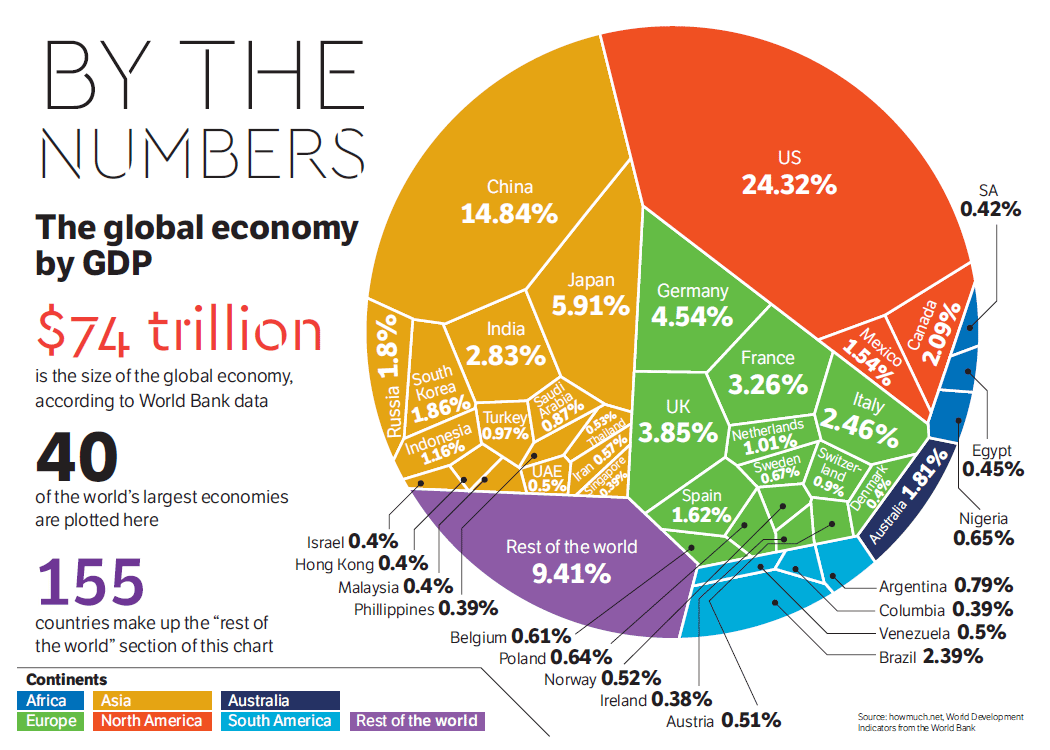
When you consider these three components and their combined results on the global capital markets, we have to understand that there is a very strong possibility that the largest GDP producing countries on the planet, and their banking, institutional and investor classes, are all operating within some aspect of these three components.  This means there is a potential for at least $7 to $15 Trillion (10~20% of total global GDP) US Dollars that are actively sourcing and seeking secure returns while avoiding risks and debt contagion.  This is a massive capital shift that is taking place currently – likely the largest the planet has ever seen.

As the Buffet Indicator is showing, the US stock market is nearing or passing all-time highs in valuation in relation to US debt levels.  Yet, how does the Buffet Indicator correlate the global capital shift that is taking place and equate these dynamics into fair value.  The US market, being the likely target of this massive capital shift, is a fair source for valuations comparisons, but we are experiencing a capital shift that has never before been seen at the levels we are currently experiencing.  Sure, there have been shifts of capital before – but not at the $10 to 20 trillion USD level.

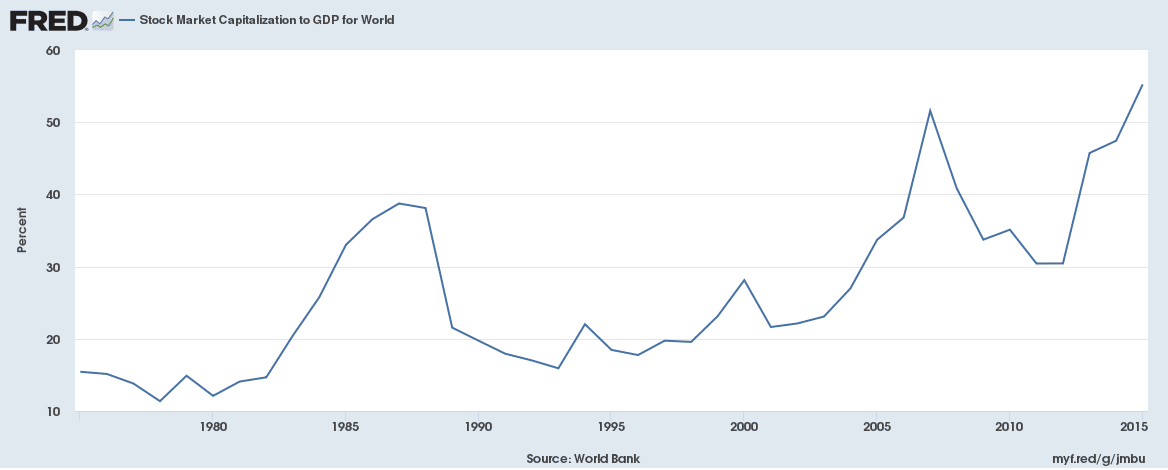
If we compare the Buffet Indicator to this Fred Global Stock Market Capitalization to GDP chart, some interesting facts begin to take shape.  First, the peaks in 1974, 1999, 2008 and 2018 on the Buffet Indicator are not as evident on this chart.  The 1974 peak is relatively nonexistent.  The 1999 peak is a much more muted (28%) peak than on the Buffet Indicator chart and the 2008 and 2018 peaks are relatively correlated to the Buffet Indicator chart.  One should be asking the question, “why are the two most recent peaks more correlated than previous peaks on this global capitalization to GDP chart?”.  Our answer to that question is that after the 1999~2000 US market peak, the globe entered into a much more cooperative economic phase with the EU, China, South America and many other nations operating as global peers vs. global competitors.  It was after this time that the capital markets began to “sync” in some form to the central banks policies and the unification processes that were taking place throughout the globe.

We should, therefore, assume that any global market contagion or crisis will likely take place in some measured form throughout nearly all global markets when it happens.  Additionally, as regional debt or capital market crisis events occur in certain nations, capital that was deployed in these nations or capital markets will likely rush to new, safer environments for periods of time.  Capital is always hunting for the safest and most secure returns while attempting to avoid risk and devaluation.

The central bank policies of the past two decades have allowed a massive increase in the available capital throughout the globe.  Global GDP has risen from $33.57 Trillion in 2000 to $80.68 Trillion today – a whopping 140% increase in only 18 years.  Historically, global GDP has risen by approximately these levels every 15~20 year for the past 50+ years.  This is likely the result of the US moving away from the Gold standard and foreign nations following along with fiat currency central banks since after the 1960s~70s.

This tells us that the peak in 2000 on this global capital market to GDP chart resulted in a moderately isolated capital market peak that was uniquely available within the US and major economies – not globally.  The 2008 peak represented a more globally equal capital market peak.  This means the majority of the global capital market experienced capital appreciation.  The same thing is happening right now – the global markets are experiencing an overall capital market appreciation that is a result of the past 20+ years of central bank policies and economic recovery efforts.

Stay Tuned for PART II Next with Charts and Trading Analysis!

53 years experience in researching and trading makes analyzing the complex and ever-changing financial markets a natural process. We have a simple and highly effective way to provide our customers with the most convenient, accurate, and timely market forecasts available today. Our stock and ETF trading alerts are readily available through our exclusive membership service via email and SMS text. Our newsletter, Technical Trading Mastery book, and 3 Hour Trading Video Course are designed for both traders and investors. Also, some of our strategies have been fully automated for the ultimate trading experience.

PART II – US Markets Higher Until November 2018

By TheTechnicalTraders.com

EURUSD: the trend line is broken, and the bullish phase has begun

By Gabriel Ojimadu, Alpari

Previous:

The euro began trading in the new week down, dropping in the US session to 1.1530. The pressure on the single currency came from the general strengthening of the US dollar against the backdrop of an empty economic calendar.

The escalating trade conflict between the US and China also added to the uncertainty. Chinese authorities announced plans to impose customs duties on US exports to the tune of 60bn USD. Moreover, US 10-year Treasury bonds fell from 2.96% to 2.924%.

When profitability decreases amid political turmoil, it exerts weekly pressure on other major currencies, rather than on the dollar. By the close of the European session, buyers recovered all losses, raising the rate to 1.1570.

Day’s news (GMT+3):

  • 7:30 Australia: RBA interest rate decision (Aug), RBA rate statement.
  • 9:00 Germany: industrial production n.s.a. w.d.a. (YoY) (Jun).
  • 17:00 Canada: Ivey PMI n.s.a (Jul).
  • 23:30 US: API weekly crude oil stock.

Fig 1. EURUSD hourly chart. Source: TradingView

Current situation:

The euro fell to the 180th degree against the backdrop of a drop in US10Y Treasury yields, as well as a general strengthening of the US dollar. Before the close of the European session, the price was under the trend line, so all purchases were risky. After the breakdown of the trend line, according to the forecast, I expect the euro to strengthen against the dollar from 1.1545/50 to 67 degrees (1.1611) by 16:00 (GMT+3). On the crosses the picture is mixed, with the main cross, the euro/pound pair, trading in positive territory.

If the market proceeds based on my trajectory, then you can zero in on 1.1670. The price increase should be regarded as a correction to the downward movement. Important economic data in the second half of the day is not coming out.

The goal of the bears is to develop a decline under 1.1527 and 1.1508 (current yearly low).

XBTUSD Bitmex: buyers have broken the trend line

By Gabriel Ojimadu, Alpari

The zone between 6,790 and 6,845 USD has been providing support to buyers for the last 3 days. Sellers have tried to break through it 5 times to no avail. In today’s European session, buyers have broken the trend line. They managed this with no effort whatsoever as the price had been caught in a sideways trend for 63 hours, and had nothing changed over the next few hours, this trend would have been broken during the US session regardless. I call this a break in time.

Bitcoin likes to exit these pricing models upwards. The critical value for buyers is 7,165 USD. If they manage to break through this level with volume, while triggering stop levels from sellers, the price will move to 7,490/500 today. Technical and psychological factors will both come into play here.

If 7,165 proves too tough for buyers, short positions will come back in force from here. Only in this case will the bears definitely reach 6,600 USD.

Take Notes: What are the Dangers of a World Without Cash?

By Amram Margalit – Leverate

More than a decade ago, banks understood the benefits of internet banking and began closing branches around the world in an effort to cut costs. As a result, todays millennials have rarely set foot in a bank and probably don’t know that a paycheck once actually involved receiving a check from your employer. Now, as cryptocurrencies take hold of our consciousness and a myriad of payment options overwhelms the already crowded market, it seems like a forgone conclusion that we have transcended cash.

But cash is not dead, despite the technology attempting to make it so. According to payment processor Paysafe, cash continues to be the most common payment method, with 88% of people using it in the last month. But people are holding less cash for transactions than in the past, with people in the UK now holding an average of £21, down from £33 in 2017.

The picture this seems to paint is a movement towards lower levels of transactions with cash, likely a continuance of the transition towards cashless living. Clearly, there is still a need for cash today, but the amount of use is dwindling. That such a large number of people still use cash only gives pause to the challenges that a world without cash would create.

The main problem with a world without cash is the continued reliance on technology. How many of us rely on technology to work all the time, without fail? How many of us cannot complete basic work tasks when the internet is down or an aspect of our software or hardware needs have failed? Granted, these are usually isolated incidents. Most of the time our tech guys will fix the problem or a restart will confirm that it is just a temporary glitch. But what happens when it’s not?

What happens when the world of technology that underpins cash fails? Perhaps you think that it couldn’t happen. But it has happened, and it wasn’t a small issue. In the last month, TSB lost 12,500 customers due to a disastrous IT switch. Millions lost access to online and mobile banking, and were even given access to other peoples’ accounts. According to Pinar Ozcan of Warwick Business School, this is actually not surprising. “Most of us trust an established bank with our money, not realizing that these banks’ IT systems date back to the 1970s and they have not updated these systems significantly since then, precisely due to the fear of the system breaking down in the process. What we experienced with TBS is an example of such a nightmare scenario.”

Privacy is also a very real concern. With Facebook’s recent privacy issues, consumers have become more concerned about the use of their details online. A recent Osborne Clarke survey detailed that 79% of respondents were worried about their data, should mobile payment options replace cash. Not only are consumers concerned about their own exposure, but there are also significant questions as to whether it is possible for regulators to provide effective oversight and consumer protection.

On the other hand, technological advances have the capacity to provide far better protection than cash. As Mark-Alexander Christ of SumUp notes, “Even with the extremely rare prospect of a service disruption, criminality, confusion, and corruption are far more prevalent in a world where ‘cash is king’. A world of cash is not safer than one where transactions are protected by end-to-end encryption, fraud-preventing technology and a digital receipt that won’t fall out of your pocket.”

Despite the fear of technological failure crippling the transfer of money, we must not forget that technology has made a great many strides towards improving the transfer of money and providing better protection against fraud. But a transition to this sort of technology exposes users to new types of sophisticated fraud. Protection against this sort of fraud relies on technological security protection, precisely the element that the public doesn’t trust.

Notwithstanding the immense benefits conferred by technology, the challenges remain clear. A world without cash would see us dependent on technology. Now consumers have to decide if they’re willing to bet their cash on whether they trust technology to protect them.

About the Author:

Amram Margalit is a professional writer who has worked in a wide range of settings, including technology companies, nonprofits, and the entertainment industry. Within these positions, Amram has provided quality content and advertising services and is currently the Content Manager at Leverate.


Short-term trading idea FX NZDUSD – bull speculation: correction from the lower line of the 2-2 channel looks likely

By Gabriel Ojimadu, Alpari

Trading opportunities on the currency pair: There’s a familiar pattern on the weekly timeframe, by which we could see the Kiwi dollar start an upwards correction after the RBNZ meeting. If prices reverse along the same trajectory as the previous drop, the immediate target will then be 0.6990. This outcome is still on the cards as long as the pair is trading above 0.6660.

Current situation

The NZDUSD pair has been in a sideways trend with a range of 171 pips for 5 weeks. What’s caught my attention at the moment is that the downwards movement starting from 0.7437 is similar to the drop starting from 0.7558. These waves are almost identical, and considering that the pair is trading around the lower line of the 2-2 channel, there’s a high risk of an upwards reversal, as we saw in December 2017.

Another important thing to note is that on the weekly timeframe, minima are formed on a cycle of 20 – 29 weeks. We’ve now passed the 29-week mark, so the situation temporarily favours the bulls. Considering that a bullish divergence has appeared on the AO indicator (second window), when it crosses the zero line, the column’s colour will change to dark grey, a sign of a strengthening Kiwi dollar.

The US dollar had a mixed day against the majors on Friday. The Kiwi dollar shed 0.33% or 23 pips to reach 0.6743. July’s NFP report didn’t meet market expectations, although thanks to a rise in average hourly earnings and the upwards revision for May and June’s readings, the report was received reasonably well.

157k new jobs were created in July (forecast: 189k). The reading for May was revised from 244k to 268k, and June’s was revised from 213k to 248k. The unemployment rate dropped from 4.0% to 3.9%, which perfectly matched expectations. US10Y bond yields reacted to these statistics with a drop, which led to a lot of the major currencies to close the day down.

On Thursday the 9th of August, the Reserve Bank of New Zealand will make a decision on interest rates. The regulator is expected to leave its current monetary policy unchanged. After the meeting, or even ahead of the decision, we might see the beginning of an upwards correction for the Kiwi on the weekly timeframe. NZD has been in a weak position relative to the dollar for 34 weeks.

If the pair follows the pattern of the previous drop, the first target will be 0.6990. This marks the 38.2% Fibo level of the drop from 0.7437 to 0.6688. This level is also bolstered by the trend line drawn from 0.6197 (from August 2015).

There’s support at 0.6559 (lower line of the 2-2 channel) and 0.6465 (lower line of the 1-1 channel).

The RBNZ meeting is one of this week’s key events. The Kiwi dollar is in a weak position against its US counterpart, so I think it’s ok to keep your short positions open on this pair.

Technical Analysis and Rates Unchanged – Here We Go

By TheTechnicalTraders.com

The US Federal Reserve is one of the only central banks to attempt to raise rates consistently over the past few years, has possibly learned a very valuable lesson – no good comes from raising rates to the point of causing another market collapse.  The news that the US Fed will leave interest rates where they are, temporarily, is good news for a number of reasons.

First, this allows the markets to shake out weaker players and weaker components of the corporate world.  Where corporate debt levels are concerned, interest rates are tied to debt repayment liabilities and refinancing costs.  Firms that are unable to manage at current interest rates certainly would not be happy about rising rates.  This allows these corporations to either struggle to resolve their debt issues or collapse under the weight of their own debt.  This will also play out in the foreign markets as well.

Second, it allows the housing market and private debt markets to shake out some of the “at risk” consumers.  We authored an article a few months ago about how foreclosures and pre-foreclosures were starting to increase in nearly all markets.  At the time, many people in the real estate field shrugged off these increases as par for the course.  With the decreasing foreign investment in real estate and the increasing pressures on the local consumer markets, we saw a dramatic slowdown in housing starts and sales activities recently.  This is because the demand side of the market is falling much faster than the supply capacity.

The uncertainty in the foreign markets, global central banks, and foreign investments have prompted many people to pull out of the local markets – even the hot markets.  The at-risk consumers that were trying to sell near this top suddenly found the buyers were just not there or ready to make the commitment.  This put the at-risk consumers in a difficult position as they could not flip their houses as easily as they could 6 months ago.

Yet, in the global equity markets, investors can sell or buy with much faster transaction times – at the click of a mouse button in most cases.  This allows equity investors to pull capital away from risky investments and migrate that capital into more secure investments in a matter of minutes or hours – not weeks or months.  And that is exactly what has been happening over the past 30+ days in the global markets.

Capital is repositioning for the next phase of this market; where the US economy is strong, housing continues to weaken and at-risk consumers continue to feel the pressures of the US Fed interest rate policies.  Where foreign consumers attempt to deal with their own version of “central bank hell” and asset devaluations in an attempt to find more secure investment vehicles for their capital.  Money market funds, investment funds and, of course, the US value/blue-chip equities are looking very promising right about now.

This Daily SPY chart shows our recent ADLC indicator (price cycle turning points) and our oversold extreme price levels shaded with lime green. When these two things align the market tends to rally for 1-3 days with strong momentum. During pre-market last week, we told our followers that the big gap lower in price was going to be bought and price should rally for 2-3 days, which is exactly what has unfolded thus far.


Global capital will continue to rush into the US markets as long as the US Fed does not do anything to derail things.  Our research team believes the US Fed may even decrease the interest rates by 0.25% before the end of the year depending on how much pressure is placed on the economy by these “at risk” participants.

We will continue to keep you updated as to our findings and we want to urge you to visit www.TheTechnicalTraders.com to read all of our most recent research posts.  You really owe it to yourself to understand what is happening in the global markets right now and how we have continued to stay 30~60 days ahead of these moves for our valued members.  There are so many opportunities setting up in the markets for traders it is almost hard to understand the dynamics at play right now.  If you want a dedicated team of researchers and traders to help you navigate these markets, then visit www.TheTechnicalTraders.com to learn how we can provide you with even more detailed daily research and support.

Chris Vermeulen

By TheTechnicalTraders.com


Japanese Candlesticks Analysis 06.08.2018 (GOLD, NZDUSD)

Article By RoboForex.com

XAUUSD, “Gold vs US Dollar”

As we can see in the H4 chart, XAUUSD is still testing the support level and forming Hammer, Doji, and Inverted Hammer reversal patterns there. Judging by the previous movements, it may be assumed that the price may finish the correction soon, rebound from the support level, and then start a new ascending tendency.

GOLD
Risk Warning: the result of previous trading operations do not guarantee the same results in the future


NZDUSD, “New Zealand vs. US Dollar”

As we can see in the H4 chart, NZDUSD is still trading upwards. Right now, the pair is being corrected again and forming Hammer, Inverted Hammer, and Doji reversal patterns. Judging by the previous movements, it may be assumed that the instrument may be corrected for a while and then resume the uptrend.

NZDUSD
Risk Warning: the result of previous trading operations do not guarantee the same results in the future

Article By RoboForex.com

Attention!
Forecasts presented in this section only reflect the author’s private opinion and should not be considered as guidance for trading. RoboForex LP bears no responsibility for trading results based on trading recommendations described in these analytical reviews.

The Analytical Overview of the Main Currency Pairs on 2018.08.06

Analytics by JustForex

The EUR/USD currency pair

Technical indicators of the currency pair:
  • Prev Open: 1.15835
  • Open: 1.15699
  • % chg. over the last day: -0.15
  • Day’s range: 1.15537 – 1.15657
  • 52 wk range: 1.0571 – 1.2557

On Friday, there was a variety of trends on the EUR/USD currency pair. Ambiguous economic reports on the US labor market were published. At the moment, the EUR/USD currency pair is consolidating. Demand for the US dollar is still high. The key support and resistance levels are 1.15500 and 1.15750, respectively. We recommend opening positions from these marks.

Today, the publication of important news from the US and the Eurozone is not expected.

EUR/USD

The price has fixed below 50 MA and 200 MA, which indicates the power of sellers.

The MACD histogram is located in the negative zone, but above the signal line, which gives a weak signal to sell EUR/USD.

Stochastic Oscillator is in the neutral zone, the %K is above the %D line, which indicates the bullish sentiment.

Trading recommendations
  • Support levels: 1.15500, 1.15000
  • Resistance levels: 1.15750, 1.16100, 1.16400

If the price fixes below the support level of 1.15500, the EUR/USD quotes are expected to fall. The movement is tending to 1.15100-1.14900.

Alternative option. If the price fixes above the resistance level of 1.15750, it is necessary to consider purchases of EUR/USD. The movement is tending to 1.16100-1.16400.

The GBP/USD currency pair

Technical indicators of the currency pair:
  • Prev Open: 1.30115
  • Open: 1.29952
  • % chg. over the last day: -0.05
  • Day’s range: 1.29723 – 1.29996
  • 52 wk range: 1.2361 – 1.4345

Last week, aggressive sales were observed on the GBP/USD currency pair. It should be recalled that the Bank of England raised the key interest rate by 25 basis points to 0.75%. At the same time, the regulator said that in the near future the issue of further tightening of the monetary policy would not be considered. The central bank is concerned about the consequences of Brexit. At the moment, the GBP/USD quotes are moving in the range of 1.29650-1.30000. The positions should be opened from these marks.

The news feed on the UK economy is calm.

GBP/USD

Indicators point to the power of sellers. The price has fixed below 50 MA and 200 MA.

The MACD histogram is in the negative zone, below the signal line, which gives a strong signal to sell GBP/USD.

Stochastic Oscillator is located in the neutral zone, the %K line is crossing the %D line. There are no accurate signals.

Trading recommendations
  • Support levels: 1.29650, 1.29300
  • Resistance levels: 1.30000, 1.30400, 1.30800

If the price fixes below 1.29650, it is necessary to look for entry points to the market to open short positions. The movement is tending to 1.29300-1.29000.

Alternative option. If the price fixes above the already “mirror” resistance of 1.30000, the GBP/USD quotes are expected to rise. The movement is tending to 1.30400-1.30600.

The USD/CAD currency pair

Technical indicators of the currency pair:
  • Prev Open: 1.30187
  • Open: 1.29925
  • % chg. over the last day: +0.18
  • Day’s range: 1.30013 – 1.30103
  • 52 wk range: 1.2059 – 1.3795

The technical pattern on the USD/CAD currency pair is still ambiguous. On Friday, a positive report on Canada’s trade surplus was published. At the moment, the trading instrument is in a sideways trend. Local support and resistance levels are 1.29900 and 1.30200, respectively. We recommend opening positions from these marks.

The news feed on the economy of Canada is calm.

USD/CAD

Indicators do not send accurate signals. The price is testing 50 MA.

The MACD histogram is near 0 mark.

Stochastic Oscillator is located in the neutral zone, the %K line has crossed the %D line. There are no accurate signals.

Trading recommendations
  • Support levels: 1.29900, 1.29600
  • Resistance levels: 1.30200, 1.30600, 1.31000

If the price fixes above the resistance level of 1.30200, we recommend considering purchases of USD/CAD. The target movement level is 1.30600-1.30800.

Alternative option. If the price fixes below 1.29900, the USD/CAD quotes are expected to decline. The movement is tending to 1.29600-1.29400.

The USD/JPY currency pair

Technical indicators of the currency pair:
  • Prev Open: 111.634
  • Open: 111.214
  • % chg. over the last day: -0.35
  • Day`s range: 111.231 – 111.267
  • 52 wk range: 104.56 – 114.74

On Friday, there were aggressive sales on the USD/JPY currency pair. The decrease in quotes exceeded 60 points. At the moment, the USD/JPY quotes are consolidating. The trading instrument has the potential for further reduce. Local support and resistance levels are 111.150 and 111.400, respectively. The positions should be opened from these marks.

The news feed on the economy of Japan is calm.

USD/JPY

Indicators do not send accurate signals. The price has crossed 200 MA.

The MACD histogram is in the negative zone, but above the signal line, which gives a weak signal to sell USD/JPY.

Stochastic Oscillator is located in the neutral zone, the %K line is below the %D line, which also indicates a decline in quotes.

Trading recommendations
  • Support levels: 111.150, 110.850, 110.650
  • Resistance levels: 111.400, 111.700, 112.000

If the price fixes below 111.150, the USD/JPY quotes are expected to fall. The movement is tending to 110.850-110.650.

Alternative option. If the price fixes above 111.400, it is necessary to consider purchases of USD/JPY. The movement is tending to 111.700-112.000.

Analytics by JustForex

Trade Conflict Between the US and China Is Again in the Spotlight

by JustForex

On Friday, economic reports on the US labor market were published. Thus, the number of people employed in the nonfarm sector slowed down to 157K in July, while experts expected 193K. At the same time, the value in June was revised upwards and counted to 248K. The unemployment rate fell to 3.9% in July, as investors forecasted. In general, demand for the US currency is still high. The US dollar index (#DX) slightly fell and closed in the negative zone (-0.03%).

The trade war between the US and China is again in the spotlight. On Thursday, the US administration decided to impose duties on Chinese goods $200 billion worth. On Friday, China announced the introduction of retaliatory duties on American goods $60 billion worth. Today, the US sanctions against Iran will also come into effect. Investors monitor the geopolitical events.

The “black gold” prices are slightly increasing. At the moment, futures for the WTI crude oil are testing a mark of $68.8 per barrel.

Market Indicators

On Friday, the major US stock indices closed in the positive zone: #SPY (+0.43%), #DIA (+0.51%), #QQQ (+0.31%).

At the moment, the 10-year US government bonds yield is at the level of 2.94-2.95%.

The news feed on 2018.08.06:

Important economic news is not expected to be published today. Financial market participants monitor political events.

by JustForex

EURUSD: risks have risen through the hour-long trend line

By Gabriel Ojimadu, Alpari

Previous:

On Friday the 3rd of August, trading on the euro closed down. High volatility was observed in light of the publication of the the US labour market report.

July data on the number of those employed in the non-agricultural sector of the US did not meet market expectations. Although the data was below 189 thousand, the report is not bad, as the average hourly salary has grown and the indicators for May and June have been revised upwards. US 10-year bond yields fell on news of the report, with many major currencies closing in positive territory on Friday as a result.

As a result of last week, major currencies closed in the red zone against USD. The greatest decline was shown by the British pound (-0.84%). Then came the euro (-0.75%), the New Zealand dollar (-0.68%), the Japanese yen (-0.23%), the Australian dollar (-0.03%), and the Swiss franc (-0.02%). The Canadian dollar was the only currency to record growth (+0.55%).

US data:

The number of new jobs was 157 thousand (forecast: 189 thousand). May figures were revised from 244 thousand to 268 thousand, and in June – from 213 thousand to 248 thousand. The overall revision amounted to +59 thousand.

The unemployment level fell to 3.9% (previous: 4.0), which coincided with expectations.

The average hourly earnings index was 0.3% (forecast: 0.3%, previous: revised from 0.2% to 0.1%).

The ISM business activity index for the service sector for July was 55.7 (forecast: 59.0, previous: 59.1).

Day’s news (GMT+3):

  • 9:00 Germany: factory orders s.a. (MoM) (Jun).
  • 11:30 Eurozone: Sentix Investor Confidence (Aug).

Fig 1. EURUSD hourly chart. Source: TradingView

Current situation:

Friday’s multidirectional fluctuations once again confirm that it’s pointless to make market forecasts on payrolls day. The 157th degree acted as a support. The price bounced off that area three times and now sellers are trying to test it below 1.1550.

I see the pair is poised to rebound to 45 degrees (1.1558). The Stochastic Oscillator isn’t favouring buyers at the moment, so it will only be safe to enter long positions if the trend line gets broken. The balance line (Lb) will act as an intermediate resistance. Now it is passing through 1.1600. The economic calendar is looking pretty scarce. There’s nothing to stop buyers from inducing a correction.