EURUSD is forming the second descending impulse. Possibly, today the pair may update 1.1680 and then grow towards 1.1700. After that, the instrument may form another descending structure to reach the first target at 1.1675 and then return to 1.1700, thus forming another consolidation range at the top. Later, the market may break the range to the downside and continue falling inside the downtrend with the target at 1.1480.
GBPUSD, “Great Britain Pound vs US Dollar”
GBPUSD is still consolidating around 1.2863. Possibly, the pair may grow to reach 1.2955. According to the main scenario, the price may fall to break 1.2777 and then continue trading to the downside with the target at 1.2600.
USDCHF, “US Dollar vs Swiss Franc”
USDCHF is moving upwards and forming a new consolidation range to break the descending channel. The target is at 0.9787. Later, the market may fall to reach 0.9766 and then resume growing with the target at 0.9850.
USDJPY, “US Dollar vs Japanese Yen”
USDJPY is still consolidating. Today, the price may form a new ascending structure towards 111.36 and then fall to reach 111.15, thus forming another consolidation range. If the instrument breaks this range to the downside, the price may resume falling to reach 110.60; if to the upside – continue growing with the target at 111.66.
AUDUSD, “Australian Dollar vs US Dollar”
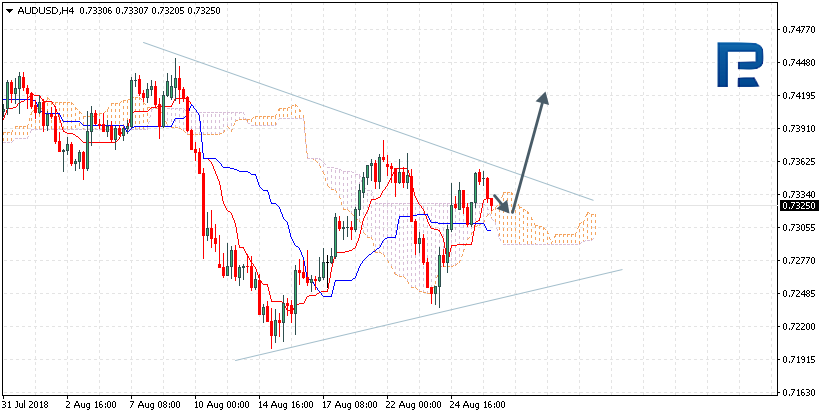
AUDUSD is consolidating. If the instrument breaks this range to the downside, the price may start another decline to reach 0.7287; if to the upside – resume growing towards 0.7373.
USDRUB, “US Dollar vs Russian Ruble”
USDRUB is consolidating around 67.41. Possibly, today the pair may fall to reach 66.50 and may form a new ascending structure with the target at 67.40. After that, the instrument may resume falling towards 65.75.
XAUUSD, “Gold vs US Dollar”
Gold has reached the target of the first descending wave, which may be considered as the start of a new correction towards 1186.20. Today, the price may fall to reach 1193.03 and then grow towards 1200.00. Later, the market may resume trading to the downside to return to 1186.20.
BRENT
Brent is moving downwards with the first target at 75.50. After that, the instrument may start another growth to reach 76.30 and then resume falling towards 73.55.
Attention! Forecasts presented in this section only reflect the author’s private opinion and should not be considered as guidance for trading. RoboForex LP bears no responsibility for trading results based on trading recommendations described in these analytical reviews.
The technical pattern on the EUR/USD currency pair is ambiguous. The trading instrument is in a sideways trend. Investors expect economic statistics from the US. At the moment, the key support and resistance levels are 1.16500 and 1.17000, respectively. We recommend opening positions from these marks. In the near future, the correction of the EUR/USD quotes after the rally is not ruled out.
The news feed on 2018.08.29:
– Data on US GDP at 15:30 (GMT+3:00);
– Pending home sales index in the US at 17:00 (GMT+3:00).
Indicators do not send accurate signals: the price is testing 50 MA.
The MACD histogram is located near the 0 mark.
Stochastic Oscillator is in the neutral zone, the %K line is below the %D line, which indicates the bearish sentiment.
Trading recommendations
Support levels: 1.16500, 1.16000, 1.15500
Resistance levels: 1.17000, 1.17400
If the price fixes above the round level of 1.17000, the EUR/USD currency pair is expected to grow. The movement is tending to 1.17400-1.17600.
Alternative option. If the price fixes below the support level of 1.16500, we recommend considering sales of EUR/USD. The movement is tending to the round level of 1.16000.
The GBP/USD currency pair
Technical indicators of the currency pair:
Prev Open: 1.28893
Open: 1.28642
% chg. over the last day: -0.18
Day’s range: 1.28636 – 1.28721
52 wk range: 1.2361 – 1.4345
There is a variety of trends on the GBP/USD currency pair. At the moment, the quotes are moving in a flat. Financial market participants expect additional drivers. The key support and resistance levels are 1.28400 and 1.28800, respectively. The positions should be opened from these marks. We recommend paying attention to the news feed from the US.
Today, the news feed on the UK economy is calm.
Indicators do not send accurate signals: the price is being traded between 50 MA and 200 MA.
The MACD histogram is in the negative zone, but above the signal line, which gives a weak signal to sell GBP/USD.
Stochastic Oscillator is located in the neutral zone, the %K line has started crossing the %D line. There are no signals at the moment.
Trading recommendations
Support levels: 1.28400, 1.28000, 1.27600
Resistance levels: 1.28800, 1.29200
If the price fixes above 1.28800, the GBP/USD currency pair is expected to grow. The target movement level is 1.29200-1.29500.
Alternative option. If the price fixes below 1.28400, we recommend considering sales of GBP/USD. The target movement level is 1.28000-1.27800
The USD/CAD currency pair
Technical indicators of the currency pair:
Prev Open: 1.29669
Open: 1.29257
% chg. over the last day: -0.29
Day’s range: 1.29141 – 1.29257
52 wk range: 1.2059 – 1.3795
Yesterday, the bearish sentiment was observed on the USD/CAD currency pair. The trading instrument has updated local extremes. At the moment, the quotes are in a sideways trend. The key support and resistance levels are 1.29000 and 1.29400, respectively. The positions should be opened from these marks. The USD/CAD currency pair has the potential for further decrease.
The news feed on the economy of Canada is calm.
Indicators point to the power of sellers: the price has fixed below 50 MA and 200 MA.
The MACD histogram is in the negative zone, but above the signal line, which gives a weak signal to sell USD/CAD.
Stochastic Oscillator is located in the neutral zone, the %K line is above the %D line, which indicates the bullish sentiment.
Trading recommendations
Support levels: 1.29000, 1.28600
Resistance levels: 1.29400, 1.29800, 1.30200
If the price fixes below the round level of 1.29000, the USD/CAD quotes are expected to decline further. The movement is tending to 1.28600-1.28400.
Alternative option. If the price fixes above the resistance level of 1.29400, it is necessary to consider purchases of USD/CAD. The movement is tending to 1.29800-1.30000.
The USD/JPY currency pair:
Technical indicators of the currency pair:
Prev Open: 111.048
Open: 111.190
% chg. over the last day: +0.06
Day’s range: 111.125 – 111.195
52 wk range: 104.56 – 114.74
Since the beginning of this week, the USD/JPY currency pair has been consolidating. Quotes are moving in flat. At the moment, local support and resistance levels are 111.100 and 111.300, respectively. The positions should be opened from these marks. Investors expect additional drivers. We recommend paying attention to the news feed on the US economy.
The publication of important economic reports from Japan is not planned.
Indicators do not send accurate signals. The price is testing 50 MA, which is a strong dynamic support.
The MACD histogram is near the 0 mark.
Stochastic Oscillator is located in the neutral zone, the %K line is below the %D line, which indicates a decrease in the USD/JPY quotes.
Trading recommendations
Support levels: 111.100, 110.800, 110.500
Resistance levels: 111.300, 111.550
If the price fixes above the resistance level of 111.300, it is necessary to consider purchases of USD/JPY. The movement is tending to 111.500-111.700.
Alternative option. If the price fixes below 111.100, the USD/JPY currency pair is expected to decline. The movement is tending to 110.800-110.500.
The US dollar continues to lose ground against the basket of major currencies. The US dollar index (#DX) closed the trading session with a slight decrease (-0.05%). The US and Mexico reached a trade agreement, as a result, tension in international trade relations has decreased, which supports the demand for risky assets.
Investors also closely follow the news about Brexit. Yesterday, Theresa May hastened to assure that even if the UK and the EU did not reach agreement after Brexit, this would not be the end of the world for the UK economy.
In addition, CB consumer confidence index was published in the US yesterday, which counted to 133.4 and was higher than the expected value of 126.7. Today, financial market participants expect data on US GDP. Pending home sales index will also be published in the US.
The “black gold” prices are consolidating after the decline the day before. At the moment, futures for the WTI crude oil are testing a mark of $68.40 per barrel. At 17:30 (GMT+3:00) the US crude oil inventories will be published.
Market Indicators
Yesterday, the bullish sentiment was observed in the US stock market: #SPY (+0.05%), #DIA (+0.02%), #QQQ (+0.15%).
At the moment, the 10-year US government bonds yield is at the level of 2.86%-2.87%.
The news feed on 2018.08.29:
– Data on US GDP at 15:30 (GMT+3:00); – Pending home sales index in the US at 17:00 (GMT+3:00).
On Tuesday the 27th of August, trading on the EURUSD pair closed up. Volatility was high across all of yesterday’s trading sessions. In Asia, the bears tried to reverse the upwards trend, but ran out of steam after a couple of hours. The pair then recovered from 1.1663 to 1.1700. The euro then rose further to 1.1734 on the back of a broadly weaker dollar and rising crosses.
A breakthrough in NAFTA trade negotiations between the US and Mexico increased demand for risky assets, and given that the EURUSD pair is in an uptrend on the hourly timeframe, along with rising crosses, the bulls destroyed everything in their path.
The euro’s rise was halted by the release of US data along with a rise in US10Y bond yields. The dollar was given a boost after a strong US consumer confidence report. The index for August came out at 133.4 (forecast: 126.7, previous reading revised from 127.4 to 127.9). This triggered a correction on the euro to 1.1691, after which it started trading sideways within a narrow range.
The demand for risky assets and the euro on the crosses overwhelmed the bearish divergences and the double top. My prediction of a rebound from the upper boundary of the daily channel did not come to pass. It’s good that I decided to reduce my risk level by half (to 0.5%) on my counter-trend trade.
I’ve highlighted 2 areas on today’s chart, which show similar patterns of a correction followed by growth. So long as sellers don’t manage to break through the low at 1.1633 (from the 27th of August), buyers have the potential to bring the rate back up to 1.1734.
Hourly cycles and patterns point towards weak growth today, followed by a decline tomorrow. In light of this, my forecast for today has the euro rising to 1.1720 during the European session, followed by a drop to 1.1696 during the US session.
Today, traders will turn their attention towards US data; namely GDP figures for Q2 and the change in the number of pending home sales in July.
I don’t want to buy the euro at this stage. When the single currency returns to around 1.1720 – 1.1734, it may be worth risking shorting the euro with a target of 1.1600.
AUDUSD is trading at 0.7325; the instrument is moving above Ichimoku Cloud, which means that it may continue growing. The markets could indicate that the price may test the upside border of the cloud at 0.7320 and then resume moving upwards to reach 0.7420. However, the scenario that Implies further growth may be cancelled if the price breaks the downside border of the cloud and fixes below 0.7270. In this case, the pair may continue falling towards 0.7220. After breaking the upside border of the Triangle pattern and fixing above 0.7370, the price may continue moving upwards.
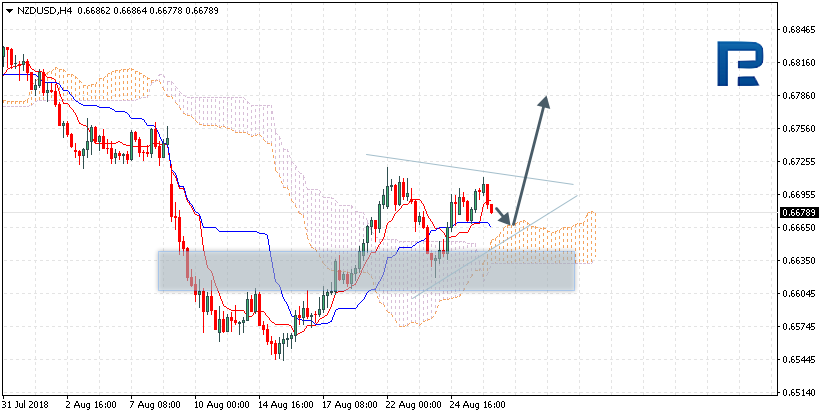
NZDUSD, “New Zealand Dollar vs US Dollar”
NZDUSD is trading at 0.6678; the instrument is moving above Ichimoku Cloud, which means that it may continue growing. The markets could indicate that the price may test the upside border of the cloud at 0.6670 and then continue moving upwards to reach 0.6785. Another signal to confirm further ascending movement is the price’s rebounding from the downside border of the Triangle pattern. However, the scenario that implies further growth may be cancelled if the price breaks the downside border of the cloud and fixes below 0.6615. In this case, the pair may continue falling towards 0.6560. After breaking the upside border of the Triangle pattern and fixing above 0.6725, the price may continue moving upwards.
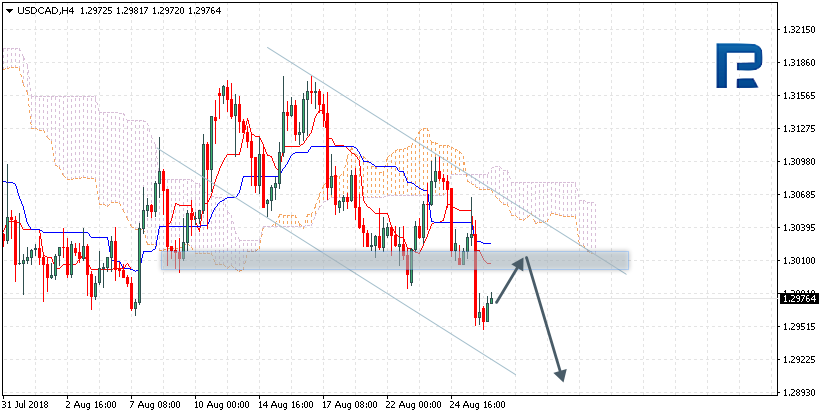
USDCAD, “US Dollar vs Canadian Dollar”
USDCAD is trading at 1.2976; the instrument is moving below Ichimoku Cloud, which means that it may continue falling. The markets could indicate that the price may test Tenkan-Sen and Kijun-Sen at 1.3015 and then continue moving downwards to reach 1.2895. Another signal to confirm further descending movement is the price’s rebounding from the resistance level. However, the scenario that implies further decline may be cancelled if the price breaks the upside border of the cloud and fixes above 1.3080. In this case, the pair may continue growing towards 1.3170.
Attention! Forecasts presented in this section only reflect the author’s private opinion and should not be considered as guidance for trading. RoboForex LP bears no responsibility for trading results based on trading recommendations described in these analytical reviews.
As we can see in the H4 chart, USDCAD has formed another correction towards the support level with Engulfing, Hammer, and Inverted Hammer reversal patterns. Judging by the previous movements, right now it may be assumed that the instrument is being corrected before starting a new ascending tendency.
AUDUSD, “Australian Dollar vs US Dollar”
As we can see in the H4 chart, AUDUSD has rebounded from the resistance level once again and formed several Doji, Engulfing, and Harami reversal patterns. Judging by the previous movements, it may be assumed that the instrument is being corrected before forming a new uptrend.
Attention! Forecasts presented in this section only reflect the author’s private opinion and should not be considered as guidance for trading. RoboForex LP bears no responsibility for trading results based on trading recommendations described in these analytical reviews.
Yesterday, the US dollar continued to lose grounds relative to the single currency. The EUR/USD quotations growth exceeded 70 points. Support was provided by positive data on the business climate in Germany from IFO. At the moment, the trading instrument is testing the round level of 1.17000. The local support is 1.16450. In the near future, the further growth of the EUR/USD quotes is not excluded. We recommend opening positions from the key levels.
The news feed on 2018.08.28:
– CB consumer confidence index in the USA at 17:00 (GMT+3:00).
Indicators point to the power of buyers: the price has fixed above 50 MA and 200 MA.
The MACD histogram is located in the positive zone, but below the signal line, which gives a weak signal to buy EUR/USD.
Stochastic Oscillator is in the neutral zone, the %K line is above the %D line, which indicates the bullish sentiment.
Trading recommendations
Support levels: 1.16450, 1.16000, 1.15350
Resistance levels: 1.17000, 1.17500
If the price fixes above the round level of 1.17000, further growth of the EUR/USD currency pair is expected. The movement is tending to 1.17400-1.17600.
Alternative option. If the price fixes below the support level of 1.16450, we recommend considering selling EUR/USD. The movement is tending to 1.16000.
The GBP/USD currency pair
Technical indicators of the currency pair:
Prev Open: 1.28370
Open: 1.28893
% chg. over the last day: +0.31
Day’s range: 1.28615 – 1.29014
52 wk range: 1.2361 – 1.4345
Yesterday, the bullish sentiment prevailed on the GBP/USD currency pair. At the moment the quotes are moving in the flat. The key levels of support and resistance are: 1.28600 and 1.29000 respectively. The trading instrument is tending to recover. We recommend you to keep track of the latest information on Brexit. Positions must be opened from the key levels.
Today, the news feed on the UK economy is calm.
Indicators point to the power of buyers: the price has fixed above 50 MA and 200 MA.
The MACD histogram is in the positive zone, but below the signal line, which gives a weak signal to buy GBP/USD.
Stochastic Oscillator is located in the neutral zone, the %K line is above the %D line, which indicates the bullish sentiment.
Trading recommendations
Support levels: 1.28600, 1.28300, 1.28000
Resistance levels: 1.29000, 1.29350, 1.29500
If the price fixes above 1.29000, further growth of the GBP/USD currency pair is expected. The target level of movement is 1.29350-1.29500.
Alternative option. If the price fixes below 1.28600, we recommend to consider sales of GBP/USD. The target movement level is 1.28300-1.28000.
The USD/CAD currency pair
Technical indicators of the currency pair:
Prev Open: 1.30135
Open: 1.29669
% chg. over the last day: -0.36
Day’s range: 1.29495 – 1.29823
52 wk range: 1.2059 – 1.3795
Yesterday, the USD/CAD currency pair held the offer zone of 1.30500-1.30650, which triggered aggressive sales. The trading instrument has updated local extremes. The United States and Mexico reached a new agreement on the future of the North American Free Trade Area (NAFTA). Currently, the quotes are consolidating in the range of 1.29500-1.29850. The USD/CAD currency pair is tending to decrease. Positions must be opened from the key levels.
The news feed on Canada’s economy is calm.
Indicators point to the power of sellers: the price has fixed below 50 MA and 200 MA.
The MACD histogram is in the negative zone, but above the signal line, which gives a weak signal to sell USD/CAD.
Stochastic Oscillator is located in the neutral zone, the %K line is below the %D line, which indicates the bearish sentiment.
Trading recommendations
Support levels: 1.29500, 1.29000
Resistance levels: 1.29850, 1.30150, 1.30500
If the price fixes below 1.29500, the USD/CAD quotes are expected to decline further. The movement is tending to the round level of 1.29000.
Alternative option. If the price fixes above the resistance level of 1.29850, it is necessary to consider buying USD/CAD. The movement is tending to 1.30150-1.30300.
The USD/JPY currency pair:
Technical indicators of the currency pair:
Prev Open: 111.314
Open: 111.048
% chg. over the last day: -0.14
Day’s range: 110.989 – 111.356
52 wk range: 104.56 – 114.74
There is an ambiguous technical pattern on the USD/JPY currency pair. The quotes are in a sideways trend. Local support and resistance levels are: 111.100 and 111.350, respectively. Investors expect additional drivers. We recommend you to pay attention to the news feed on the US economy.
The publication of important economic reports from Japan is not planned.
Indicators do not send accurate signals: the price has crossed 50 MA.
The MACD histogram is near the 0 mark.
Stochastic Oscillator is located in the neutral zone, the %K line is below the %D line, which indicates a fall in USD/JPY.
Trading recommendations
Support levels: 111.100, 110.750
Resistance levels: 111.350, 111.500
If the price fixes above the resistance level of 111.350, it is necessary to consider buying USD/JPY. The movement is tending to 111.500-111.700.
Alternative option. If the price fixes below the 111.100 level, the correction of the USD/JPY currency pair is expected. The movement is tending to 110.750-110.600.
Yesterday, the US currency continued to decline against the basket of major currencies after the speech by the Fed Chairman Jerome Powell. The US dollar index (#DX) closed in the negative zone (-0.41%). Meanwhile, yesterday it became known that the US and Mexico reached a new agreement on the future of the North American Free Trade Area (NAFTA). This can change the sentiment in the financial markets.
The euro was supported by German IFO business climate index published yesterday, which counted to 103.8 and was better than the expected value of 101.9. Today, investors have taken a wait-and-see attitude before the publication of CB consumer confidence index in the US.
The “black gold” prices are consolidating. At the moment, futures for the WTI crude oil are testing a mark of $68.75 per barrel. At 23:30 (GMT+3:00) the API weekly crude oil stock will be published.
Market Indicators
Yesterday, the bullish sentiment was observed in the US stock market: #SPY (+0.79%), #DIA (+1.06%), #QQQ (+1.02%).
At the moment, the 10-year US government bonds yield is at the level of 2.84%-2.85%.
The news feed on 2018.08.28:
– CB consumer confidence index at 17:00 (GMT+3:00).
On Monday the 27th of August, trading on the euro closed up against most of the majors. This was brought about by the US dollar declining across the board, which was a response to Fed Chair Jerome Powell’s remarks on Friday. The market took his words to mean that the regulator is willing to slow down the process of increasing interest rates to a degree.
With some help from the crosses, the euro jumped to 1.1694. In Asia, the bulls pushed further to 1.1697.
16:00 US: S&P/Case-Shiller home prices index (Jun).
17:00 US: Richmond Fed manufacturing index (Aug).
23:30 US: API weekly crude oil stock (24 Aug).
Fig 1. EURUSD hourly chart
Current situation:
The pair’s rise stopped at the 135th degree. The pair is currently trading at 1.1673. The greenback is currently trading up against all the majors, although the bulls are now providing support to the crosses. From a technical standpoint, the pair is ready for a drop. Several of the conditions for a downwards correction have been met:
Bearish divergence between the price and the AO indicator.
The pair has reached a resistance on the daily timeframe, which is drawn from the following highs: 1.1852, 1.1790, and 1.1747.
The truncated formation could end the upwards movement from 1.1301 to 1.1697.
Europe’s economic calendar is empty. The bears need to move their feet today and close the day at 1.1650 or lower. In this case, a reversal hammer / pin bar / shooting star will form on the daily timeframe. Call it what you like, it’s a bearish signal. If we apply a Fibonacci grid to this growth, then 38% = 1.1545. This is the low that could be reached by the downwards correction to the upwards movement from 1.1301.
Now the bulls on the crosses will take a break, and the euro will shoot down. In my forecast, I’m expecting an initial drop to 1.1638. If the trend line doesn’t hold firm, then we can start shorting the euro up to around 1.1595 – 1.1616. The stochastic is now in the buy zone, which is also bad. If the US dollar index unexpectedly reverses downwards, the euro will quickly recover its losses given the bullish trend on the hourly timeframe. Since 112 – 135 degrees mark a reversal zone, I’m expecting a downwards correction.
With its 25th anniversary just around the corner, the World Trade Organization (WTO) is facing many challenges. A looming trade war between two economic superpowers has stirred up questions of the organization’s effectiveness and viability. Has the WTO indeed become obsolete?
Open for business since January 1st, 1995, when it was ratified by 124 participant governments, the establishment of the WTO marked a significant milestone in international trading history. The organization, which is now supported by 164-member countries, replaced the outdated, and negatively titled General Agreement on Tariffs and Trade (GATT), which was established just after World War 2, in 1948. The new organization was to focus on trade through the regulation of goods, services, and intellectual property, rather than on sanctions. The WTO’s modus operandi was to prohibit discrimination between trading partners except when trade might impinge on matters of environment or national security. It is now the largest economic organization in the world.
What was perhaps not predicted by the original WTO architects was the power of national interests that might prevent certain member states from abiding by the organization’s charter. Such actions became particularly prevalent among nations that have become economic powerhouses. One of the key states that has been accused of not playing by the rules is China, whose policies of domestic subsidies and the flouting of intellectual property rights has become widespread. While many nations, particularly those in Europe, have been uneasy with this predicament, few have taken any action. Across the Atlantic, the situation has not been so acquiescent.
After President Trump took his oath of office, he immediately set his eyes on the US economy, and its trade imbalance with the People’s Republic of China. 18 months after becoming President, his advisors proposed a range of sanctions on China that would seek to redress the trade balance between the two countries. A trade war between the two giant economic superpowers was never likely to win much international support, and the sanctions have yet to bite.
But the actions committed by the Chinese government are hardly original. During the 18th and 19th centuries, the US as well as many European states employed the selfsame activities. China’s economic policies are simply aimed at claiming its portion of 21st century prosperity. These policies have seen significant reduction in poverty among China’s huge population, as well as healthy growth of the Chinese middle class and an inevitable increase in demand for western goods. And, just as American and European states promoted their own self-interests through subsidies on aircraft and automobile manufacturing during the latter half of the 20th century, so China is promoting similar actions 50 years later.
Rather than the expected convergence of trade practices as envisioned by the original designers of the WTO, individual member states have tended to promote their own agendas in line with their own domestic requirements. This is particularly so when considering the effect on domestic labor and fiscal policies set by member states. As such, rather than pushing for further sanctions, the WTO should recognize the inevitable diversity of global economic policy and build those forces into its international mandate.
About the Author:
AmramMargalit is a professional writer who has worked in a wide range of settings, including technology companies, nonprofits, and the entertainment industry. Within these positions, Amram has provided quality content and advertising services and is currently the Content Manager at Leverate.