The British Pound has reached stability by the last summer week, but it may really be some kind of the calm before the storm.
Last week, the Pound got stronger due to the USD weakness and higher risks on the currency market. However, all of this turned out to be short-term, and GBPUSD got more stable by the end of the trading week.
When it comes to the Brexit, investors are focused on the trade relations issue between the United Kingdom and the European Union. No deal has been made yet and there are fears that the parties won’t sing any agreement until spring 2019, when the UK is scheduled to exit the EU. Such uncertainty makes the long-term Pound trading quite risky, but it shouldn’t surprise anyone, because everyone saw that the talks were very complicated.
Right now, it is already known that the British government would agree on the Brexit even without solving the trade relations issue, if the problems, which occur during these negotiations between politicians all the time, prevented the agreement from being signed on time.
There are still some official statements relating to possible effects of the Brexit on the country’s economy. For instance, last week investors were concerned by the comments from the current First Minister of Scotland (Nicola Sturgeon). She said that if the population decided to have the second Brexit referendum, Scotland wouldn’t have anything against it. However, this has no influence on the basic British strategy on the Brexit. March 2019, when the Brexit procedure is set to start, is just six month away.
In case of GBPUSD, the major tendency is still descending. After updating the previous essential low and testing the support line, the price has started a new correction towards the resistance level. As a result, one case see the channel and two resistance lines: major at 1.2936 and short-term at 1.2885. If the pair breaks these lines, the instrument may continue the correction towards 1.3110. However, if the price rebounds from the resistance lines, it may reverse and test the support level at 1.2600 or even at 1.2450.
Author: Dmitriy Gurkovskiy, Chief Analyst at RoboForex
Disclaimer
Any forecasts contained herein are based on the authors’ particular opinion. This analysis may not be treated as trading advice. RoboForex bears no responsibility for trading results based on trading recommendations and reviews contained herein.
The recent sell-off of Bitcoin and other cryptocurrencies was simply a standard market correction, observes the CEO of one of the world’s largest independent financial advisory organizations.
The comments from Nigel Green, founder and chief executive of deVere Group, come as Bitcoin – the world’s biggest cryptocurrency by market capitalization – was close to almost its lowest point of the year two weeks ago and continued its bearish action last week. Other major digital currencies also experienced a sell-off over the last fortnight.
But the crypto market headed back into the green on Monday, posting positive results as the bulls push Bitcoin back on a rally.
Mr Green, whose firm launched the cryptocurrency exchange deVere Crypto at the beginning of 2018, says: “Cryptocurrency markets are subject to volatility more than traditional ones.
“Despite what the doom mongers would want you to believe, the recent sell-off was only ever going to be temporary and prices were bound to rise again relatively quickly – as they are now doing.
“Previous to this sell-off, in recent weeks Bitcoin had experienced a pretty impressive rally, peaking at around $8,300. As such, what happened over the last fortnight was simply a standard crypto market correction.”
He continues: “For many investors, such volatility, of the kind that we saw recently, is used as a welcome buying opportunity.
“They look at the bigger picture. That’s to say, in today’s world, a digital, global currency simply makes sense to them. Or to put it another way, they believe that cryptocurrencies are the future of money.
“Such investors also appreciate that institutional and regulatory support is increasingly inevitable and could happen sooner than many previously expected.
“In addition they are seeing for themselves how more and more global financial institutions, major corporations and household name investors are now working with cryptocurrencies and blockchain, the technology that underpins them.”
Mr Green goes on to say: “Increasingly, savvy investors are aware that what is taking place is a maturation of a relatively new market – hence the highs and lows almost every other week.
“As such, they understand that they either have to buy and take a long-term approach – as is typically the best approach with almost all investing – or be prepared to miss the boat.”
The deVere CEO concludes: “As anyone who has analysed the sector in recent years will know, the dips and peaks are a usual part of the cryptocurrency market.”
deVere Group is one of the world’s largest independent advisors of specialist global financial solutions to international, local mass affluent, and high-net-worth clients. It has a network of more than 70 offices across the world, over 80,000 clients and $12bn under advisement.
As we can see in the H4 chart, XAUUSD is being corrected upwards and has already reached the retracement of 23.6%. The next possible upside targets may be the retracements of 38.2%, 50.0%, and 61.8% at 1217.00, 1235.00, and 1252.00 respectively. The main support level is the low at 1160.13.
In the H1 chart, the uptrend is moving towards the post-correctional extension area between the retracements of 138.2% and 161.8% at 1208.50 and 1213.00 respectively.
USDCHF, “US Dollar vs Swiss Franc”
As we can see in the H4 chart, the correctional downtrend continues. After reaching the retracement of 23.6%, USDCHF may continue falling towards the retracements of 38.2% and 50.0% at 0.9733 and 0.9682 respectively. The resistance level is the high at 1.0068.
In the H1 chart, the convergence made the pair reverse and start a new correction, which is getting closer to the retracement of 38.2% at 0.9869. Later, the instrument may reach the retracement of 50.0% at 0.9888. The support level is the low at 0.9808.
Attention! Forecasts presented in this section only reflect the author’s private opinion and should not be considered as guidance for trading. RoboForex LP bears no responsibility for trading results based on trading recommendations described in these analytical reviews.
EURUSD is still consolidating. Although the pair is trying to expand the range upwards, it may grow up to 1.1666, but not higher. After that, the instrument may start forming the first descending impulse with the target at 1.1444.
GBPUSD, “Great Britain Pound vs US Dollar”
GBPUSD has formed a new consolidation range around 1.2854. If later the instrument breaks this range to the upside, the price may grow to reach 1.2950; if to the downside – resume falling with the target at 1.2772.
USDCHF, “US Dollar vs Swiss Franc”
USDCHF is moving upwards. Possibly, the pair may reach 0.9900 and then fall towards 0.9866. Later, the market may resume growing with the short-term target at 0.9955.
USDJPY, “US Dollar vs Japanese Yen”
USDJPY is moving downwards; it has reached the first target of the correction. Today, the price may form another ascending structure towards 111.33 and then resume falling with the target at 110.60. The main target of the correction is at 110.48. After that, the instrument may continue growing to reach 111.66.
AUDUSD, “Australian Dollar vs US Dollar”
AUDUSD is growing towards 0.7373. Later, the market may fall to reach 0.7282, thus forming another consolidation range in the form of the Triangle pattern. If later the instrument breaks this range to the downside, the price may resume falling to reach 0.7200.
USDRUB, “US Dollar vs Russian Ruble”
USDRUB has broken the low of the first descending impulse and may continue falling to reach the first target at 65.75. Possibly, today the pair may fall with the short-term target at 66.41. Later, the market may grow to reach 67.35 and then continue falling towards the first target.
XAUUSD, “Gold vs US Dollar”
Gold is moving upwards and forming the fifth structure of the ascending wave. Possibly, the pair may consolidate at the top. If the instrument breaks this range to the upside, the price may resume growing to reach 1212.00; if to the downside – start another correction towards 1200.00. Later, the market may grow to reach 1212.00 and then continue the correction with the target at 1186.00.
BRENT
Brent is still forming the first ascending wave. Possibly, the pair may reach 77.00 without any corrections. After that, the instrument may resume falling towards 73.80 and then start another growth with the short-term target at 80.00.
Attention! Forecasts presented in this section only reflect the author’s private opinion and should not be considered as guidance for trading. RoboForex LP bears no responsibility for trading results based on trading recommendations described in these analytical reviews.
On Friday, the bullish sentiment was observed on the EUR/USD currency pair. The growth of quotes was almost 100 points. Investors assess the comments by the Federal Reserve chairman at a symposium in Jackson Hole. The trade conflict between the US and China is still in the focus of attention. At the moment, local support and resistance levels are 1.15850 and 1.16300, respectively. We recommend opening positions from these marks. In the near future, technical correction is not ruled out.
The news feed on 2018.08.27:
– IFO business climate index in Germany at 11:00 (GMT+3:00).
Indicators point to the power of buyers: the price has fixed above 50 MA and 200 MA.
The MACD histogram is located in the positive zone, but below the signal line, which gives a weak signal to buy EUR/USD.
Stochastic Oscillator is in the oversold zone, the %K line is crossing the %D line. There are no accurate signals.
Trading recommendations
Support levels: 1.15850, 1.15400, 1.15000
Resistance levels: 1.16300, 1.16700
If the price fixes above the resistance level of 1.16300, further growth of the EUR/USD currency pair is expected. The movement is tending to 1.16700-1.17000.
Alternative option. If the price fixes below the support level of 1.15850, we recommend considering sales of EUR/USD. The movement is tending to 1.15400-1.15000.
The GBP/USD currency pair
Technical indicators of the currency pair:
Prev Open: 1.28097
Open: 1.28370
% chg. over the last day: +0.36
Day’s range: 1.28345 – 1.28517
52 wk range: 1.2361 – 1.4345
On Friday, the GBP/USD quotes slightly strengthened. At the moment, the technical pattern is ambiguous. Investors expect additional drivers. Local support and resistance levels are 1.28200 and 1.28600, respectively. The positions should be opened from these marks. A trading instrument is tending to grow.
The financial markets of the UK are closed due to the holiday.
Indicators do not send accurate signals: the price has crossed 50 MA.
The MACD histogram is near the 0 mark.
Stochastic Oscillator is located near the oversold zone, the %K line is below the %D line, which gives a weak signal to sell GBP/USD.
Trading recommendations
Support levels: 1.28200, 1.27800, 1.27400
Resistance levels: 1.28600, 1.29000, 1.29400
If the price fixes above 1.28600, the GBP/USD currency pair is expected to grow. The target movement level is 1.29000-1.29400.
Alternative option. If the price fixes below 1.28200, we recommend considering sales of GBP/USD. The target movement level is 1.27800-1.27400.
The USD/CAD currency pair
Technical indicators of the currency pair:
Prev Open: 1.30788
Open: 1.30135
% chg. over the last day: -0.41
Day’s range: 1.30122 – 1.30245
52 wk range: 1.2059 – 1.3795
On Friday, aggressive sales of USD/CAD were observed. The decrease in quotes was almost 100 points. At the moment, the trading instrument is recovering. Local support and resistance levels are 1.30100 and 1.30400, respectively. We recommend opening positions from these marks. The trading instrument has the potential for further fall.
The news feed on the economy of Canada is calm.
The price has fixed below 50 MA and 200 MA, which indicates the power of sellers.
The MACD histogram is in the negative zone, but above the signal line, which gives a weak signal to sell USD/CAD.
Stochastic Oscillator reached the overbought zone, the %K line is above the %D line, which gives a weak signal to buy USD/CAD.
Trading recommendations
Support levels: 1.30100, 1.29850
Resistance levels: 1.30400, 1.30800, 1.31200
If the price fixes below 1.30100, further decrease of the USD/CAD quotes is expected. The movement is tending to 1.29850-1.29500.
Alternative option. If the price fixes above the resistance of 1.30400, it is necessary to consider purchases of USD/CAD. The movement is tending to 1.30700-1.30900.
The USD/JPY currency pair:
Technical indicators of the currency pair:
Prev Open: 111.229
Open: 111.314
% chg. over the last day: -0.06
Day’s range: 111.117 – 111.156
52 wk range: 104.56 – 114.74
On Friday, a variety of trends was observed on the USD/JPY currency pair. At the moment, the technical pattern is ambiguous. Investors expect additional drivers. The key support and resistance levels are 111.000 and 111.250, respectively. The positions should be opened from these marks. In the near future, a technical correction is not ruled out.
The news feed on the economy of Japan is calm.
Indicators do not send accurate signals: the price is between 50 MA and 200 MA.
The MACD histogram has moved into the negative zone, which signals the power of sellers.
Stochastic Oscillator is located in the neutral zone, the %K line is above the %D line, which indicates the growth of quotes.
Trading recommendations
Support levels: 111.000, 110.700, 110.400
Resistance levels: 111.250, 111.500
If the price fixes above the resistance level of 111.250, it is necessary to consider purchases of USD/JPY. The movement is tending to 111.500-111.700.
Alternative option. If the price fixes below 111.000, the correction of the USD/JPY currency pair is expected. The movement is tending to 110.700-110.500.
On Friday, the US dollar weakened against the basket of major currencies. After two-day talks, the US and China did not come to any agreement. Moreover, the countries exchanged additional duties. Also, the US currency was under pressure due to the speech by the Federal Reserve chairman, Powell, in Jackson-Hole. The official supported a further gradual increase in the interest rates. At the same time, the Federal Reserve chairman is concerned about the lack of accelerating inflation and the state of the real estate market. The US dollar index (#DX) closed in the negative zone (-0.54%).
This week, investors’ attention will be focused on trade negotiations on the NAFTA contract renewal. We also recommend paying attention to the following reports from the US and the Eurozone. On Wednesday, August 29, the revised value of US GDP for the second quarter will be published. On Thursday, August 30, the US Department of Commerce will publish the core personal consumption expenditure price index in the US. On Friday, August 31, there will be data on inflation in the Eurozone.
The “black gold” prices are consolidating. At the moment, futures for the WTI crude oil are testing a mark of $68.50 per barrel.
Market Indicators
On Friday, the bullish sentiment was observed in the US stock market: #SPY (+0.60%), #DIA (+0.53%), #QQQ (+0.93%).
At the moment, the 10-year US government bonds yield is at the level of 2.81%-2.82%.
The news feed on 2018.08.27:
– IFO business climate index in Germany at 11:00 (GMT+3:00).
The markets of Great Britain are closed due to the holiday.
Last week, all the major currencies gained ground against the US dollar except for the yen. The biggest mover was the euro (+1.60%). The Swiss franc rose by 1.22%, the Kiwi dollar by 0.81%, the pound by 0.77%, the loonie by 0.28%, and the Aussie dollar by 0.13%. The yen, on the other hand, shed 0.69% against the dollar.
Fig 1. Dynamics of USD exchange rates for the week
On Friday, trading on the euro closed up. The single currency rose by 110 pips to reach 1.1640. Market participants shorted the dollar in response to Jerome Powell’s speech at the Jackson Hole symposium, having concluded that his performance was too pessimistic.
Powell stressed the need to continue along the current trajectory of gradual rate hikes in order to protect the economy, control inflation, and maintain a low level of unemployment. Cleveland Fed chief Mester also voiced her support for gradually raising interest rates in the US.
St. Louis Fed chief Bullard added fuel to the fire after stating that he thought the Fed should stop raising interest rates. He believes that the fallout from Trump’s tax cuts will come to an end next year, which will cause economic growth to slow, which in turn will bring inflation under control.
Another potential negative for the dollar and positive for the euro was the sharp 1.3% rise on the yuan, taking its value up to 6.80. The People’s Bank of China took the unexpected decision to resume using the counter-cyclical factor to support the yuan’s value, which it had suspended in January. Maybe some kind of agreement was reached at the recent talks after all.
The US and China concluded two days of trade talks last week, in which they exchanged ideas on how to instill trust, balance, and reciprocity in their economic relations. Still, there’s no indication as to whether the parties managed to reach some kind of consensus on how to address their current problems. If Trump proposes imposing further levies on Chinese goods, I think we can safely say that no agreement has yet been reached.
11:00 Germany: IFO – expectations (Aug), IFO – business climate (Aug), IFO – current assessment (Aug).
15:30 US: Chicago Fed national activity index (Jul).
17:30 Canada: BoC review.
Fig 2. EURUSD hourly chart
Current situation:
The fundamentals had a bigger impact on Friday’s trading than technical factors. The pair mounted an initial recovery to the LB balance line at 1.1572 before rising further to 1.1640 in the US session. This rise came to an end at the 90th degree.
In this morning’s Asian session, the bulls have pushed past Friday’s high to reach 1.1653. I reckon that following Friday’s rally, we’re going to see another triple top model form, like the one we had on the 21st and 22nd of August. Moreover, the upper boundary of the channel on the daily timeframe runs through 1.1670, which will act as a resistance during the first half of this week.
The weekly candlestick closed up. If the bulls manage to bring the rate up to 1.1700 this week, this will set up a reversal formation on the weekly timeframe. Given that today is Monday, following Friday’s rally, we can consider shorting the euro from around 1.1660/1.1665.
Our researchers at Technical Traders Ltd. have identified a potential in the markets that many people may have overlooked or are not prepared for. The recent strength in the markets has skewed many opinions toward the bullish perspective as the S&P, DOW, Transports and Nasdaq have all pushed towards new all-time highs.
We are writing this research post to alert our followers that we believe the US Indices and major markets may be setting up for a moderately deep price pullback that could be in excess of 5% or more.
Our proprietary price modeling systems and advanced learning models are warning us that the upside trend is likely still in place, yet there is a growing and stronger potential for a price pullback that could result in a 4~7% pullback in the near future. We want to alert all our followers that we believe an immediate price pullback is setting up and to protect your long positions.
The continued rally in the US majors has allowed many traders to become overly comfortable to the potential for a major pullback. Much like what happened in February 2018, when a bigger pullback did happen, all of the sudden traders were screaming that a massive top had formed and that everyone should watch out for a further breakdown in price values. We are not saying that right now and we want to be clear – so please read the following statement very clearly…
We believe a 4~7% price pullback is setting up in the US markets that will likely extend into September 2018 before forming a new price bottom and prompting the markets to rally to new all-time highs before the end of 2018. We believe this price pullback/rotation is healthy for the markets after such an extended rally and we believe many traders are discounting the potential for such a move and will surprise many traders. Protect your long positions and prepare for this type of price pullback. You will be able to re-enter your positions as the bottom sets up and a new rally begins.
Let’s take a look at some of the charts that support our research.
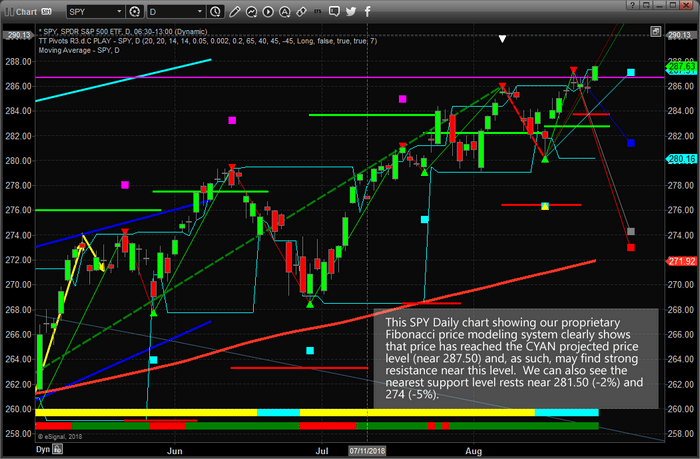
We’ll start with the SPY and highlight our proprietary Fibonacci price modeling system. The recent Daily price rotation in the SPY has illustrated that price has reached the CYAN projected price point. This should be the first level of resistance that price encounters within the current rally. The lower BLUE projected price point is the current major support level. The fact that we are currently breaching the all-time high levels adds greater weight to the fact that resistance should be relatively strong near these highs and that we could see a major price rotation setting up near these levels. The downside Fibonacci price targets suggest a 2~5% price decline is possible given current price ranges.
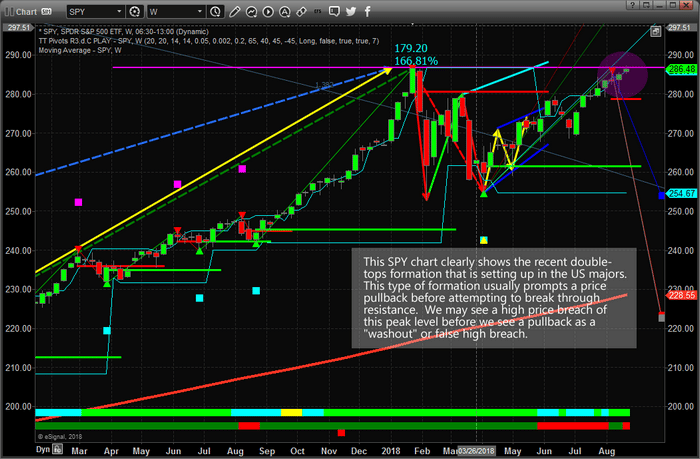
This Weekly SPY chart highlights the key resistance level that is currently at play in the markets from the February 2018 highs. Our proprietary Fibonacci price modeling system is suggesting that prices could, and should, continue to rally to well above the current highs over time. Yet, the current Weekly downside price projection levels show a potential for price to move to 254.65 as the nearest key Fibonacci support level – and possibly even lower to near $224. Yes, this Weekly chart is indicating the SPY could fall -12% on a medium-term pullback or as far as -22% with a deeper pullback and still have the potential for new highs before the end of 2018.
You might be asking, “how could this happen and what would prompt this move?”. We assume it would be some geopolitical or global economic mini-crisis that would prompt such a move, but it could be that investors simply rotate capital out of the US markets chasing opportunities in other foreign markets or debt instruments. The fundamentals for a continued US rally are still in place for at least 6+ months – we are just concerned that a moderately deeper pullback than many are expecting is right around the corner and about to hit the markets. We don’t believe this pullback will be the start of a new bearish price trend.
If you want to learn more about our research, services and how we can help you find and execute better trades, then please visit www.TheTechnicalTraders.com to learn about our team of researchers and products for traders. You can also review all of our past research posts to learn how we have been calling these market moves for the past 12+ months. We urge you to pay attention to our work because we believe we have some of the most advanced and accurate market timing tools on the planet. Time will tell if we are correct with Today’s call – bet we want you to understand the risks and potential rewards that are presented right now in the markets. Take a minute to see how we can help you become a better trader as these moves play out over the next 12+ months.
The latest data for the weekly Commitment of Traders (COT) report, released by the Commodity Futures Trading Commission (CFTC) on Friday, showed that large traders and currency speculators once again boosted their bets for the US Dollar Index this week while also raising their bearish bets for the euro and British pound sterling.
The non-commercial futures contracts of US Dollar Index futures, traded by large speculators and hedge funds, totaled a net position of 34,122 contracts in the data reported through Tuesday August 21st. This was a weekly increase of 2,089 contracts from the previous week which had a total of 32,033 net contracts.
The speculative position in the Dollar Index futures has now risen for an eighteenth consecutive week to the highest overall bullish standing since May 16th of 2017 when the net position totaled 34,275 contracts (a span of 66 weeks).
The Aggregate US Dollar Position edges higher for 3rd week
The aggregate US dollar position – the total of US dollar contracts against the combined contracts of the euro, British pound, Japanese yen, Australian dollar, Canadian dollar and the Swiss franc – showed that currency speculators edged their overall bets higher to $23.67 billion as of Tuesday August 21st, according to data from the CFTC and dollar amount calculations by Reuters. This was a weekly rise of $0.5 billion from the $23.17 billion total position that was registered the previous week, according to the Reuters calculation.
The USD aggregate position rose for a third straight week and for the ninth time out of the past ten weeks. The current standing is now at the highest level since January 17th of 2017 when the bullish total was $24.44 billion.
Individual Currency Contract Data this week
Overall, in the individual currency contracts this week, the non-commercial large futures traders, including hedge funds and large speculators, bet in favor of the US Dollar Index (2,089 weekly change in contracts), the Japanese yen (10,962 contracts), Australian dollar (1,576 contracts) and the New Zealand dollar (1,550 contracts).
The currencies whose speculative bets declined this week were the euro (-3,052 weekly change in contracts), British pound sterling (-11,597 contracts), Swiss franc (-1,369 contracts), Canadian dollar (-823 contracts) and the Mexican peso (-5,404 contracts).
See the table and individual currency charts below.
Table of Weekly Commercial Traders and Speculators Levels & Changes:
Currency
Net Commercials
Comms Weekly Chg
Net Speculators
Specs Weekly Chg
EuroFx
-3,751
6,556
-4,841
-3,052
GBP
97,277
12,723
-72,338
-11,597
JPY
68,700
-11,510
-47,406
10,962
CHF
62,178
-3,597
-47,218
-1,369
CAD
26,792
-4,491
-27,021
-823
AUD
76,193
419
-50,207
1,576
NZD
29,976
-610
-25,143
1,550
MXN
-30,056
5,200
25,670
-5,404
This latest COT data is through Tuesday and shows a quick view of how large speculators or non-commercials (for-profit traders) as well as the commercial traders (hedgers & traders for business purposes) were positioned in the futures markets. All currency positions are in direct relation to the US dollar where, for example, a bet for the euro is a bet that the euro will rise versus the dollar while a bet against the euro will be a bet that the dollar will gain versus the euro.
Weekly Charts: Large Trader Weekly Positions vs Price
EuroFX:
Euro bets fell for a second week and went further into bearish territory. Euro positions were over the +100,000 contracts level just fourteen weeks ago
British Pound Sterling:
British pound sterling bets dropped for a fifth straight week and the overall position continues to be at the most bearish level since May 2nd 2017
Japanese Yen:
Japanese yen bearish bets declined for a fourth week in a row. Current positions are at the least bearish of the past six weeks
Swiss Franc:
Swiss franc bets continued to push more bearish as the current standing is at the most bearish level since June 26th of 2007 when the net position totaled -58,831 contracts
Canadian Dollar:
Canadian dollar bets fell for a second week after improving in the previous four weeks. The overall position has now been in bearish territory for the past twenty-two weeks
Australian Dollar:
Australian dollar bets improved for a second week although they remain bearish. The overall position has now been in a bearish standing for twenty-one straight weeks and above the -50,000 contract level for the past four weeks
New Zealand Dollar:
New Zealand dollar bearish positions declined last week although they remain in very bearish territory for this currency. The current position has been above the -20,000 net contract level for the past eight weeks and hovering right around the most bearish level on record
Mexican Peso:
Mexican peso positions fell for a second straight week this week but remain in bullish territory (the only non-dollar currency with bullish net contracts). The peso has now been in an overall bullish position for the past eight weeks
*COT Report: The weekly commitment of traders report summarizes the total trader positions for open contracts in the futures trading markets. The CFTC categorizes trader positions according to commercial hedgers (traders who use futures contracts for hedging as part of the business), non-commercials (large traders who speculate to realize trading profits) and nonreportable traders (usually small traders/speculators). Find CFTC criteria here: (http://www.cftc.gov/MarketReports/CommitmentsofTraders/ExplanatoryNotes/index.htm).
The Commitment of Traders report is published every Friday by the Commodity Futures Trading Commission (CFTC) and shows futures positions data that was reported as of the previous Tuesday (3 days behind).
Each currency contract is a quote for that currency directly against the U.S. dollar, a net short amount of contracts means that more speculators are betting that currency to fall against the dollar and a net long position expect that currency to rise versus the dollar.
(The charts overlay the forex closing price of each Tuesday when COT trader positions are reported for each corresponding spot currency pair.) See more information and explanation on the weekly COT report from the CFTC website.
The latest data for the weekly Commitment of Traders (COT) report, released by the Commodity Futures Trading Commission (CFTC) on Friday, showed that large traders and currency speculators once again boosted their bets for the US Dollar Index this week while also raising their bearish bets for the euro and British pound sterling. See full article
The non-commercial contracts of WTI crude futures totaled a net position of 538,785 contracts, according to data from this week. This was a slide of -34,643 contracts from the previous weekly total. See full article
The large speculator contracts of gold futures totaled a net position of -8,710 contracts. This was a weekly decline of -5,022 contracts from the previous week. See full article
The large speculator contracts of 10-year treasury note futures totaled a net position of -700,514 contracts. This was a weekly reduction of -2,320 contracts from the previous week. See full article
The non-commercial contracts of silver futures totaled a net position of -7,158 contracts, according to data from this week. This was a weekly fall of -4,322 contracts from the previous totals. See full article
The large speculator contracts of copper futures totaled a net position of -1,699 contracts. This was a weekly shortfall of -4,787 contracts from the data of the previous week. See full article
The Commitment of Traders report data is published in raw form every Friday by the Commodity Futures Trading Commission (CFTC) and shows the futures positions of market participants as of the previous Tuesday (data is reported 3 days behind).