During yesterday’s trading, the US dollar rose slightly against the basket of major currencies. The US dollar index (#DX) closed in the positive zone (+0.13%). The US currency strengthened due to the weakness of other currencies. Thus, the Canadian dollar fell significantly after the publication of weak data on Canada’s GDP. The index counted to 0.0% in June, while investors expected a value of 0.1%. The single currency has moved away from the monthly highs. This movement was mostly caused by technical factors.
The Japanese yen is strengthening against the US dollar, as demand for safe assets has increased again. Today, the base consumer price index was published in Tokyo, which counted to 0.9% and was above the expected value of 0.8%. Also, the index of economic activity in the non-manufacturing sector of China was released, its value was 51.3 instead of the predicted value of 51.0. We expect economic statistics from the Eurozone.
The “black gold” prices are rising. At the moment, futures for the WTI crude oil are testing a mark of $70.25 per barrel.
Market Indicators
Yesterday, the bearish sentiment was observed in the US stock market: #SPY (-0.40%), #DIA (-0.51%), #QQQ (-0.18%).
At the moment, the yield of 10-year US government bonds is at the level of 2.86% -2.87%.
The news feed on 31.08.2018:
– The consumer price index in the Eurozone at 12:00 (GMT+3:00).
On Thursday the 30th of August, trading on the EURUSD pair closed down. After an unsuccessful attempt by bulls to return the rate to 1.1734, the euro shed 65 pips against the dollar to reach 1.1642.
The US dollar index started growing on the back of a retreat from risky assets caused by a decline in currencies from developing countries (Turkish lira, South African rand, and the Argentinian peso). Moreover, another potential factor that favours the dollar is the positive PCE report released in the US.
17:00 US: Michigan consumer sentiment index (Aug).
20:00 US: Baker Hughes US oil rig count.
Fig 1. EURUSD hourly chart.
Current situation:
The EURUSD pair has moved into the sell zone. After breaking 1.1682 (dotted line), the rate slid to the trend line at 1.1642. My expectations for yesterday came off in full, only I didn’t manage to take advantage of the price jump to 1.1718 and short the euro.
On the hourly timeframe, from a technical standpoint, factors for the euro are neutral. The pair is trading around the balance line. I reckon the euro bears will test the strength of the trend line in the European session. In my forecast, however, I’m not expecting the euro to drop sharply because I think that the EURGBP pair has found a support at 0.9950. The euro crosses are currently providing a mixed picture.
Considering that hourly cycles and intraday patterns suggest that the euro will close the day up, I’m expecting an initial drop to around 1.1637 – 1.1645, followed by a rebound to 1.1687.
As we can see in the H4 chart, XAUUSD has reached the resistance level and right now is forming Hammer, Doji, and Harami reversal patterns there. Judging by the previous movements, it may be assumed that the price may complete the pullback and then continue its ascending movement.
NZDUSD, “New Zealand vs. US Dollar”
As we can see in the H4 chart, NZDUSD is still trading upwards; right now, it is being corrected once again and forming Hammer and Inverted Hammer reversal patterns. Judging by the previous movements, it may be assumed that the instrument is forming another pullback before starting a new growth.
Attention! Forecasts presented in this section only reflect the author’s private opinion and should not be considered as guidance for trading. RoboForex LP bears no responsibility for trading results based on trading recommendations described in these analytical reviews.
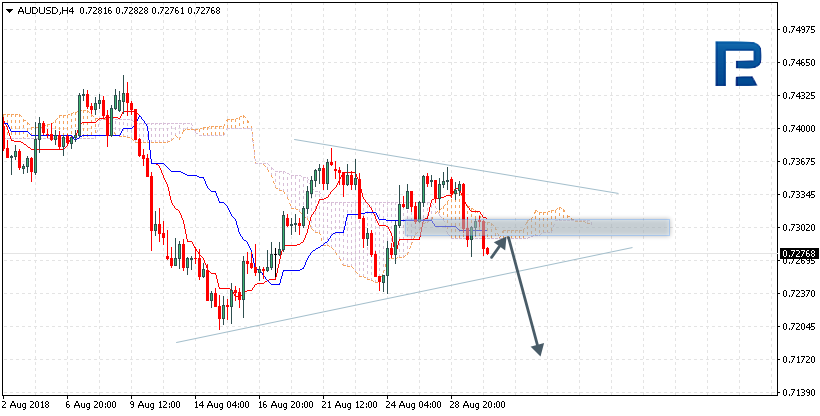
AUDUSD is trading at 0.7276; the instrument is moving below Ichimoku Cloud, which means that it may continue falling. The markets could indicate that the price may test the downside border of the cloud at 0.7295 and then resume moving downwards to reach 0.7175. Another signal to confirm further descending movement is the price’s rebounding from the resistance level. However, the scenario that Implies further decline may be cancelled if the price breaks the upside border of the cloud and fixes above 0.7335. In this case, the pair may continue growing towards 0.7435. After breaking the downside border of the Triangle pattern and fixing below 0.7240, the price may continue moving downwards.
NZDUSD, “New Zealand Dollar vs US Dollar”
NZDUSD is trading at 0.6650; the instrument is moving inside Ichimoku Cloud, which means that it is moving sideways. The markets could indicate that the price may test the upside border of the cloud at 0.6665 and then continue moving downwards to reach 0.6565. Another signal to confirm further descending movement is the price’s rebounding from the downside border of the Wedge pattern. However, the scenario that implies further decline may be cancelled if the price breaks the upside border of the cloud and fixes above 0.6685. In this case, the pair may continue growing towards 0.6750. After breaking the cloud’s downside border and fixing below 0.6610, the price may continue moving downwards.
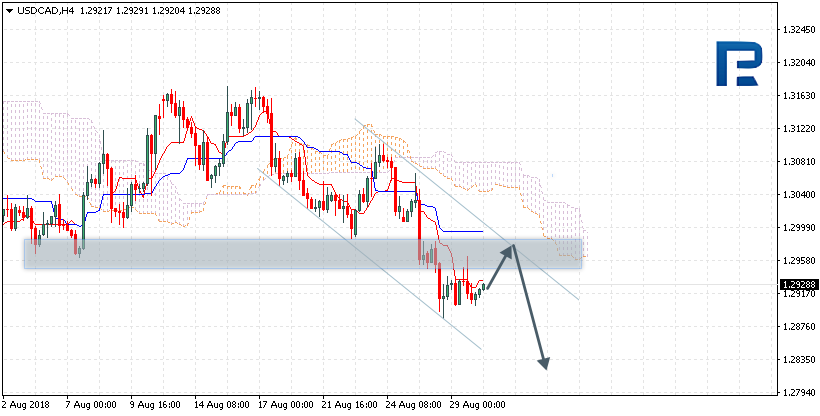
USDCAD, “US Dollar vs Canadian Dollar”
USDCAD is trading at 1.2928; the instrument is moving below Ichimoku Cloud, which means that it may continue falling. The markets could indicate that the price may test Tenkan-Sen and Kijun-Sen at 1.2970 and then continue moving downwards to reach 1.2825. Another signal to confirm further descending movement is the price’s rebounding from the resistance level. However, the scenario that implies further decline may be cancelled if the price breaks the upside border of the cloud and fixes above 1.3030. In this case, the pair may continue growing towards 1.3150.
Attention! Forecasts presented in this section only reflect the author’s private opinion and should not be considered as guidance for trading. RoboForex LP bears no responsibility for trading results based on trading recommendations described in these analytical reviews.
The bullish sentiment is still prevailing on the EUR/USD currency pair. At the same time, the growth of quotes is quite restrained. Investors expect additional drivers. At the moment, the key support and resistance levels are 1.16800 and 1.17250, respectively. We recommend opening positions from these marks. The trading instrument has the potential for further growth.
The news feed on 2018.08.30:
– Report on the labor market in Germany at 10:55 (GMT+3:00).
Indicators point to the power of buyers: the price has fixed above 50 MA and 200 MA.
The MACD histogram is located in the positive zone, but below the signal line, which gives a weak signal to buy EUR/USD.
Stochastic Oscillator is in the neutral zone, the %K line is above the %D line, which indicates the bearish sentiment.
Trading recommendations
Support levels: 1.16800, 1.16300, 1.15800
Resistance levels: 1.17250, 1.17600
If the price fixes above 1.17250, the EUR/USD currency pair is expected to grow. The movement is tending to 1.17600-1.17800.
Alternative option. If the price fixes below the support level of 1.16800, we recommend considering sales of EUR/USD. The movement is tending to 1.16300-1.16000.
The GBP/USD currency pair
Technical indicators of the currency pair:
Prev Open: 1.28642
Open: 1.30244
% chg. over the last day: +1.23
Day’s range: 1.30227 – 1.30433
52 wk range: 1.2361 – 1.4345
Yesterday, aggressive purchases were observed on the GBP/USD currency pair. The growth of quotes exceeded 150 points. The British pound is growing after the statements by the EU chief Brexit negotiator, Barnier. According to the official, the European Union is ready to offer Britain a “unique” deal after its exit from the union. At the moment, the key support and resistance levels are 1.30000 and 1.30450, respectively. The positions should be opened from these marks.
Today, the news feed on the UK economy is calm.
Indicators point to the power of buyers: the price is being traded above 50 MA and 200 MA.
The MACD histogram is in the positive zone, but below the signal line, which gives a weak signal to buy GBP/USD.
Stochastic Oscillator is located in the neutral zone, the %K line is crossing the %D line. There are no signals at the moment.
Trading recommendations
Support levels: 1.30000, 1.29600, 1.29100
Resistance levels: 1.30450, 1.30800
If the price fixes above 1.30450, further growth of the GBP/USD currency pair is expected. The target movement level is 1.30800-1.31000.
Alternative option. If the price fixes below the round level of 1.30000, we recommend considering sales of GBP/USD. The target movement level is 1.29600-1.29400.
The USD/CAD currency pair
Technical indicators of the currency pair:
Prev Open: 1.29257
Open: 1.29077
% chg. over the last day: -0.20
Day’s range: 1.29067 – 1.29202
52 wk range: 1.2059 – 1.3795
There is a variety of trends on the USD/CAD currency pair. Investors expect statistics on Canada GDP. At the moment, the key support and resistance levels are 1.29000 and 1.29300, respectively. The positions should be opened from these marks. We recommend monitoring current information regarding NAFTA negotiations.
The news feed on 2018.08.30:
– Data on Canada GDP at 15:30 (GMT+3:00).
Indicators point to the power of sellers: the price has fixed below 50 MA and 200 MA.
The MACD histogram is in the negative zone, but above the signal line, which gives a weak signal to sell USD/CAD.
Stochastic Oscillator is located in the neutral zone, the %K line is below the %D line, which indicates the bearish sentiment.
Trading recommendations
Support levels: 1.29000, 1.28600
Resistance levels: 1.29300, 1.29600, 1.30000
If the price fixes below the round level of 1.29000, the USD/CAD quotes are expected to decline. The movement is tending to 1.28600-1.28400.
Alternative option. If the price fixes above the resistance level of 1.29300, it is necessary to consider purchases of USD/CAD. The movement is tending to 1.29600-1.29800.
The USD/JPY currency pair:
Technical indicators of the currency pair:
Prev Open: 111.190
Open: 111.691
% chg. over the last day: +0.45
Day’s range: 111.581 – 111.687
52 wk range: 104.56 – 114.74
Yesterday, the bullish sentiment was observed on the USD/JPY currency pair. At the moment, quotes are moving in flat. Local support and resistance levels are 111.500 and 111.750, respectively. The positions should be opened from these marks. Investors expect additional drivers. The trading instrument has the potential for further growth.
The publication of important economic reports from Japan is not planned.
Indicators point to the power of buyers: the price has fixed above 50 MA and 200 MA.
The MACD histogram is in the positive zone, but below the signal line, which gives a weak signal to buy USD/JPY.
Stochastic Oscillator is located in the neutral zone, the %K line is below the %D line, which indicates a fall in the USD/JPY quotes.
Trading recommendations
Support levels: 111.500, 111.200, 110.850
Resistance levels: 111.750, 112.000
If the price fixes above the resistance level of 111.750, it is necessary to consider purchases of USD/JPY. The movement is tending to 112.000-112.300.
Alternative option. If the price fixes below 111.500, the USD/JPY currency pair is expected to decline. The movement is tending to 111.200-110.000.
The US dollar slightly weakened against the basket of major currencies during yesterday’s trading. The US dollar index (#DX) closed in the negative zone (-0.19%). The demand for risky assets has grown significantly amid the optimistic news. The United States and Mexico reached an agreement on the North American Free Trade Area (NAFTA). Investors expect Canada to join the new trade agreement. The British pound is growing after the statements by the EU chief Brexit negotiator, Barnier. According to the official, the European Union is ready to offer Britain a “unique” deal after its exit from the union. Today, we expect important economic statistics from Germany and Canada.
In general, demand for the US currency is still high. Yesterday, the US dollar was supported by positive data on the US GDP. Thus, in the second quarter, the GDP index counted to 4.2% and was better than the forecasted value of 4.0%. However, the US pending home sales index fell to -0.7% in July instead of 0.3%.
The “black gold” prices are rising after the release of data on crude oil inventories in the US. At the moment, futures for the WTI crude oil are testing a mark of $69.70 per barrel.
Market Indicators
Yesterday, the bullish sentiment was observed in the US stock market: #SPY (+0.54%), #DIA (+0.26%), #QQQ (+1.15%).
At the moment, the 10-year US government bonds yield is at the level of 2.88%-2.89%.
The news feed on 2018.08.30:
– Report on the labor market in Germany at 10:55 (GMT+3:00); – Data on Canada GDP at 15:30 (GMT+3:00).
On Wednesday the 29th of August, trading on the euro closed up despite falling during the first half of the day. The main driver for the pair’s growth was an increased appetite for risk among investors, as well as a decline on the dollar which was brought about by a sharp rise on the British pound. The pound gained 160 pips, or 1.3% against the dollar. This put pressure on the euro against the dollar and sunk the EURGBP cross pair.
The pound’s rally was started by the EU’s chief Brexit negotiator, Michel Barnier, who said that the EU was prepared to offer the UK unique partnership, “such as there has never been with any other third country”. The euro shot up later to trade above 1.17.
Day’s news (GMT+3):
10:00 Switzerland: KOF leading indicator (Aug).
10:55 Germany: unemployment change (Aug).
11:30 UK: M4 money supply (Jul), mortgage approvals (Jul), net lending to individuals (Jul).
15:00 Germany: harmonised index of consumer prices (Aug).
15:30 Canada: GDP (Jun).
15:30 US: core personal consumption expenditure – price index (Jul), personal spending (Jul), personal income (Jul), initial jobless claims (24 Aug).
20:30 Germany: German Buba President Weidmann speech.
Fig 1. EURUSD hourly chart.
Current situation:
On Wednesday, our pair dropped to 1.1652 without any preceding pullbacks. Having broken the 45thdegree, it bounced off the 67th degree to jump 56 pips. This reminds me of a joke about a trader. A trader jumps out of a 75th-floor window on Wall St. After hitting the ground, he bounces 10 metres in the air, thereby recovering some of his losses.
Following a false breakout, I’ve adjusted the trend line to run through the latest low (dotted line on the chart). Weekly intraday patterns and hourly cycles suggest that the euro is set to drop through to the end of the US session. This is exactly the scenario I have in my forecast.
Considering that the crosses are trading up, I think that a good place for shorting the euro would be between 1.1715 and 1.1720. If the EURGBP pair reverses upwards, the euro will make a significant jump. There’s a risk of reaching a new high. We’ll have to play it by ear; keep track of the crosses, the general direction of the dollar index, the yen, and US10Y bond yields.
The Turkish lira lost a lot of ground against the dollar on Wednesday. If pressure on it remains up until the weekend, investors may start retreating to the safety of the yen. In this case, a retreat from risky assets will provide support to sellers, and it will be easier for them to move downwards.
If the trend line at around 1.1685 gets broken, this will open the way for sellers to the basis of the trend line at 1.1658 (around yesterday’s low).
Lots and lots. Trading is not easy, period. But a few things can help.
By Elliott Wave International
Here’s a cool parlor trick: If you want to bring a loud, rowdy room to a screeching silence, ask if anyone can explain how cryptocurrencies work.
Cue crickets chirping.
Turns out, the “crypto” part of the name originally signified the encrypted nature of digital assets and their anonymous owners. But it’s proven foretelling, as cryptocurrencies have become synonymous with a cryptic impenetrability the likes of which no modern mainstream financial market — especially not one so fervently embraced — has known.
Even the experts are stumped by the exact logistics involved in cryptocurrencies, as these recent opinions suggest:
“[Cryptocurrencies] are volatile by nature and thus don’t follow traditional rules and conventions.” (May 22 Coindiary.net)
“The public’s fascination with cryptocurrencies is tied to a sort of mystery, like the mystery of the value of money itself, consisting in the new money’s connection to advanced science. (May 21 The Guardian)
That’s the bad news.
But we’re happy to bring you the good news; namely: You don’t have to understand how cryptocurrencies work in order to forecast them.
For Elliotticians, the ultimate skeleton key to unlocking the mystery price moves of cryptocurrencies is Elliott wave analysis. After all, cryptos, like any other market, are traded in the open marketplace, where big groups of buyers and sellers try to outsmart each other, bidding prices up or down. Whenever large groups of people engage in collective activities, group psychology emerges. And few other market-forecasting tools are as good at predicting changes in market psychology as Elliott waves.
Strategy #1: Stand Apart from the Crowd’s “Madness”
The 2013 Amazon Finance bestseller, Visual Guide to Elliott Wave Trading, states,
“If you aim to be a consistently successful trader, then you must have a defined forecasting methodology — a simple, clear, and concise way of looking at markets to predict what’s coming. Guessing or going on gut instinct won’t work over the long run.
“If you don’t have a defined methodology, then you don’t have a way to know what constitutes a buy or sell signal.”
For thousands professional and individual traders around the world, that methodology is the Elliott Wave Principle. If you’re new to it, you can summarize its basic tenets as follows:
Group psychology swings from excessive optimism to pessimism, and back again
In the markets, group psychology forms repeating patterns in price charts
Because these price patterns repeat, they are also predictable
Once you know which of the 13 known Elliott wave patterns your market is in, you can make a probability-based forecasts as to what’s next.”
But what about using this methodology on actual cryptocurrency price charts?
Well, let’s pick the world’s largest and first-established market, Bitcoin. On July 12, Bitcoin was eight days into a pernicious losing streak with no obvious relief in sight. Wrote one July 12 news source:
“Bitcoin is spiraling downwards, and this time the downside seems unstoppable.” (FX Street)
But for our Cryptocurrency Pro Service team, a very telling price pattern emerged front and center on Bitcoin’s chart: an Elliott third wave. On July 12, Cryptocurrency Pro Service prepped the bullish stage and wrote:
“A swift move up through 6390.04 will add confidence to the idea wave (ii) has bottomed and Bitcoin is headed higher. A third-wave advance, wave (iii) should eventually see Bitcoin trade well above 7000.00.“
The next chart moves forward in time and shows how Bitcoin’s prices rose, in-line with the Elliott wave rally scenario:
The truth is, cryptocurrencies are cryptic. Heck, when’s the last time a secret person with a fake alias created an untraceable currency for people to trade on an unregulated platform? Try NEVER!
Cryptocurrencies are also volatile, and thus risky as powder kegs. Every day, a new alt ICO coin debuts, named after some science fiction character or comic book hero (see: DASH, RIPPLE, NEO, TRON, and so on). Maybe one day, one of them will become another Bitcoin.
For those investors willing to commit to only the most reputable and proven crypto markets, and to choosing price charts that only exhibit clear and definable Elliott wave patterns — there is a way to probe the mysterious nature of crypto markets and identify high-probability setups.
Our free report “Crypto Trading Guide: 5 Simple Strategies to Catch the Next Opportunity” explains more. Each chapter demonstrates the power of the Elliott Wave Principle to explain some of the most unforgettable recent moves in the world’s top three cryptocurrencies: Bitcoin, Litecoin and Ethereum.
The free report gives you real-world charts and commentary from our top analysts as they navigate near- and long-term trend changes few others saw coming.
For example, remember back in 2012, when Bitcoin’s reputation and value was being bludgeoned to a pulp? One coin was barely worth $10. And yet, our president and Elliott Wave Theorist editor, Robert Prechter, saw a sea change in the currency’s future.
Consider this quote from the August 2012 issue of The Elliott Wave Theorist:
“Presuming Bitcoin succeeds as the world’s best currency — and I believe it will — it should rise many more multiples in value over the years.
“Be prepared to ignore the bad news, which will give other investors reasons to justify selling at the bottom.”
Result: Bitcoin went from $15 per coin in 2013 to $20,000 at its height in December 2017 — a gargantuan 133,233% gain.
The key to success in cryptos is to approach this wild market in a way that insulates you from the hype, frenzy and rumors — and helps you act when others flounder. Our free crypto trading guide helps you do exactly that. Read the complete “Crypto Trading Guide: 5 Simple Strategies to Catch the Next Opportunity“ now to better understand this fascinating market and all the potential opportunities it can offer.
This article was syndicated by Elliott Wave International and was originally published under the headline What’s So “Cryptic” About Trading Cryptocurrencies?. EWI is the world’s largest market forecasting firm. Its staff of full-time analysts led by Chartered Market Technician Robert Prechter provides 24-hour-a-day market analysis to institutional and private investors around the world.
Utah holds the largest reserves of oil sands in the United States, but up until now, no company had the technology to exploit these vast resources.
Despite the potential, “only a few companies are pursuing the price-sensitive and water-intensive development of the state’s oil shale and oil sand resources,” the EIA said in a 2017 report on the state, essentially writing off the region as a meaningful opportunity.
But that could change in the very near future. Petroteq Energy hopes to bring the first commercially profitable oil sands production online in the United States in the next few weeks.
“We have a very disruptive technology,” David Sealock, Petroteq’s CEO, told the New York Times in a sweeping profile of the innovative oil sands company. “There was a treasure chest here that didn’t have a key, and this technology is the key.”
Unlike Canada’s oil sands, characterized by vast toxic tailings ponds and environmental destruction, Petroteq has pioneered a breakthrough approach to oil sands production that minimizes the environmental impact.
Petroteq uses a proprietary technology involving solvents that cleanly extract heavy oil sands by separating out the oil from the rock. Crucially, unlike destructive processes used in Alberta, Petroteq’s approach uses no water at all and does not pollute the soil. “What’s in Canada is an environmental nightmare,” Jerry Bailey, president of Petroteq, told the NYTimes. “With our operation, nothing goes in the air, nothing goes in the ground, and there is no water involved.”
The company crushes oil sands, mixes it with solvents, and spins the mixture in centrifuges. The process yields oil separated from the sand. The sand, free of oil and solvents, can be returned to the earth, while the solvents can be reused. The entire process makes a mockery of traditional oil sands processing, which involves vast quantities of water, chemicals, heat and toxic fallout.
On top of that, Utah would not have the same pipeline trouble that has plagued Canada’s oil sands. Producers in Alberta have proposed several pipeline projects that would essentially travel the length of the North American continent, several of which have been blocked at every turn, most notably TransCanada’s Keystone XL pipeline. Utah oil producers such as Petroteq wouldn’t have this problem. Petroteq sells its crude to local refineries, which can process the oil into diesel fuel.
These aren’t starry-eyed dreamers, but rather seasoned industry veterans. Sealock used to work for Chevron and two oil sands companies in Canada, while Bailey is a former ExxonMobil President.
They are starting small, but have huge ambitions. Petroteq has plenty of oil to work with, and the company is eyeing the 14 to 15 billion barrels of estimated oil sands reserves in Utah, plus more in the surrounding Rocky Mountain States. But, obviously, Utah is not the only place in the world with heavy oil sands. Petroteq wants to license its technology to companies in Australia, Colombia, Trinidad & Tobago and many other places.
The big question, though, is whether or not the company can make a profit. Petroteq claims it can breakeven with oil prices at just $32 per barrel, putting it on par with some of the most competitive shale basins in the U.S., including the Permian basin. And with WTI trading just below $70 per barrel, there is a large margin of error to work with.
Independent analysts are somewhat impressed, if guarded, about the novelty of the new technology. “The price is now in a zone where Petroteq can possibly justify what they are trying to do,” Kevin Birn, an oil sands expert at IHS Markit, told the NYTimes. “If the last decade has told us anything, I’d hesitate to rule out the potential for technology to generate new sources of energy supply.”
Petroteq is currently producing 1,000 barrels per day, with a plan to scale that up to 5,000 barrels per day in three years. To be sure, this is a relatively minor operation in the grand scheme of things, but it would likely spark broader investor interest, clearing the way for Utah’s oil sands industry.
By Charles Kennedy for Oilprice.com
NOT AN INVESTMENT ADVISOR. Oilprice.com is not registered or licensed by any governing body in any jurisdiction to give investing advice or provide investment recommendation. ALWAYS DO YOUR OWN RESEARCH and consult with a licensed investment professional before making an investment. This communication should not be used as a basis for making any investment.
RISK OF INVESTING. Investing is inherently risky. While a potential for rewards exists, by investing, you are putting yourself at risk. You must be aware of the risks and be willing to accept them in order to invest in any type of security. Don’t trade with money you can’t afford to lose. This is neither a solicitation nor an offer to Buy/Sell securities.
RISK OF BIAS. We often own shares in the companies we feature. For those reasons, please be aware that we are extremely bias in regards to the companies we write about and feature in our newsletter and on our website.
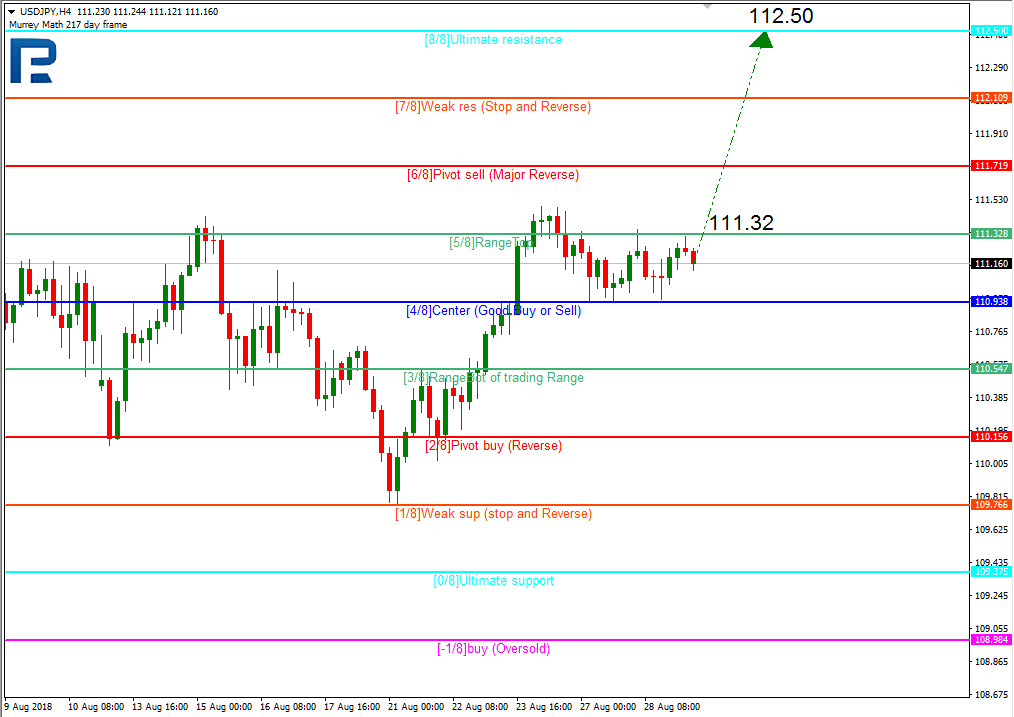
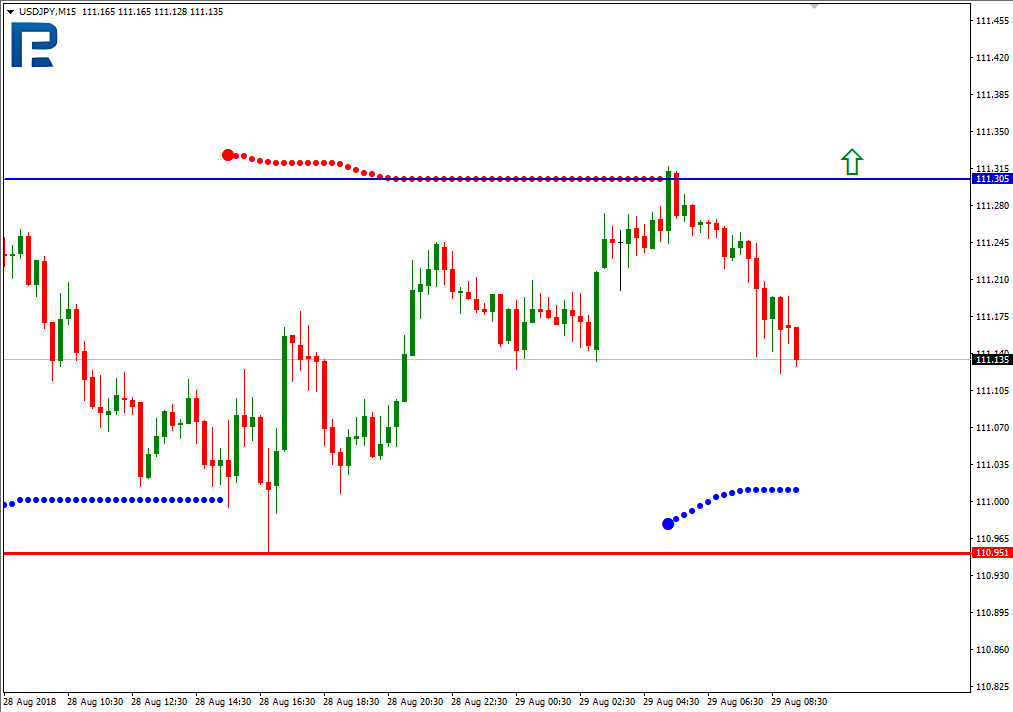
As we can see in the H4 chart, USDJPY is consolidating between the 3/8 and 5/8 levels. In this case, the price is expected to break the 5/8 level and continue growing towards the resistance at the 8/8 one.
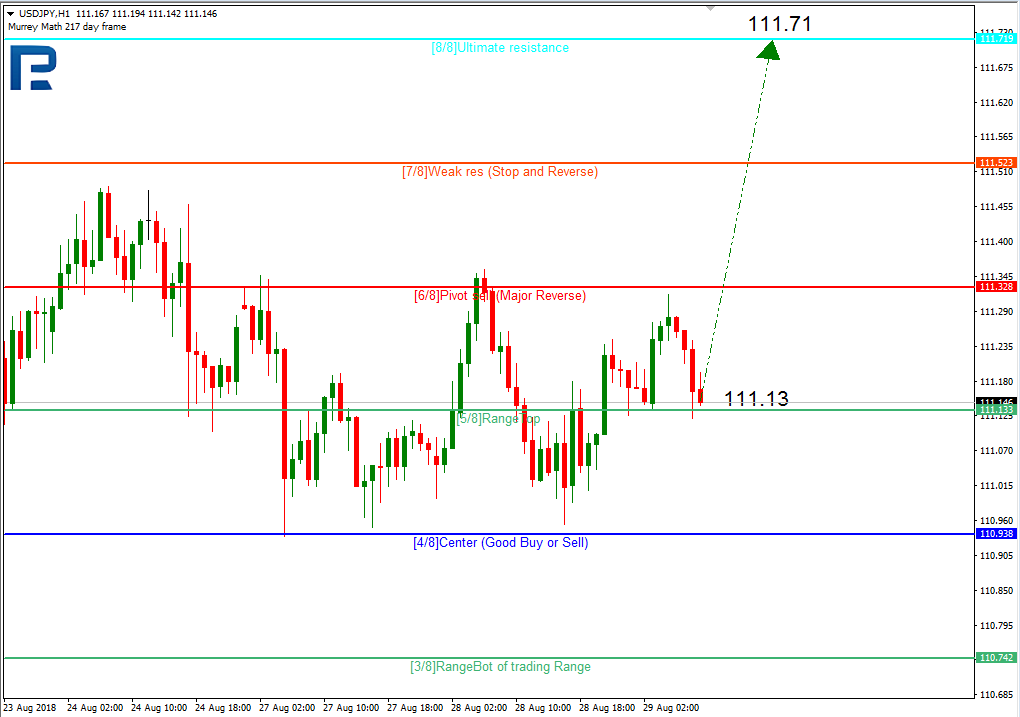
In the H1 chart, the price may rebound from the 5/8 level and resume trading upwards to reach the resistance at the 8/8 one.
In the M15 chart, the pair may break the upside line of the VoltyChannel indicator and, as a result, continue moving upwards.
USDCAD, “US Dollar vs Canadian Dollar”
In the H4 chart, USDCAD may test the 3/8 level, rebound from it, and then resume growing towards the resistance at the 5/8one.
As we can see in the H1 chart, EURUSD is trading inside the “oversold zone” below the 0/8 level. If the price breaks the resistance at the 0/8 level, the instrument may continue growing towards the 5/8 level.
In the M15 chart, the pair may break the upside line of the VoltyChannel indicator and, as a result, continue moving upwards.
Attention! Forecasts presented in this section only reflect the author’s private opinion and should not be considered as guidance for trading. RoboForex LP bears no responsibility for trading results based on trading recommendations described in these analytical reviews.