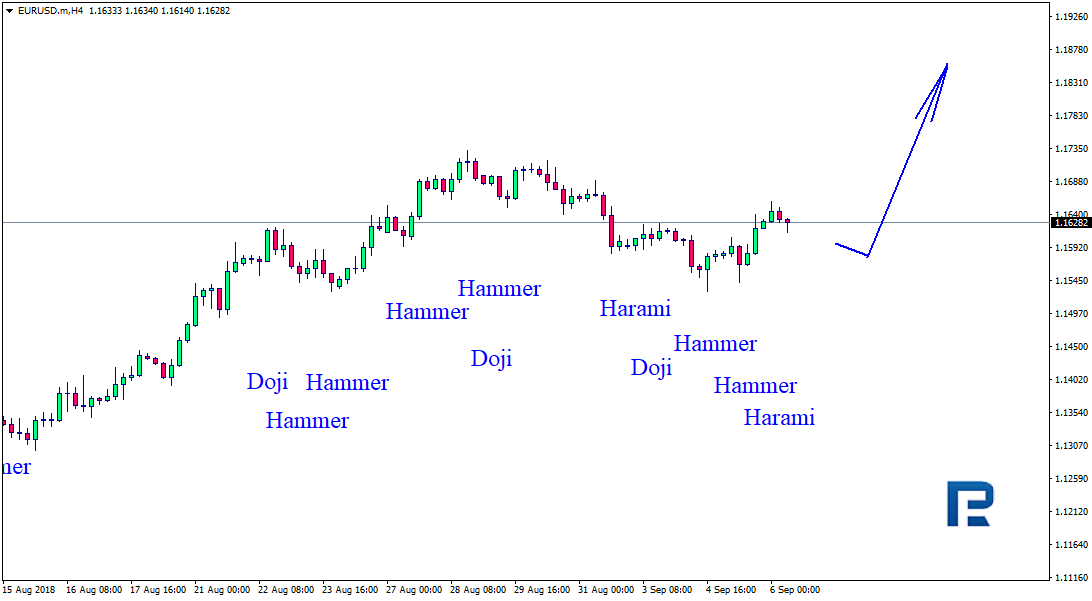
As we can see in the H4 chart, EURUSD continues growing and forming Hammer, Harami, and Doji reversal patterns during pullbacks. At the moment, it may be assumed that these patterns indicate that the instrument completed another correction and may resume its rising tendency.
USDJPY, “US Dollar vs. Japanese Yen”
As we can see in the H4 chart, after rebounding from the resistance level once again, USDJPY has formed Hammer, Inverted Hammer, and Engulfing reversal patterns. Judging by the previous movement, it may be assumed that the instrument may complete the correction and start a new ascending tendency.
Attention! Forecasts presented in this section only reflect the author’s private opinion and should not be considered as guidance for trading. RoboForex LP bears no responsibility for trading results based on trading recommendations described in these analytical reviews.
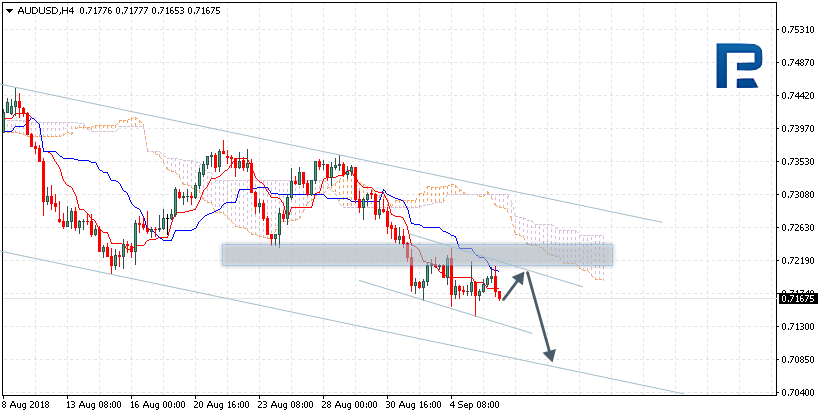
AUDUSD is trading at 0.7165; the instrument is moving below Ichimoku Cloud, which means that it may continue falling. The markets could indicate that the price may test Tenkan-Sen and Kijun-Sen at 0.7195 and then resume moving downwards to reach 0.7075. Another signal to confirm further descending movement is the price’s rebounding from the resistance level. However, the scenario that Implies further decline may be cancelled if the price breaks the upside border of the cloud and fixes above 0.7265. In this case, the pair may continue growing towards 0.7435. After breaking the channel’s downside border and fixing below 0.7060, the price may continue moving downwards.
NZDUSD, “New Zealand Dollar vs US Dollar”
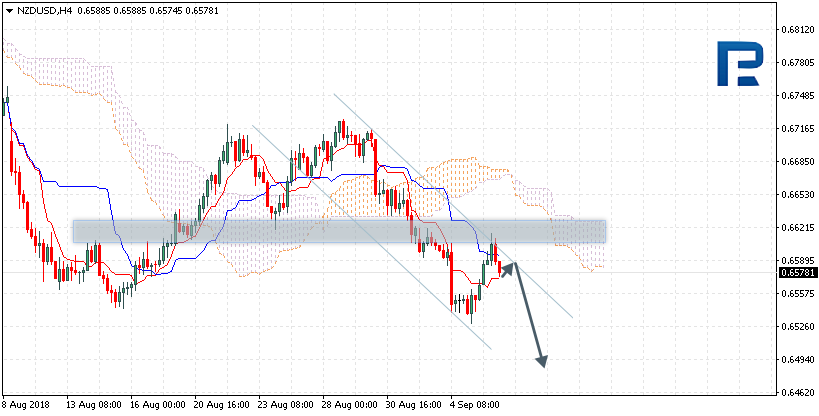
NZDUSD is trading at 0.6578; the instrument is moving below Ichimoku Cloud, which means that it may continue falling. The markets could indicate that the price may test Tenkan-Sen and Kijun-Sen at 0.6580 and then continue moving downwards to reach 0.6484. Another signal to confirm further descending movement is the price’s rebounding from the resistance level. However, the scenario that implies further decline may be cancelled if the price breaks the upside border of the cloud and fixes above 0.6635. In this case, the pair may continue growing towards 0.6720.
USDCAD, “US Dollar vs Canadian Dollar”
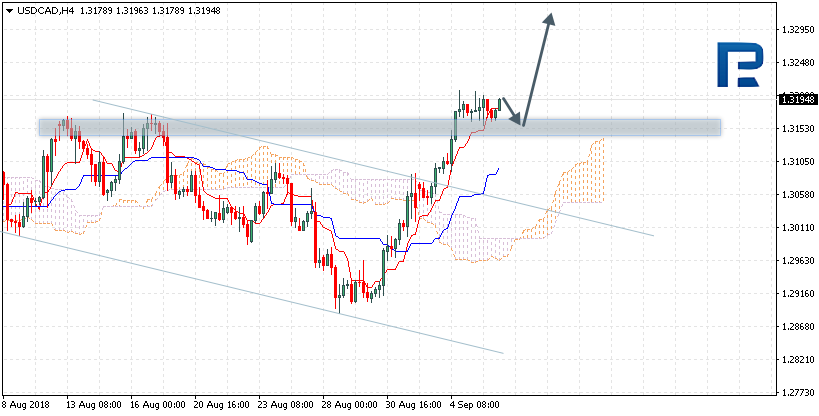
USDCAD is trading at 1.3194; the instrument is moving above Ichimoku Cloud, which means that it may continue growing. The markets could indicate that the price may test Tenkan-Sen and Kijun-Sen at 1.3115 and then resume moving upwards to reach 1.3320. Another signal to confirm further ascending movement is the price’s rebounding from the support level. However, the scenario that Implies further growth may be cancelled if the price breaks the downside border of the cloud and fixes below 1.3045. In this case, the pair may continue falling towards 1.2885.
Attention! Forecasts presented in this section only reflect the author’s private opinion and should not be considered as guidance for trading. RoboForex LP bears no responsibility for trading results based on trading recommendations described in these analytical reviews.
During yesterday’s trading session, the bullish sentiment prevailed on the EUR/USD currency pair. At the moment, the quotes are moving in flat. The technical pattern is ambiguous. Investors expect important economic reports from the United States. Local support and resistance levels are 1.16050 and 1.16300, respectively. Positions should be opened from these marks.
The news feed on the US economy on 2018.09.06:
– Preliminary data on the labor market from ADP at 15:15 (GMT+3:00);
– The volume of industrial orders at 17:00 (GMT+3:00);
– The index of economic activity in the non-manufacturing sector from ISM at 17:00 (GMT+3:00).
Indicators do not send accurate signals: the price has fixed between 50 MA and 200 MA.
The MACD histogram is in the positive zone, but below the signal line, which gives a weak signal to buy EUR/USD.
Stochastic Oscillator is located in the oversold zone, the %K line has crossed the %D line. There are no signals at the moment.
Trading recommendations
Support levels: 1.16050, 1.15700, 1.15350
Resistance levels: 1.16300, 1.16600, 1.16900
If the price fixes below the local support of 1.16050, the EUR/USD quotes are expected to fall. The movement is tending to 1.15700-1.15400.
Alternative option. If the price fixes above 1.16300, we recommend considering purchases of EUR/USD. The movement is tending to 1.16600-1.16900.
The GBP/USD currency pair
Technical indicators of the currency pair:
Prev Open: 1.28549
Open: 1.29018
% chg. over the last day: +0.45
Day’s range: 1.28917 – 1.29288
52 wk range: 1.2361 – 1.4345
Yesterday, aggressive purchases of GBP/USD were observed. Rumors about the progress of the Brexit negotiations supported the UK currency. According to Bloomberg, Great Britain and Germany agreed on the abolition of key mutual requirements for the process of the country’s exit from the EU. At the moment, the GBP/USD quotes are consolidating in the range of 1.28950-1.29300. The potential for growth remains. We recommend opening positions from the key levels.
The publication of important economic reports from the UK is not planned.
Indicators do not send accurate signals: the price has crossed 50 MA.
The MACD histogram is in the positive zone, but below the signal line, which gives a weak signal to buy GBP/USD.
Stochastic Oscillator is located in the neutral zone, the %K line is above the %D line, which indicates the bullish sentiment.
Trading recommendations
Support levels: 1.28950, 1.28700, 1.28250
Resistance levels: 1.29300, 1.29850, 1.30200
If the price fixes above 1.29300, further growth of the GBP/USD quotes is expected. The movement is tending to 1.29650-1.30000.
Alternative option. If the price fixes below the local support of 1.28950, we recommend considering sales of GBP/USD. The movement is tending to 1.28700-1.28500.
The USD/CAD currency pair
Technical indicators of the currency pair:
Prev Open: 1.31762
Open: 1.31760
% chg. over the last day: -0.10
Day’s range: 1.31639 – 1.31992
52 wk range: 1.2059 – 1.3795
The Bank of Canada, as expected, kept the key interest rate at the previous level of 1.50%. At the moment, the technical pattern on the USD/CAD currency pair is ambiguous. Quotes are in a sideways trend. The key trading range is 1.31600-1.32000. Financial market participants expect new information regarding the NAFTA negotiations. Positions should be opened from the key levels.
The news feed on the economy of Canada is quite calm.
The price has fixed above 50 MA and 200 MA, which signals the power of buyers.
The MACD histogram is in the positive zone and continues to rise, which also signals to buy USD/CAD.
Stochastic Oscillator reached the overbought zone, the %K line is crossing the %D line. There are no signals at the moment.
Trading recommendations
Support levels: 1.31600, 1.31000, 1.30500
Resistance levels: 1.32000, 1.32500
If the price fixes above the round level of 1.32000, further growth of the USD/CAD currency pair is expected. The movement is tending to 1.32400-1.32600.
Alternative option. If the price fixes below the local support of 1.31600, the USD/CAD quotes are expected to correct. The target level for profit-taking is 1.31300-1.31000.
The USD/JPY currency pair
Technical indicators of the currency pair:
Prev Open: 111.313
Open: 111.528
% chg. over the last day: +0.03
Day’s range: 111.171 – 111.528
52 wk range: 104.56 – 114.74
The technical pattern on the USD/JPY currency pair is still ambiguous. Quotes are consolidating. The trading instrument is testing local support and resistance levels: 111.250 and 111.450, respectively. Investors expect important economic reports from the United States. We recommend following the current information on the trade conflict between the US and China. Positions should be opened from the key levels.
The news feed on the economy of Japan is calm.
The price has fixed between 50 MA and 200 MA, which are strong dynamic support and resistance levels.
The MACD histogram has moved into the negative zone, which signals the bearish sentiment.
Stochastic Oscillator is located in the neutral zone, the %K line is crossing the %D line. There are no signals at the moment.
Trading recommendations
Support levels: 111.250, 111.000, 110.750
Resistance levels: 111.450, 111.700, 112.000
If the price fixes above the resistance level of 111.450, the USD/JPY currency pair is expected to grow. The movement is tending to 111.700-112.000.
Alternative option. If the price fixes below the level of 111.250, it is necessary to consider sales of USD/JPY. The movement is tending to 111.000-110.750.
Yesterday, a strong volatility was observed on the main currency pairs. The dollar index (#DX) closed in the negative zone (-0.33%). The GBP/USD currency pair showed the greatest activity. The pound’s rate has started growing against the rumors about the progress of the Brexit negotiations. According to Bloomberg, Britain and Germany agreed on the abolition of key mutual requirements for the process of the country’s exit from the EU. At the moment, the GBP/USD quotes are testing the round level of 1.2900.
The Bank of Canada, as expected, kept the key interest rate at the previous level of 1.50%. The regulator said that the country’s economy is developing in accordance with the forecasts. At the same time, representatives of the Central Bank are concerned about continuous negotiations regarding new agreement on NAFTA. Investors expect a publication of important statistics on the US economy.
Oil quotes are moderately declining. At the moment, futures for the WTI crude oil are testing a mark of $68.60 per barrel. At 18:00 (GMT+3:00) data on the US crude oil inventories will be published.
Market Indicators
Yesterday, the major US stock indices showed mixed results: #SPY (-0.27%), #DIA (+0.07%), #QQQ (-1.29%).
At the moment, the 10-year US government bonds yield is at the level of 2.90-2.91%.
Important economic reports from the US on 06.09.2018:
– Preliminary statistics on the US labor market at 15:15 (GMT+3:00); – The volume of industrial orders at 17:00 (GMT+3:00); – The index of economic activity in the non-manufacturing sector from ISM at 17:00 (GMT+3:00).
On Wednesday the 5th of September, trading on the euro closed up. Market volatility was high during both the European and US sessions. At the beginning of the European session, the single currency dropped against the dollar from 1.1608 to 1.1543. In the US session, the euro bulls pushed the session high up from 1.1608 to 1.1640.
The greenback came under pressure from a rising pound, which occurred on the back of a Bloomberg report that the UK and Germany have decided to give up certain demands, which should make it easier for the sides to reach a deal. This unexpected piece of news fits in with my market expectations, although I haven’t accounted for volatility.
Day’s news (GMT+3):
09:00 Germany: factory orders (Jul).
15:15 US: ADP employment change (Aug).
15:30 Canada: building permits (Jul).
15:30 US: nonfarm productivity (Q2), unit labour costs (Q2), initial jobless claims (31 Aug).
15:45 Eurozone: ECB’s Lautenschläger Speech.
16:45 US: Markit services PMI (Aug).
17:00 US: ISM non-manufacturing PMI (Aug), factory orders (Jul).
17:30 US: EIA crude oil stocks change (31 Aug), FOMC member Williams speech.
Fig 1. EURUSD hourly chart.
Current situation:
Now let’s look at the hourly chart. While the pair has deviated from my weekly projection, I haven’t removed it from the chart because the rate has now returned to its projected level on the hourly cycles. I’ve double-checked the cycles and nothing has changed. The pair just strayed from the weekly projection for a bit.
Given yesterday’s pricing model, I’m prepared to entertain the possibility of a double top formation, although the general technical picture suggests a jump to the 67th degree. 1.1605 will act as a support today. The market has been swinging for the last few days, so don’t expect volatility to subside and be ready to see some full retracements of previous movements. I don’t really have any trading ideas to apply to my forecast. I think that today, everyone will be preparing for tomorrow’s nonfarm payrolls report.
We’ve seen it with Europe and NATO, with China, Russia, and now strongly with Canada and the NAFTA pact – President Trump’s has a very unorthodox approach to the countries he’s trading with, and he always leaves you wondering which one he considers a friend, and which one an adversary. The ongoing international trade war also contributes to the impression that
Trump treats longstanding allies as economic foes. In recent months, Trump has focused on traditional allies and trading partners in his attempt to reshape America’s international trade relationships.
The actions of the Trump administration arise partly from personality and partly from political reality. In business, he was the king of the deal, a ruthless negotiator, happy to use strong arm tactics in a gladiatorial bid for the best deal. The success of these methods in business has turned them into his primary method of negotiation: the willingness to bully, threaten and intimidate. Donald Trump cannot turn away from the tactics that brought him unparalleled success over the years.
This style has moved from the business sphere to the political one. Prior to the visit in North Korea, Trump spent months engaging in inflammatory, aggressive jousting with North Korean leader, Kim Jong-un, in an attempt to intimidate and pressure the North Koreans into concessions. His fiery style has been seen across the political spectrum, and both friends and foe alike have felt the sting of his twitter account. One cannot help but contrast Donald Trump’s behavior to that of his predecessor, Barak Obama, and his administration’s genial relationships internationally. One also cannot help but wonder as to the potential difference in impact due to their different styles and ideology.
The contrast to the Obama administration serves also as a good understanding of the political mandate that was thrust upon President Trump. The success of Donald Trump’s presidential campaign was in most part due to his anti-establishment posture, or more particularly his lack of involvement in the “Boys Club” of US politics. The voting public had grown tiresome with the status-quo and wanted a shakeup that only an outsider could provide.
Trump entered the political arena with no diplomatic experience, and a reputation for brilliant deal making. The country voted for him for what he could provide – an aggressive, take-no-prisoners attitude. A chance to ruffle a few feathers, whether it be congress or the rest of the world. Ever the pragmatist, Trump understood that his interests would not benefit from taking on congress, but saw fertile ground for improvement in the international trade arena. In his views, the existing US trade deals were harmful, serving political interests and cronyism rather than the US public. Making the case against weak foreign policy having a negative impact on the US is an easy sell, whether it’s true or false. And Trump, with the full weight of the US treasury behind him, has the biggest stick in history with which to drive America’s peers into better deals.
So what does Trump think of other economies? He probably views them first and foremost as business competitors. In this narrative, the traditional categories of ‘friend vs. foe’ diminish, and other than basic business etiquette, the only rule that applies above all is ‘maximize profits’.
About the Author:
AmramMargalit is a professional writer who has worked in a wide range of settings, including technology companies, nonprofits, and the entertainment industry. Within these positions, Amram has provided quality content and advertising services and is currently the Content Manager at Leverate.
EURUSD has almost reached the short-term downside target. Possibly, today the pair may be corrected towards 1.1624 and then fall to reach 1.1510. After that, the instrument may start another correction with the target at 1.1624.
GBPUSD, “Great Britain Pound vs US Dollar”
GBPUSD has almost completed the correction. Today, the price may grow towards 1.2919 and then start another decline with the target at 1.2791.
USDCHF, “US Dollar vs Swiss Franc”
USDCHF has reached the short-term upside target. Right now, it is being corrected towards 0.9724 or even 0.9700. After that, the instrument may continue trading upwards with the target at 0.9797.
USDJPY, “US Dollar vs Japanese Yen”
USDJPY is still being corrected upwards; it has finished the third structure. Possibly, today the pair may form the fourth one to reach 111.20. Later, the market may resume growing with the target at 111.73.
AUDUSD, “Australian Dollar vs US Dollar”
AUDUSD has reached the short-term downside target. Today, the price may form a new ascending structure towards 0.7266 and then resume falling to reach 0.7133.
USDRUB, “US Dollar vs Russian Ruble”
USDRUB is trading to rebound from 68.37 downwards. Possibly, the pair may reach 67.37, break it, and then continue falling inside the downtrend with the target at 66.36.
XAUUSD, “Gold vs US Dollar”
Gold has reached the predicted downside target. Possibly, today the pair may form a new ascending structure towards 1200.10. Later, the market may resume trading to the downside to reach 1186.22.
BRENT
Brent has finished another ascending structure; right now, it is moving downwards with the target at 77.45. Later, the market may grow to reach 78.59, thus forming another consolidation range. If later the instrument breaks this range to the upside, the price may resume growing towards 80.50; if to the downside – continue the correction with the target at 76.20.
Attention! Forecasts presented in this section only reflect the author’s private opinion and should not be considered as guidance for trading. RoboForex LP bears no responsibility for trading results based on trading recommendations described in these analytical reviews.
In the middle of the week, AUDUSD stopped falling, but “bulls” remain cautious and are in no rush to become more active.
The Australian Dollar stopped its decline against the USD on Wednesday. The current quote for the instrument is 0.7173.
Basically, the Aussie really have reasons to move. In the morning, the country reported on the GDP in the second quarter 2018 and it turned out to be quite good. The indicator added 0.9% q/q after expanding by 1.1% q/q the quarter before. However, the expected reading was only 0.7% q/q, that’s why the actual one is not so bad at all. On YoY, the country’s economy increased by 3.4%, which is better than earlier this year.
On one hand, the fact that the reading was better than expected is a good thing. On the other hand, the GDP lost its momentum by the end of the second quarter, thus making further forecasts even more subtle. The components of the report show that one of the largest contribution to the GDP growth came from the household consumption, which is a troublesome area in the Australian economy. On the contrary, trade conditions got worse.
Among positive things, one should pay attention to improvements in the net exports and wages. In addition to that, investments in new homes also look good () (+3.6%).
Still, the Aussie is still being pressured by the American currency. The US Congress is back to working after vacations today and investors are afraid that lawmakers may start this political year with some tough sells.
Attention! Forecasts presented in this section only reflect the author’s private opinion and should not be considered as guidance for trading. RoboForex LP bears no responsibility for trading results based on trading recommendations described in these analytical reviews.
The bearish sentiment continues to prevail on the EUR/USD currency pair. Demand for the American currency is still high. Investors expect a report on the labor market in the US, which will be published on September 7. At the moment, the key support and resistance levels are 1.15350 and 1.15700, respectively. The trading instrument has the potential for further reduce.
The news feed on 2018.09.05:
– A number of indices of economic activity in the Eurozone at 11:00 (GMT+3:00);
– The US trade balance at 15:30 (GMT+3:00).
We also recommend paying attention to the speeches by the FOMC representatives.
Indicators point to the power of sellers: the price has fixed below 50 MA and 200 MA.
The MACD histogram has moved to the negative zone, which indicates the bearish sentiment.
Stochastic Oscillator is in the neutral zone, the %K line is below the %D line, which also gives a signal to sell EUR/USD.
Trading recommendations
Support levels: 1.15350, 1.15000
Resistance levels: 1.15700, 1.15900, 1.16100
If the price fixes below the support level of 1.15350, the EUR/USD quotes are expected to fall. The movement is tending to 1.15000-1.14800.
Alternative option. If the price fixes above 1.15700, we recommend considering purchases of EUR/USD. The movement is tending to 1.16000-1.16200.
The GBP/USD currency pair
Technical indicators of the currency pair:
Prev Open: 1.28639
Open: 1.28549
% chg. over the last day: -0.11
Day’s range: 1.28192 – 1.28695
52 wk range: 1.2361 – 1.4345
Since the beginning of the current week, the bearish sentiment has been prevailing on the GBP/USD currency pair. At the moment, the GBP/USD quotes are consolidating. The key range is 1.28150-1.28500. The trading instrument has the potential for further reduce. Financial market participants expect new information regarding Brexit. Positions should be opened from the key levels.
At 11:30 (GMT+3:00), the index of economic activity in the UK services sector will be published.
The price has fixed below 50 MA and 200 MA, which signals the power of sellers.
The MACD histogram has started declining, which gives a signal to sell GBP/USD.
Stochastic Oscillator is located in the neutral zone, the %K line is below the %D line, which also indicates a fall in the GBP/USD quotes.
Trading recommendations
Support levels: 1.28150, 1.28000, 1.27600
Resistance levels: 1.28500, 1.28700, 1.29000
If the price fixes below 1.28150, the GBP/USD quotes are expected to fall. The movement is tending to 1.27750-1.27500.
Alternative option. If the price fixes above 1.28500, we recommend considering purchases of GBP/USD. The movement is tending to the round level of 1.29000.
The USD/CAD currency pair
Technical indicators of the currency pair:
Prev Open: 1.30915
Open: 1.31762
% chg. over the last day: +0.63
Day’s range: 1.31637 – 1.32052
52 wk range: 1.2059 – 1.3795
The USD/CAD currency pair continues to show positive dynamics. Since the beginning of this week, the growth of quotes has exceeded 150 points. At the moment, the USD/CAD currency pair is consolidating in the range of 1.31650-1.32000. Investors took a wait-and-see position before the Bank of Canada decision. It is expected that the regulator will keep the key interest rate at the previous level of 1.50%. We recommend paying attention to the comments by representatives of the Central Bank. Positions should be opened from the key levels.
At 17:00 (GMT+3:00), the Bank of Canada will announce its decision on the key interest rate.
The price has fixed above 50 MA and 200 MA, which signals the power of buyers.
The MACD histogram is in the positive zone and continues to rise, which signals to buy USD/CAD.
Stochastic Oscillator reached the overbought zone, the %K line is above the %D line, which gives a weak signal to buy USD/CAD.
Trading recommendations
Support levels: 1.31650, 1.31000, 1.30500
Resistance levels: 1.32000, 1.32500
If the price fixes above the round level of 1.32000, further growth of the USD/CAD quotes is expected. The movement is tending to 1.32500-1.32750.
Alternative option. If the price fixes below the local support of 1.31650, correction movement is expected. The target level for profit-taking is 1.31300-1.31000.
The USD/JPY currency pair
Technical indicators of the currency pair:
Prev Open: 110.986
Open: 111.313
% chg. over the last day: +0.35
Day’s range: 111.308 – 111.714
52 wk range: 104.56 – 114.74
Yesterday, the bullish sentiment prevailed on the USD/JPY currency pair. At the moment, quotes are consolidating. The technical pattern is ambiguous. Investors expect additional drivers. Local support and resistance levels are 111.300 and 111.500, respectively. We recommend opening positions from these marks.
Today, the news feed on the economy of Japan is calm.
The price has fixed above 50 MA and 200 MA, which indicates the power of buyers.
The MACD histogram is in the positive zone, but below the signal line, which gives a weak signal to buy USD/JPY.
Stochastic Oscillator is located in the neutral zone, the %K line is crossing the %D line. There are no signals at the moment.
Trading recommendations
Support levels: 111.300, 111.000, 110.750
Resistance levels: 111.500, 111.800, 112.000
If the price fixes above the resistance level of 111.500, the USD/JPY currency pair is expected to grow. The movement is tending to 111.700-112.000.
Alternative option. If the price fixes below the level of 111.300, it is necessary to consider sales of USD/JPY. The movement is tending to 111.000-110.800.
Yesterday, the US dollar strengthened against currency majors. Demand for the American currency is still high due to concerns about international trade and instability in the markets of developing countries. The dollar index (#DX) closed the trading session in the positive zone (+0.31%). Additional support was provided by positive statistics. In August, the index of economic activity in the US manufacturing sector counted to 61.3, which was higher than market expectations of 57.6.
Today, Bank of Canada interest rate decision will be the key event. Experts forecast that the regulator will keep the interest rate at the previous level of 1.50%. It should be noted that more than 75% of financial market participants expect that the Central Bank will tighten monetary policy in October. We recommend paying attention to the comments by the Bank of Canada representatives.
Oil quotes are declining. At the moment, futures for the WTI crude oil are testing a mark of $69.15 per barrel.
Market Indicators
Yesterday, the major US stock indices closed in the negative zone: #SPY (-0.17%), #DIA (-0.05%), #QQQ (-0.43%).
The 10-year US government bonds yield shows positive dynamics. At the moment, the indicator is at the level of 2.89-2.90%.
The news feed on 05.09.2018:
– A number of indices of economic activity in the Eurozone at 11:00 (GMT+3:00); – The index of economic activity in the UK services sector at 11:30 (GMT+3:00); – Bank of Canada interest rate decision at 17:00 (GMT+3:00).