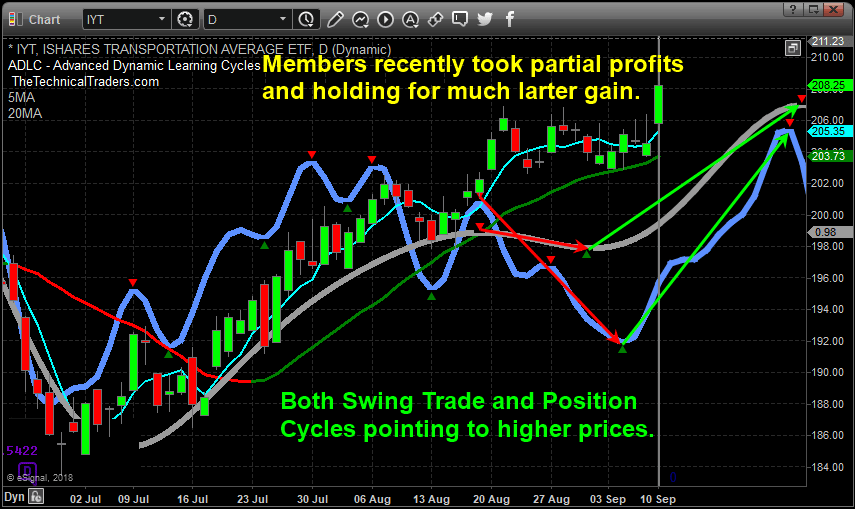
The recent upside breakout seen in the US Transportation Index is a very important signal for traders. Our research team has been following these moves for many months and we believe the recent upside breakout in the $TRAN is a strong sign of future US Equities price moves and all traders should be paying very close attention.
The Transportation Index typically leads the US Equities markets by about 3 to 6 months. Transportation is one of the core elements of economic activity. Items entering the US or distributed throughout the US must rely on transportation to ship/deliver these goods to resellers, wholesalers, and ports. When the Transportation Index rises, one should expect the economic activity to continue to increase.
Given that we are only three months from the Christmas holiday season and understanding that retailers, wholesalers, and warehouses have likely already been stocking up on the holiday items, it makes sense that the Transportation Index would have been climbing over the past few months. Remember, the Transportation Index leads equities by about 3 to 6 months. So, we would have expected the Transportation Index to rally about 6 months before December if the economy was strengthening.
The breakout rally currently exhibited in the Transportation Index paints a picture that many may not be aware of for early 2019. Should the Transportation Index rally continue into October or November, or possibly longer, this would indicate that the US Equities market could continue to rally well into March or April of 2019 – possibly much longer. This means traders looking for a massive top any time soon, or big short sellers could have some big soling positions as this rally continues for the next 6+ months. While many are bearish on stocks and short the market, we remain long IYT with our position with members.
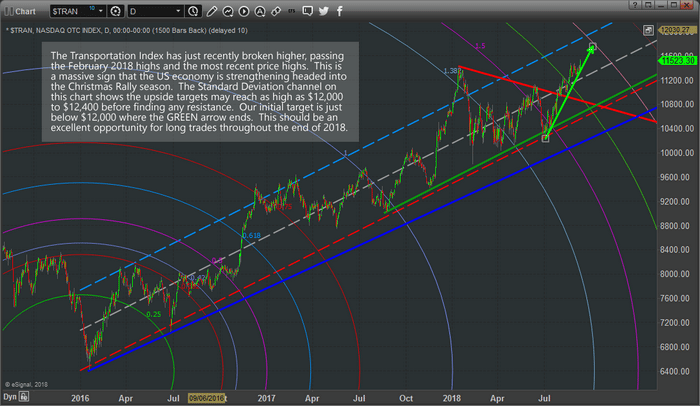
Let’s take a look at another chart. This Daily Transportation Index chart is very long term as we wanted to clearly illustrate the Standard Deviation channel that is in place going all the way back to 2016. The DASHED lines on the chart represent the Standard Deviation channel range that is likely to continue to operate as a price boundary going forward. The ARCs that appear on the chart are a unique tool we use to measure Fibonacci price acceleration and ranges. The upside price breakout points to an upside target of near $11,800 to $12,00 very quickly. From this level, we expect a bit of price rotation before another upside leg begins.
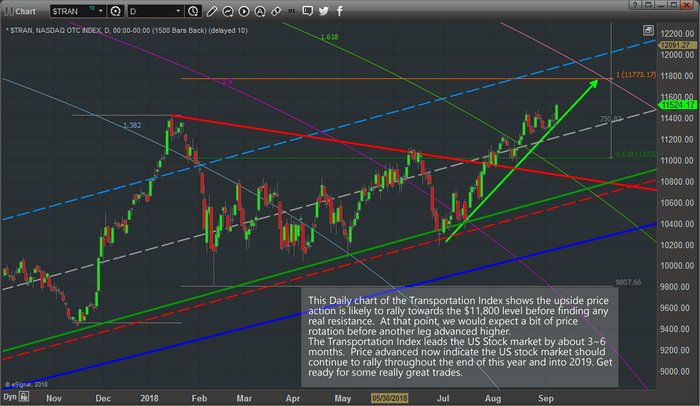
This next chart is the same Daily Transportation Index chart, just a closer view of the most recent 10+ months of price data. We can still see the Standard Deviation channel ranges and the upside breakout highlighted by our GREEN arrow. We’ve also added a Fibonacci price extension tool based on recent price rotation that points to an $11,773 upside target. We see confluence in multiple analysis techniques when multiple studies point to the same outcome. In this case, the Fibonacci Arcs, Fibonacci extensions and Standard Deviation channel all support the continued rally to near $11,800 for the Transportation Index.
As traders, this should be a very interesting and rewarding “look into the future” for many of you. These charts are suggesting the US Equities markets may continue to push much higher well into early 2019. As long as this upside trend in the Transportation Index continues, we should continue to expect a strengthening US economy, stronger economic and GDP levels and stronger consumer activities. In other words, get ready for some great long trades over the next few months and get ready to pick apart these opportunities as they play out.
Our team or researchers and professionals have been long the Transportation index for many weeks now. We identified this move months ago and alerted our followers to get into this trade early. If you want to know what our team of professional traders are telling our members now and how to find great opportunities throughout this move, visit www.TheTechnicalTraders.com to learn more.
Admiral Markets has accounced further expansion of the range of accessible markets on its flagship Admiral.MT5 account. From September 10, Professional clients may enjoy priority access to live trading in our CFD on copper as well as in seven agricultural commodity CFDs: cocoa, coffee arabica, coffee robusta, cotton, orange juice, raw sugar, and white sugar.
Retail clients will gain access to these new instruments in the coming weeks. In the meantime, all new instruments are available to all our clients for testing and researching on Admiral.MT5 demo accounts.
Clients can enjoy the following benefits when trading the new instruments:
– Expiration: Never. Clients may engage in long-term strategies and hold open positions for as long as they need. – Commission: Zero. Clients can enjoy lower costs of trading with only the spreads and daily financing costs to pay. – Leverage: Moderate. Professional clients may leverage up to 1:50 on agricultural commodity CFDs and up to 1:100 on the Copper CFD, while Retail clients will be able to leverage a fixed ratio of 1:10. – Minimum contract size: Mini. Clients can trade fractions of a standard contract to enable maximum precision of your risk management strategies. – Volatility: Extreme. As these instruments can be volatile, Admiral Markets recommends clietns consider their Volatility Protection service when trading them.
Review other essential trading terms related to new instruments in the Commodities section of the Contract Specifications on the Admiral Markets website.
About Admiral Markets
Admiral Markets is a leading online Forex and CFD trading provider. In addition to a wide range of financial instruments, Admiral Markets offers free educational materials, including analytics, webinars and seminars.
***
Risk disclosure: Trading in financial markets on margin carries a high level of risk and losses may exceed your initial deposit. Admiral Markets UK Ltd. recommends you seek advice from an independent financial advisor to ensure that you understand the risks involved with Forex, CFDs and margin trading (https://admiralmarkets.com/risk-disclosure).
A decade ago, globalization peaked. Today, it remains in the doldrums. Consequently, the Trump trade wars take place at a historical moment, when globalization may further stagnate or even fall apart.
On Friday September 7, President Donald Trump threatened to impose tariffs on $267 billion in Chinese goods, on top of the additional $200 billion that he said will likely be hit with import taxes in a matter of days.
If the tariff stakes would increase close to $500 billion, it could penalize Chinese GDP by 1.0%, but the US GDP, which is relatively more vulnerable, would suffer a net impact of 2.0% of GDP.
Worse, a full trade war would penalize global confidence, which could unsettle key stock indexes. The consequent uncertainty would lead to further downgrades of countries’ economic outlook. Global growth would suffer collateral damage. And as credit would take a hit, financial conditions in the West could deteriorate, and so would trade in the East.
If Trump remains loyal to his trade pledges, following China he would target other major economies that have a significant trade surplus with the U.S., including Germany, Italy and the EU, Japan and South Korea, Mexico and Canada and, over time, Vietnam and India.
If the Trump administration would expand its trade war as it has promised, it would achieve a perfect reversal of decades of postwar globalization in just months – and it would pave way to a perfect storm in the global economy.
Globalization at crossroads
At the peak of globalization, the Baltic Dry Index (BDI) was often used as a barometer for international commodity trade. The index soared to a record high in May 2008 reaching 11,793 points. But as the financial crisis spread in the advanced West, the BDI plunged by 94% to 663 points.
Even today, the BDI remains only around 1,500, some 90% below its peak, despite soaring financial markets (Figure).
Figure The Baltic Dry Index, 1986-2018
While the BDI can serve as a short hand for international trade, broader measures of global economic engagement offer equally dire visions.
Global economic integration is usually measured by world trade, investment, and migration. By the 1870s, capital and trade flows rapidly increased, driven by falling transport costs. But the first wave of globalization in the modern era was reversed by the retreat of the U.S. and Europe into protectionism between 1914 and 1945.
After World War II, trade barriers came down, and transport costs continued to fall. As foreign direct investment (FDI) and international trade returned to the pre-1914 levels, globalization was fueled by Western Europe and the rise of Japan. This second wave of globalization benefited mainly the advanced economies.
Following 1980 many developing countries broke into world markets for manufactured goods and services, while they were also able to attract foreign capital, thanks to offshoring in the West. This era of globalization peaked between China’s accession to the World Trade Organization (WTO) in 2001 and the global financial crisis in 2008.
After the global crisis, China and large emerging economies fueled the international economy, which was thus spared from a global depression. But as G20 cooperation has dimmed, so have global growth prospects.
Falling world investment
Before the global crisis, world investment soared to almost $2 trillion. A year or two ago, the UN predicted that global FDI flows were projected to resume growth in 2017 and to surpass $1.8 trillion in 2018. In contrast, I predicted that the improvement was unlikely and that world investment would either continue to stagnate or worse.
So what actually happened? Well, according to the most recent UN data, global flows of foreign direct investment fell by a whopping 23% in 2017. Cross-border investment in developed and transition economies dropped sharply, while growth was near zero in developing economies.
In effect, global FDI flows fell to $1.43 trillion – that is almost 20% below the pre-crisis peak around 2007-8. In turn, FDI flows to developing economies remained stable at $671 billion, seeing no recovery following the 10% drop in 2016.
This negative trend is not just a long-term concern for policymakers worldwide; it should be an alarm bell, especially as US rate hikes are likely to dampen the projections of many emerging economies and the collateral damage associated with US trade wars is likely to spread in global economy.
Undermined world trade recovery
In 2017, world merchandise trade recorded its strongest growth in six years. According to the World Trade Organization (WTO), the ratio of trade growth to GDP growth returned to its historic average of 1.5, far above the 1.0 ratio recorded in the years following the 2008 financial crisis.
“Trade growth in 2017 was the strongest since 2011,” said WTO Director-General Roberto Azevêdo in his opening message. “If we are to avoid this strong performance being compromised by a further escalation in tensions, we must seek to further enhance global cooperation.”
Yet, that is precisely what is unlikely to happen in 2018. Azevêdo wrote his message before Trump’s tariff warnings took effect.
Historically, it may be useful to recall that, about a decade ago in July 2008 WTO then-Director-General Pascal Lamy declared that there was “unqualified public support for globalization.” Yet by that fall, trade depression halted most containers worldwide.
It does not follow that history will repeat itself, but it does rhyme. Trump’s tariff wars are penalizing a trade recovery that took a decade to materialize.
The slump of global finance
The soaring stock equity markets in the United States reflect less the strong fundamentals of the U.S. economy (America’s sovereign debt exceeds 106% of its GDP) than wishful thinking about U.S. leadership in the 21st century. Following the global financial crisis, there has been a dramatic fall in global finance as well.
Global debt has continued to swell since the crisis but has remained stable relative to world GDP since 2014; that is, at 169% of global GDP.
Indeed, gross cross-border capital flows-annual flows of FDI, purchases of bonds and equities, lending and other investment-have shrunk by -53% in absolute terms, returning to the level of global flows as a share of GDP last seen in the early 2000s.
The sharp contraction in gross cross-border lending and other investment flows explain half of the decline, and Eurozone banks are leading the retreat.
From geopolitical friction to migration crises
Since the advanced West subjected migration to greater control in the early 20th century, global migration—the third leg of globalization—has shrunk dramatically. Yet, the number of globally displaced people has surged.
Wars, other violence and persecution drove worldwide forced displacement to a new high in 2017 for the fifth year in a row. Overwhelmingly it is developing countries that are most affected. According to the UNHCR, the UN Refugee Agency, 69 million people were displaced as of the end of 2017. Among them were 16.2 million people who became displaced during 2017. In other words, about 45,000 people are being displaced each day.
This represents the greatest global forced displacement since 1945.
As evidenced by recent migrant crises in Western Europe and Trump’s intent to build a wall against Mexico, sentiments against migration are hardening – precisely at the time when skill-based immigration would be vital to the future of advanced economies, which are rapidly aging and stagnating.
Beware of rising risks
So these are the prospects of globalization today. International commodity trade is now where it first was in the early 1990s, according to the Baltic Dry Index. Global investment is plunging. Trump’s tariff wars have potential to undermine a global trade recovery. Global financial flows are now where they first were 10-15 years ago.
The only highs in recent globalization stem from the surge of the number of globally displaced people.
As the IMF has warned, the ongoing cyclical recovery in global growth prospects is likely to wind down in a year or two. Thanks to the Trump administration’s tariff wars, the day of reckoning may take place much sooner.
Of course, globalization is no panacea. It has always been accompanied with winners and losers.
Yet, in the current status quo, when the growth drivers in major advanced economies are amid secular stagnation and consequently growth prospects are decelerating in emerging economies, external growth drivers are desperately needed.
Nevertheless – so it seems now – it is precisely those forces of world investment, trade, finance, and migration that are currently being undermined.
About the Author:
Dr. Dan Steinbock is an internationally recognized strategist of the multipolar worldand the founder of Difference Group. He has served at the India, China and America Institute (US), the Shanghai Institutes for International Studies (China) and the EU Center (Singapore). For more, see https://www.differencegroup.net/
This commentary is based on Dr Steinbock’s recent global economic briefing on “Globalization a Decade after the Global Financial Crisis.”
Let’s start Monday with a quick look at the cryptocurrency market, with bitcoin serving as the most popular representative. We can see that BTC is smoothly falling down, almost like a leaf in autumn. Is there any hope that crypto traders will be popping champagne bottles again anytime soon?
No, not really. Since the end of July, the price has bounced from the long-term downwards trend line (blue), and then tested the ultra important horizontal support around 5,800 USD (yellow). After this, we got a very technical correction shaped like a flag (red lines). With this flag, we tested the trend line again, and again we ended up with a drop. The lower line of the flag was broken and the price aimed at the yellow area for the 7th time this year. Buyers probably think that it is a great opportunity, but if we check the big picture here, we are in a large descending triangle pattern (upper blue, lower yellow).
In theory, that should result in a massive bearish breakout, and as they often say in the crypto community: “Silence of the Lambos” [Silence of those who bought Lamborghinis, when the price was high]. Do not take that for granted though. A proper sell signal will be triggered when we close the day below the yellow area. As long as we hold (or hodl?) above this level, there is still hope for crypto-maniacs!
On Monday, USDJPY is moving downwards in response to the Japanese GDP numbers.
The Japanese Yen is growing against the USD at the beginning of another September week. The current quote for the instrument is 111.00.
In the morning, Japan reported on final numbers of the country’s GDP in the second quarter. The indicator added 0.7% q/q, which is the same as expected. The previous estimation was 0.5% q/q. On YoY, the GDP added 3.0%. In the first quarter, the indicator lost 0.2% q/q (-0.9% y/y).
This is a great result for the economy, which continues fighting the deflation and driving the consumption among the country’s population. The components of the report show that the GDP Private Consumption added 0.7% q/q in the second quarter, thus continuing the momentum started earlier this year. However, at the same time, the GDP Capital Expenditure also increase (+3.1% q/q after 1.3% q/q before).
This week, Japan is scheduled to publish several interesting reports, such as the Preliminary Machine Tool Orders (August) on Tuesday, the PPI (August) on Thursday, and the Revised Industrial Production (July) on Friday.
Another factor that may influence the Yen in the next several days is the continuation of “trade wars” between the USA and China. Last Friday, the US President Donald Trump said that the White House was ready to double the import duties volume for Chinese goods, which meant that almost all goods from this country might find themselves under “sanctions”. In this case, investors might need “safe haven” assets, thus making the Yen getting stronger slowly.
Attention! Forecasts presented in this section only reflect the author’s private opinion and should not be considered as guidance for trading. RoboForex LP bears no responsibility for trading results based on trading recommendations described in these analytical reviews.
EURUSD has finished another consolidation range inside the descending wave and broken its downside border. Possibly, today the pair may fall to reach 1.1520 and then form a new ascending structure towards 1.1555. After that, the instrument may resume falling with the target at 1.1515.
GBPUSD, “Great Britain Pound vs US Dollar”
GBPUSD is moving downwards. Today, the price may reach 1.2791 and then grow towards 1.296. Later, the market may resume falling inside the downtrend with the target at 1.2600.
USDCHF, “US Dollar vs Swiss Franc”
USDCHF is moving upwards. Possibly, today the pair may reach the short-term target at 0.9730 and then fall towards .09690. Later, the market may resume growing with the first target at 0.9740.
USDJPY, “US Dollar vs Japanese Yen”
USDJPY has formed another consolidation range around 110.80 and expanded it both upwards and downwards. According to the main scenario, the pair is expected to continue falling with the short-term target at 109.80. After that, the instrument may resume growing to return to 110.80 and then start a new decline to reach the target at 109.55.
AUDUSD, “Australian Dollar vs US Dollar”
AUDUSD has reached its downside target; it has completed another range and broken it downwards. Possibly, the pair may continue falling with the short-term target at 0.7030. Later, the market may grow towards 0.7130 and then start a new decline to reach 0.7000.
USDRUB, “US Dollar vs Russian Ruble”
USDRUB has completed the consolidation range above 68.78; it has expanded it upwards and finished the ascending wave. Today, the price may fall to return to 68.78. If later the instrument breaks this range to the downside, the price may be corrected with the target at 67.55.
XAUUSD, “Gold vs US Dollar”
Gold has formed the consolidation range around 1195.15. If later the instrument breaks this range to the downside, the price may resume falling towards 1190.00 and then form a new ascending structure to return to 1191.15. Later, the market may resume falling inside the downtrend with the target at 1186.20.
BRENT
Brent is trading to rebound from 75.55 upwards. Possibly, the pair may reach the first target at 77.97 and then fall towards 76.80. After that, the instrument may resume trading inside the uptrend with the short-term target at 80.50.
Attention! Forecasts presented in this section only reflect the author’s private opinion and should not be considered as guidance for trading. RoboForex LP bears no responsibility for trading results based on trading recommendations described in these analytical reviews.
On Friday, the US dollar strengthened against currency majors. A positive report on the US labor market for August supported the US currency. The EUR/USD currency pair decreased by more than 70 points. At the moment, the quotes are consolidating in the range of 1.15300-1.15650. We recommend opening positions from these marks. The trading instrument has the potential for further reduce.
Today, the publication of important economic reports from the US and the Eurozone is not planned. We recommend monitoring current information regarding the trade conflict between the US and China.
The price has fixed below 50 MA and 200 MA, which indicates the power of sellers.
The MACD histogram is in the negative zone, but above the signal line, which gives a weak signal to sell EUR/USD.
Stochastic Oscillator is located in the neutral zone,the %K is above the %D line, which indicates the bullish sentiment.
Trading recommendations
Support levels: 1.15300, 1.15000
Resistance levels: 1.15650, 1.16000, 1.16500
If the price fixes below the local support of 1.15300, the EUR/USD quotes are expected to fall further. The movement is tending to 1.15000-1.14750.
Alternative option. If the price fixes above 1.15650, it is necessary to consider purchases of EUR/USD. The movement is tending to 1.16000-1.16250.
The GBP/USD currency pair
Technical indicators of the currency pair:
Prev Open: 1.29254
Open: 1.29205
% chg. over the last day: -0.06
Day’s range: 1.28968 – 1.29317
52 wk range: 1.2361 – 1.4345
On Friday, trading on the GBP/USD currency pair was very active. At the same time, a unidirectional trend was not observed. At the moment, GBP/USD quotes are consolidating. The technical pattern is ambiguous. Local support and resistance levels are 1.29000 and 1.29350, respectively. Investors expect important economic reports from the UK. We recommend opening positions from the key levels.
The news feed on the UK economy on 2018.09.10:
– GDP data at 11:30 (GMT+3:00);
– Manufacturing production at 11:30 (GMT+3:00).
Indicators do not send accurate signals: 50 MA has crossed 200 MA.
The MACD histogram has moved into the negative zone, which signals the power of sellers.
Stochastic Oscillator is located in the neutral zone, the %K line is above the %D line, which indicates the bullish sentiment.
Trading recommendations
Support levels: 1.29000, 1.28700, 1.28250
Resistance levels: 1.29350, 1.29700, 1.30000
If the price fixes below the round level of 1.29000, it is necessary to consider sales of GBP/USD. The movement is tending to 1.28700-1.28400.
Alternative option. If the price fixes above the local resistance of 1.29350, we recommend considering purchases of GBP/USD. The movement is tending to 1.29700-1.30000.
The USD/CAD currency pair
Technical indicators of the currency pair:
Prev Open: 1.31369
Open: 1.31566
% chg. over the last day: +0.12
Day’s range: 1.31566 – 1.31978
52 wk range: 1.2059 – 1.3795
The technical pattern on the USD/CAD currency pair is ambiguous. The trading instrument is moving in flat. A unidirectional trend is not observed. On Friday, September 7, Canada published a weak labor statistics. At the moment, the key support and resistance levels are 1.31600 and 1.32000, respectively. We recommend opening positions from these marks.
Today, the news feed on the economy of Canada is calm.
The price has fixed above 50 MA and 200 MA, which signals the power of buyers.
The MACD histogram is in the positive zone and above the signal line, which indicates the bullish sentiment.
Stochastic Oscillator has started moving out the overbought zone, the %K line is below the %D line, which gives a signal to sell USD/CAD.
Trading recommendations
Support levels: 1.31600, 1.31150, 1.30700
Resistance levels: 1.32000, 1.32500
If the price fixes above the round level of 1.32000, further growth of the USD/CAD currency pair is expected. The movement is tending to 1.32250-1.32500.
Alternative option. If the price fixes below 1.31600, it is necessary to consider sales of USD/CAD. The target level for profit-taking is 1.31200-1.31000.
The USD/JPY currency pair
Technical indicators of the currency pair:
Prev Open: 110.740
Open: 111.042
% chg. over the last day: +0.30
Day’s range: 110.849 – 111.085
52 wk range: 104.56 – 114.74
The USD/JPY currency pair is consolidating. The technical pattern is ambiguous. The trading instrument is testing local support and resistance levels: 110.900 and 111.100, respectively. The positions should be opened from these marks. We recommend paying attention to the US government bonds yield.
Positive data on GDP of Japan have been published during the Asian trading session.
Indicators do not send accurate signals: the price has fixed between 50 MA and 200 MA.
The MACD histogram is near 0 mark.
Stochastic Oscillator is located in the neutral zone, the %K line has crossed the %D line. There are no signals at the moment.
Trading recommendations
Support levels: 110.900, 110.750, 110.500
Resistance levels: 111.100, 111.300, 111.500
If the price fixes below the support level of 110.900, the USD/JPY quotes are expected to fall. The movement is tending potential to 110.700-110.500.
Alternative option. If the price fixes above 111.100, it is necessary to consider purchases of USD/JPY. The movement is tending to 111.300-111.500.
On Friday, September 7, the US dollar strengthened against currency majors. The dollar index (#DX) closed the trading session in the positive zone (+0.36%). The US published a positive report on the labor market for August. In the nonfarm sector of the country, 201,000 of new jobs were created, which is higher than market expectations of 191,000. The growth in the average hourly earnings (m/m) counted to 0.4%. Experts forecasted the indicator at 0.3%. The unemployment rate remained at the same level of 3.9%. At the moment, more than 95% of financial market participants believe that the Fed will raise the range of the key interest rate to 2.00%-2.25% at the meeting on September 26.
During the Asian trading session, Japan has published optimistic GDP data. In the second quarter, the country’s economic growth counted to 3.0% (year on year), which is higher than market expectations of 2.6%. Investors expect important statistics from the UK. We recommend monitoring current information regarding the trade conflict between the US and China, as well as Brexit.
Oil quotes have started growing. At the moment, futures for the WTI crude oil are testing a mark of $68.25 per barrel.
Market Indicators
On Friday, the major US stock indices closed in the negative zone: #SPY (-0.19%), #DIA (-0.29%), #QQQ (-0.39%).
At the moment, the 10-year US government bonds yield is at the level of 2.93-2.94%.
The news feed on 10.09.2018:
– Statistics on the UK GDP at 11:30 (GMT+3:00); – Manufacturing production in the UK at 11:30 (GMT+3:00).
Over the course of last week, most of the majors lost ground against the US dollar. The Kiwi dollar dropped by 1.29%, the Aussie by 1.25%, the loonie by 0.95%, the euro by 0.42%, the pound by 0.29%, and the Swiss franc by 0.03%.
Fig 1. USD dynamics last week.
The single currency dropped on Friday following the release of US employment data. According to the latest report, annual wage growth in August was at its highest since 2009. The dollar surged on the back of expectations of another two interest rate hikes this year.
Day’s news (GMT+3):
11:30 UK: industrial production (Jul), manufacturing production (Jul), total trade balance (Jul), index of services (Jul).
15:00 US: FOMC member Bostic speech.
16:00 UK: NIESR GDP estimate (Aug).
Fig 2. EURUSD hourly chart.
Current situation:
My expectations for last week were proven correct for the most part. The pair dropped 90 degrees from 1.1650. Since the euro dropped after the payrolls report, for today I’m going to look at movement against Friday’s, meaning a recovery for the euro. I’ve made a new intraday prediction for the week. It’s based on hourly cycles and patterns. The next two days are shown on the chart.
The calendar is virtually empty. The centre of attention among traders today will be data from the UK. Keep an eye on the EURGBP cross. The balance line runs through 1.1607. Today, it’s acting as a resistance. By the time the US session opens it will be at 1.1595, which will bolster the 45th degree.
We will start this week with an analysis of EURUSD, which for the past few days, has not been able to really pick a direction. The pair has been changing sides frequently, moving back and forth from iH&S to H&S patterns (blue and orange rectangles). Let’s dig a bit deeper, shall we?
The pair had an awesome sell signal in the middle of August (in theory), but it got quickly denied with the use of the iH&S pattern. After this, it came back above the major S/R level (yellow, 1.153), which in theory was very positive. In theory again, because as we can see now, the pair is struggling to keep the high levels here. The new week is starting with the hammer candle on that yellow area. That will be an ultra important buy signal once this support is definitively defended. On the other hand, if the pair closes the day below 1.153, this will be a signal to go short.
In the midst of this Monday morning optimism, chances are likely that we will see a bounce. Buying on a support is one of the most important principles of technical analysis, so maybe more traders will join this movement pulling price vastly higher.