Since the beginning of this week, the main currency pairs have demonstrated a variety of trends. Yesterday, the dollar index (#DX) closed the trading session with a slight decrease (-0.06%). At the moment, financial market participants have taken a wait-and-see position before the meetings of the Bank of England and the ECB. We recommend monitoring current information regarding the trade conflict between the US and China, as well as negotiations on NAFTA and Brexit.
The Office for National Statistics published a rather optimistic report on the labor market. In August, the number of jobless claims counted to 8.7K. Market expectations were at the level of 10.0K. The unemployment rate remained unchanged at 4.0%. The growth of average wages, taking into account bonuses, accelerated from 2.4% to 2.6%. At the same time, the GBP/USD currency pair closed the trading session in the negative zone. Investors expect comments by the Bank of England representatives on further monetary policy. The meeting of the Central Bank will be held this Thursday, September 13.
The “black gold” prices have been growing. At the moment, futures for the WTI crude oil are testing a mark of $69.75 per barrel. We recommend paying attention to data on the US crude oil inventories at 17:30 (GMT+3:00).
Market Indicators
Yesterday, the major US stock indices closed in the positive zone: #SPY (+0.33%), #DIA (+0.42%), #QQQ (+0.77%).
The 10-year US government bonds yield shows positive dynamics. At the moment, the indicator is at the level of 2.97-2.98%.
On Tuesday the 11th of September, trading on the euro closed slightly up against the dollar. The pair initially rose to 1.1644 before dropping to 1.1565. As I see it, these fluctuations were more the result of technical factors than fundamentals. I reckon that market participants are looking to gain a foothold somewhere ahead of tomorrow’s ECB meeting.
Day’s news (GMT+3):
12:00 Eurozone: employment change (Q2), industrial production (Jul).
14:20 US: OPEC monthly report.
15:30 US: PPI (Aug).
17:30 US: EIA crude oil stocks change (7 Sep).
21:00 US: Fed’s Beige Book.
Fig 1. EURUSD hourly chart.
Current situation:
At the time of writing, the single currency is trading at 1.1584 against the greenback. The economic calendar is virtually empty today. As such, traders will continue to prepare for Mario Draghi’s press conference. A lot of people will want to get out of their positions ahead of his speech.
In today’s Asian session, the euro has lost a little bit of ground against the dollar. The AO indicator is in neutral territory, while the stochastic is in the buy zone. From a technical standpoint, the euro looks set to rise over the next 5 – 6 hours. As part of my weekly forecast, I expect to see the pair recover to around 1.1620 – 1.1650. I haven’t adjusted my forecast on the chart, but let’s wait and see how Thursday and Friday pan out.
The euro crosses provide a mixed picture. The euro is trading up on some of them, and down on others. Under these conditions, the euro could revisit the 67th degree at 1.1563.
The majors are all trading down against the US dollar, except for the yen, which is enjoying increased demand. I think this is a result of a reduced appetite for risk among market participants. This could be either down to expectations of further interest rate hikes in the US, or increased trade tensions between the US and China.
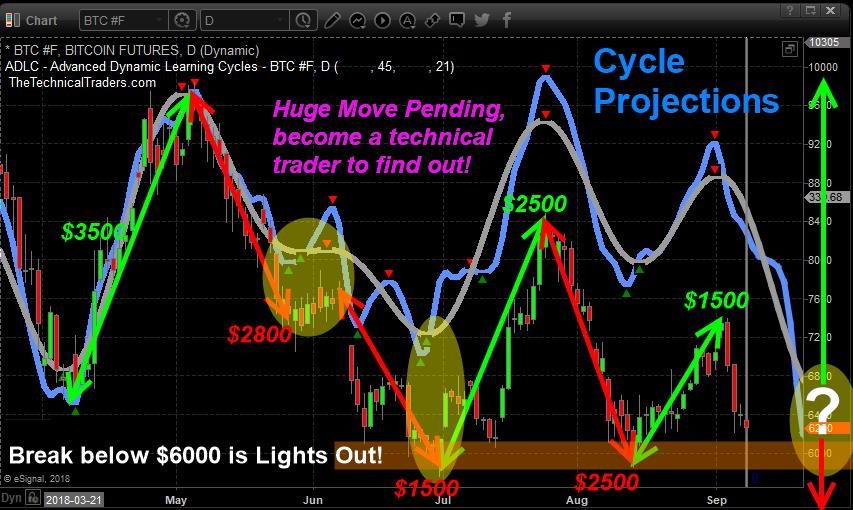
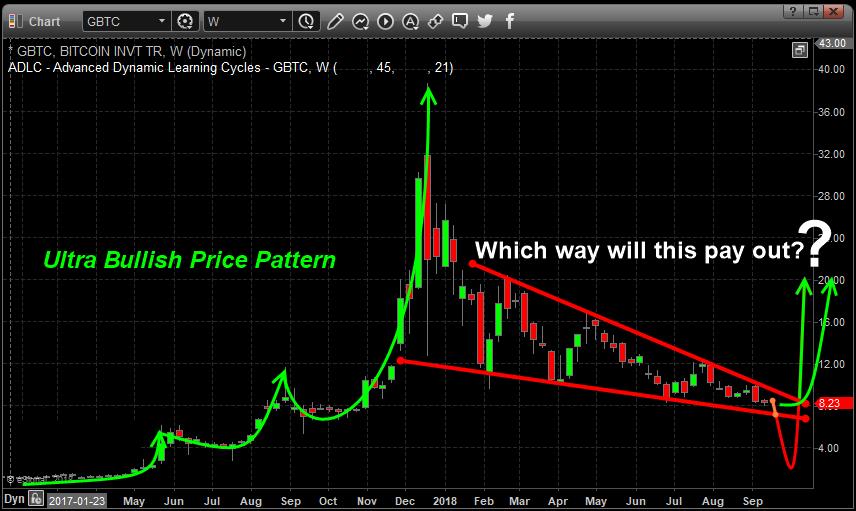
If you are a Bitcoin fan or looking for the next opportunity for a Bitcoin rally, you may not have long to wait before a price breakout takes place. Our research team, at www.TheTechnicalTraders.com, believes a price breakout may occur before the end of 2018 – the only question is will it be a breakout rally or a breakdown crash before the next mega rally?
Cryptos and, in particular, Bitcoin has increased in popularity and adoption over the past 24 months across the globe. Recently, Citigroup has announced new technology making Crypto transactions more secure and reducing the risk of such transactions. Additionally, Circle recently announced a US Dollar based Crypto-currency that is backed by Goldman-Sachs. News from Europe is that the EU has been urged to adopt common Crypto-Currency rules that will fuel more attention and enterprise on developing suitable Crypto solutions for the European markets.
All of this plays into our research that a breakout/breakdown is inevitable and it is just a matter of time before this coiling price consolidation “apexes” and expands.
This chart shows massive breakdown washout below $6000 taking it back to prices before crypto became popular in early 2017.
This next chart below shows our cycle analysis and how much bitcoin moved from our cycle bottoms to tops. We are now at NEARING a critical juncture of a $6000 breakdown which is clearly a support level, and a potential major cycle bottom or continuation down cycle. Huge money can be made from this extreme volatility that is about to unfold and savvy technical traders can see the profit potential unfolding.
We urge all traders to keep Cryptos in focus over the next few weeks and months. Our research team shares our proprietary analysis and research with our paid members regarding the Crypto-currency trends and trades.
If you want to learn what we believe will be the next big move in the Crypto markets, then visit www.TheTechnicalTraders.com to learn more. Our proprietary modeling systems are clearly showing us what we should expect over the next few weeks and months. As a member, you will have access to this research and benefit from our Daily Research Videos.
Author: Dmitriy Gurkovskiy, Chief Analyst at RoboForex
The British Pound feels confident against the USD this week and continues rising. One thing that supported the British currency was the Brexit news, which is very positive: the parties are finally moving in the right direction in discussing trade relations and conditions. The UK and the EU representatives are doing their best with a focus on results. Another thing is the British statistics, which are rather mixed indeed, but investors have a lot of numbers to choose from.
So, the European Chief Negotiator for the United Kingdom Exiting the European Union, Michel Barnier, left open a real possibility of reaching the agreement with the UK with the next 6-8 weeks. This period is the same mentioned by the British Prime Minister Theresa May earlier: she told the media that the Brexit talks might be successful as early as in October. British and European politicians couldn’t arrive at a consensus for a long time and put the negotiations on hold several times, because each party wanted to pursue its own goals. And now, when the time is running out, the talks are progressing quickly.
This is about the trade agreement effective for the transition period of the next 2 years. Uncertainty about this issue really made both European and British investors and businesses feel very nervous.
The numbers published earlier today showed that the British labor market is rather mixed. The Unemployment Rate in the country in July remained the same as before, at 4.0%, but the Claimant Count Change expanded by 8.7K, which is more than expected. The Average Earnings Index added 2.6% 3m/y, which is better than both previous and expected readings of 2.4% 3m/y.
The numbers are quite strange and unusual, for summertime at least. As a rule, in summer the tertiary industry requires a lot of seasonal employees, including on a part-time basis.
There are several things to pay attention to in the H4 chart of GBPUSD. The first one: after breaking the resistance lien of the previous downtrend, the pairs started a new rising correction, which has already reached the retracement of 23.6%. The next possible targets of this correction may be the retracements of 38.2% and 50.0% at 1.3315 and 1.3518 respectively. The second thing is analyzing the chart from the technical point of view. The current short-term uptrend is heading towards the resistance line of the main correctional channel at 1.3110. After breaking this level, the price may move towards the upside projected channel and its resistance level close to the retracement of 50.0% at 1.3518. One also shouldn’t exclude a possibility that the instrument may fall to reach the support line of the main channel. It may happen if the pair breaks the short-term support line at 1.2960.
Disclaimer
Any predictions contained herein are based on the authors’ particular opinion. This analysis shall not be treated as trading advice. RoboForex shall not be held liable for the results of the trades arising from relying upon trading recommendations and reviews contained herein.
As we can see in the H4 chart, EURUSD continues growing and forming Hammer, Harami, and Doji reversal patterns during slight pullbacks. At the moment, it may be assumed that these patterns indicate that the instrument completed another correction and may resume its rising tendency.
USDJPY, “US Dollar vs. Japanese Yen”
As we can see in the H4 chart, after rebounding from the resistance level once again, USDJPY has formed Hammer and Doji reversal patterns and returned to the level. Judging by the previous movements, at the moment it may be assumed that after completing the correction, the instrument may break the resistance level and continue its ascending tendency.
Attention! Forecasts presented in this section only reflect the author’s private opinion and should not be considered as guidance for trading. RoboForex LP bears no responsibility for trading results based on trading recommendations described in these analytical reviews.
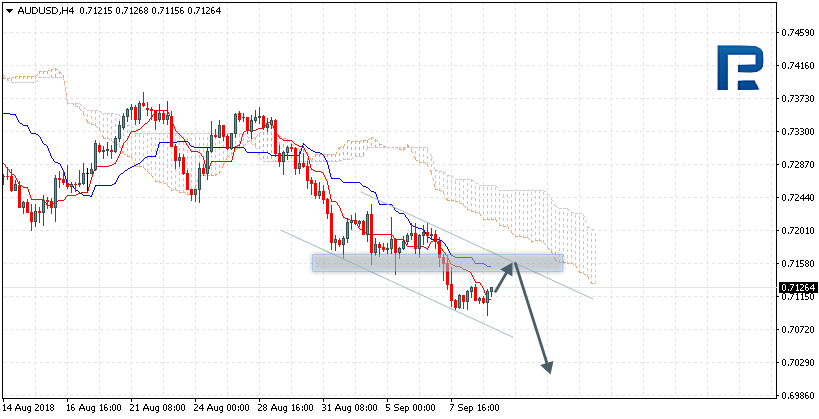
AUDUSD is trading at 0.7126; the instrument is moving below Ichimoku Cloud, thus indicating a descending tendency. The markets could indicate that the price may test Tenkan-Sen and Kijun-Sen at 0.7160 and then resume moving downwards to reach 0.7010. Another signal to confirm further descending movement is the price’s rebounding from the resistance level. However, the scenario that Implies further decline may be cancelled if the price breaks the upside border of the cloud and fixes above 0.7235. In this case, the pair may continue growing towards 0.7325.
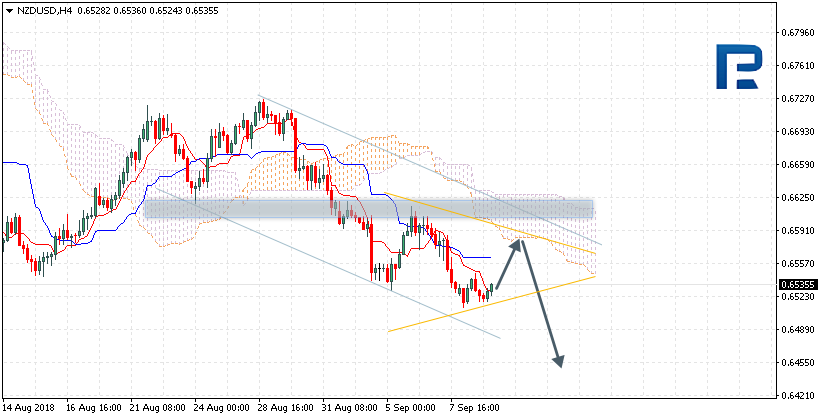
NZDUSD, “New Zealand Dollar vs US Dollar”
NZDUSD is trading at 0.6535; the instrument is moving below Ichimoku Cloud, which means that it may continue falling. The markets could indicate that the price may test the downside border of the cloud at 0.6565 and then continue moving downwards to reach 0.6455. Another signal to confirm further descending movement is the price’s rebounding from the channel’s upside border. However, the scenario that implies further decline may be cancelled if the price breaks the upside border of the cloud and fixes above 0.6630. In this case, the pair may continue growing towards 0.6710. After breaking the downside border of the Triangle pattern and fixing below 0.6510, the price may continue moving downwards.
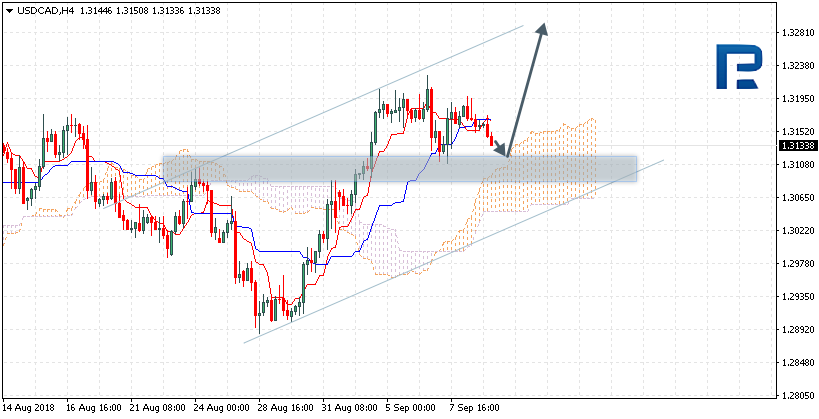
USDCAD, “US Dollar vs Canadian Dollar”
USDCAD is trading at 1.3133; the instrument is moving above Ichimoku Cloud, thus indicating an ascending tendency. The markets could indicate that the price may test the upside border of the cloud at 1.3120 and then resume moving upwards to reach 1.3285. Another signal to confirm further ascending movement is the price’s rebounding from the support level. However, the scenario that Implies further growth may be cancelled if the price breaks the downside border of the cloud and fixes below 1.3045. In this case, the pair may continue falling towards 1.2895.
Attention! Forecasts presented in this section only reflect the author’s private opinion and should not be considered as guidance for trading. RoboForex LP bears no responsibility for trading results based on trading recommendations described in these analytical reviews.
The EUR/USD currency pair has started growing. Yesterday, the growth of quotes exceeded 50 points. Today, the euro has continued to strengthen against the US dollar. At the moment, local support and resistance levels are 1.16050 and 1.16300, respectively. The potential for growth remains. We recommend opening positions from the key levels.
The news feed on 2018.09.11:
– ZEW economic sentiment index in Germany at 12:00 (GMT+3:00);
– JOLTS job openings at 17:00 (GMT+3:00).
Indicators point to the power of buyers: the price has fixed above 50 MA and 200 MA.
The MACD histogram is in the positive zone and continues to rise, which signals the bullish sentiment.
Stochastic Oscillator is located in the overbought zone, the %K line is above the %D line, which gives a weak signal to buy EUR/USD.
Trading recommendations
Support levels: 1.16050, 1.15800, 1.15650
Resistance levels: 1.16300, 1.16500, 1.16900
If the price fixes above 1.16300, further growth of the EUR/USD currency pair is expected. The movement is tending to 1.16500-1.16800.
Alternatively, the EUR/USD quotes may decline to the local demand zone of 1.15650-1.15800.
The GBP/USD currency pair
Technical indicators of the currency pair:
Prev Open: 1.29205
Open: 1.30236
% chg. over the last day: +0.77
Day’s range: 1.30222 – 1.30874
52 wk range: 1.2361 – 1.4345
Yesterday, aggressive purchases of GBP/USD were observed. Demand for the pound has significantly increased after the statements by the European Union’s chief Brexit negotiator. The official said that in the near future, the parties can reach a mutually beneficial agreement. At the moment, the GBP/USD currency pair is consolidating in the range of 1.30400-1.30850. The potential for growth remains. Positions should be opened from the key levels.
At 11:30 (GMT+3:00) investors will assess a report on the labor market in the UK.
Indicators point to the power of buyers: the price has fixed above 50 MA and 200 MA.
The MACD histogram is located in the positive zone and continues to rise, indicating the bullish sentiment.
Stochastic Oscillator is near the overbought zone, the %K line is crossing the %D line. There are no signals at the moment.
Trading recommendations
Support levels: 1.30400, 1.30000, 1.29700
Resistance levels: 1.30850, 1.31000
If the price fixes above the local resistance of 1.30850, further growth of the GBP/USD quotes is expected. The movement is tending to 1.31250-1.31500.
Alternative option. If the price fixes below 1.30400, we recommend looking for entry points to the market to open short positions. The movement is tending to the round level of 1.30000.
The USD/CAD currency pair
Technical indicators of the currency pair:
Prev Open: 1.31566
Open: 1.31555
% chg. over the last day: -0.07
Day’s range: 1.31312 – 1.31735
52 wk range: 1.2059 – 1.3795
The USD/CAD currency pair has started declining. At the moment, the key support and resistance levels are: 1.31200 and 1.31600, respectively. The USD/CAD quotes have the potential for further correction. Positions should be opened from the key levels. We recommend paying attention to the dynamics of oil quotes.
The news feed on the economy of Canada is quite calm. At 15:30 (GMT+3:00) data on housing starts will be published.
The price has fixed between 50 MA and 200 MA, which are strong dynamic support and resistance levels.
The MACD histogram is in the negative zone and below the signal line, which gives a strong signal to sell USD/CAD.
Stochastic Oscillator is located in the oversold zone, the %K line has crossed the %D line. There are no signals at the moment.
Trading recommendations
Support levels: 1.31200, 1.30700, 1.30250
Resistance levels: 1.31600, 1.32000, 1.32250
If the price fixes below the support level of 1.31200, the correction of the USD/CAD currency pair is expected. The movement is tending to 1.30800-1.30600.
Alternative option. If the price fixes above 1.31600, it is necessary to consider purchases of USD/CAD. The target level for profit-taking is 1.32000-1.32250.
The USD/JPY currency pair
Technical indicators of the currency pair:
Prev Open: 111.042
Open: 111.099
% chg. over the last day: +0.19
Day’s range: 111.059 – 111.544
52 wk range: 104.56 – 114.74
The USD/JPY quotes show positive dynamics. At the moment, the USD/JPY currency pair is testing the key resistance of 111.550. The mark of 111.350 is local support. The trading instrument has the potential for further growth. We recommend monitoring current information regarding the trade conflict between the US and China. Positions should be opened from the key levels.
Today, the news feed on the economy of Japan is calm.
The price has fixed above 50 MA and 200 MA, which indicates the power of buyers.
The MACD histogram is located in the positive zone and above the signal line, which gives a strong signal to buy USD/JPY.
Stochastic Oscillator is near the overbought zone, the %K line has crossed the %D line. There are no signals at the moment.
Trading recommendations
Support levels: 111.350, 111.200, 110.900
Resistance levels: 111.550, 111.750, 112.000
If the price fixes above the resistance level of 111.550, further growth of the USD/JPY quotes is expected. The movement is tending to 111.750-112.000.
An alternative may be the decrease of the USD/JPY currency pair to 111.200-111.000.
More than two weeks of nearly uninterrupted price gains for crude oil ended this week, with the rally running out of steam. The question is what happens next?
Oil prices posted steep losses just as the bulls were back on the march. WTI briefly topped $70 per barrel in recent days and Brent was flirting with $80. But the rally was kneecapped by a variety of factors, and it could be challenging to break above those key pricing thresholds in the near future.
“[A]lthough the timing of the price slide comes as a surprise – Brent dipped well below $76 for a time [on Thursday] – the slide itself does not, as expectations recently have doubtless been too optimistic,” Commerzbank wrote in a note. In fact, to some, the timing was not all that surprising – WTI faced technical resistance at around $70-$71, and having failed to break above that threshold, was forced back down.
But beyond the technical analysis, oil prices also face some questions on the fundamentals. The emerging market turmoil (some say crisis, or contagion) has not gone away. Currency problems continue to dog a long list of emerging market economies, pushing a few into, or to the brink of, recession.
In fact, the MSCI Emerging Market Index of equities officially fell into bear market territory on Thursday, and there is little sign of light at the end of the tunnel. “My fear of contagion is that right now the sentiment towards the whole emerging-market spectrum is very fragile,” Mario Castro, a Latin America currency strategist at Nomura, said in a Wall Street Journal interview.
Because much of global oil demand growth is concentrated in rapidly-developing economies, currency weakness could have an outsized impact on crude oil demand.
“The worries about demand and a possible spillover from emerging markets are weighing on prices,” Hans van Cleef, senior energy economist at ABN Amro Bank NV, told Bloomberg. “We have tested breaking higher, but that failed, so now we have a temporary setback. I still expect the market to turn higher at some point, probably driven by Iran.”
Meanwhile, the Trump administration is rumored to be on the verge of dramatically ramping up the trade war with China, potentially moving forward on some $200 billion in tariffs. That would surely spark a response from China, and the back-and-forth retaliatory trade attacks could sap global growth. Also, China, specifically, is a major consumer of oil and one of the largest sources of demand growth, so a slowdown there could also go a long way to undercutting oil demand forecasts.
Also, this past week, the EIA reported weekly data that showed an uptick in gasoline inventories, a bearish sign that signals both an end to summer driving season and possibly hints at a slowdown in demand more generally. It’s one data point, however, so it doesn’t indicate a solid trend.
In fact, even as the markets sold off crude oil on the news, fearing a deterioration in the fundamentals, the reaction may have been overblown. “Gasoline demand growth has not been impressive in 2018, but total US oil demand growth has been stronger,” Standard Chartered said in a note. “As for the rest of the weekly data, it was negative but also unremarkable for late August.”
The softness in recent days has taken the wind out of the sails of crude oil, but it does not mean we are on the verge of another downturn. “The news backdrop does not really point to any further price slide: according to the DOE, US crude oil stocks declined by a surprisingly sharp 4.3 million barrels to 401.5 million barrels last week – their lowest level since February 2015. Things also remain interesting with respect to the Iran sanctions – particularly as far as the situation in India is concerned,” Commerzbank said. “We assume that New Delhi will bow to the pressure from Washington – so the supply situation on the oil market will remain tight.”
With two months to go on Iran sanctions, exports are falling fast. U.S. crude inventories are at their lowest point in years, and Saudi Arabia is going to be forced to burn through much of its spare capacity. U.S. shale, while signs of a production slowdown have yet to really materialize in the production data from the EIA, is still running into a rough patch. Just a few days ago, the CEOs of Schlumberger and Halliburton warned that drilling activity the Permian is cooling, which could translate into slower growth.
All of that is to say that while oil prices fell back at the end of this past week, it does not mean that we are in for another slide.
Yesterday, trading on the main currency pairs was very active. The dollar index (#DX) closed trading session in the negative zone (-0.22%). The British pound showed the best results. The GBP/USD quotes growth exceeded 120 points. Michel Barnier, the European Union’s chief Brexit negotiator, said that in the near future, the parties can reach a mutually beneficial agreement. Investors continue to assess the risks of the trade conflict between the US and China.
Financial market participants expect the meeting of the Bank of England and the ECB. On Thursday, September 13, regulators will announce their decisions on the key interest rate. Today, investors’ attention will be focused on the ZEW economic sentiment index in Germany and a report on the UK labor market.
At the moment, oil quotes are consolidating after a sharp decline during yesterday’s trading. Futures for the WTI crude oil are testing a mark of $67.75 per barrel. At 23:30 (GMT+3:00) we expect statistics on the API weekly crude oil stock.
Market Indicators
Yesterday, the major US stock indices showed mixed results: #SPY (+0.17%), #DIA (-0.23%), #QQQ (+0.34%).
At the moment, the 10-year US government bonds yield is at the level of 2.94-2.95%.
The news feed on 11.09.2018:
– Statistics on the labor market in the UK at 11:30 (GMT+3:00); – ZEW economic sentiment index in Germany at 12:00 (GMT+3:00); – JOLTS job openings at 17:00 (GMT+3:00).
On Monday the 10th of September, trading on the euro closed up. The correction against Friday worked out. The price has recovered to 1.1616. It could go up higher, but was limited by a decrease in the exchange rate of the euro/pound cross pair.
The British pound received support against the major currencies on the news that the EU and UK have made progress in the Brexit negotiations. EU representative Michel Barnier said that within the next 6-8 weeks it is likely that they will prepare a trade agreement, which will take effect once the UK leaves the EU.
My expectations on Monday proved true. The price is sticking to the weekly forecast. As the Asian low was updated before the euro strengthened, today I wanted to make a separate scenario for growth to 1.1634. I left it as is. The economic calendar on Tuesday is scant, so we could end up in a narrow range today. The support is at 1.1562 (45th degree).

 This next chart below shows our cycle analysis and how much bitcoin moved from our cycle bottoms to tops. We are now at NEARING a critical juncture of a $6000 breakdown which is clearly a support level, and a potential major cycle bottom or continuation down cycle. Huge money can be made from this extreme volatility that is about to unfold and savvy technical traders can see the profit potential unfolding.