Author Archive for InvestMacro – Page 354

The Analytical Overview of the Main Currency Pairs on 2018.09.28

Analytics by JustForex

The EUR/USD currency pair

Technical indicators of the currency pair:
  • Prev Open: 1.17362
  • Open: 1.16402
  • % chg. over the last day: -0.89
  • Day’s range: 1.16231 – 1.16284
  • 52 wk range: 1.0571 – 1.2557

Aggressive sales are observed on the EUR/USD currency pair. Yesterday, the decline in quotes exceeded 150 points. The US currency is supported by an increase in the Fed interest rate, as well as data on the US GDP. At the moment, the key support and resistance levels are 1.16150 and 1.16500, respectively. We recommend opening positions from these marks. The EUR/USD currency pair has the potential for further decrease.

The news feed on 2018.09.28:
  • – German unemployment change at 10:55 (GMT+3:00);
  • – Consumer price index in the Eurozone at 12:00 (GMT+3:00);
EUR/USD

Indicators point to the power of sellers: the price has fixed below 50 MA and 200 MA.

The MACD histogram is in the negative zone, but above the signal line, which gives a weak signal to sell EUR/USD.

Stochastic Oscillator is located in the neutral zone, the %K line is below the %D line, which indicates the bearish sentiment.

Trading recommendations
  • Support levels: 1.16150, 1.15800
  • Resistance levels: 1.16500, 1.16850, 1.17200

If the price fixes below the support level of 1.16150, the EUR/USD quotes are expected to fall. The movement is tending to 1.15800-1.15500.

An alternative may be the growth of the EUR/USD currency pair to the level of 1.16750-1.17000.

The GBP/USD currency pair

Technical indicators of the currency pair:
  • Prev Open: 1.31653
  • Open: 1.30730
  • % chg. over the last day: -0.71
  • Day’s range: 1.30607 – 1.30745
  • 52 wk range: 1.2361 – 1.4345

Yesterday, the bearish sentiment was observed on the GBP/USD currency pair. The decrease in quotes exceeded 100 points. The current technical pattern signals a further fall in quotes. The key support and resistance levels are: 1.30550 and 1.30900, respectively. The positions should be opened from these marks.

At 11:30 (GMT+3:00) data on the UK GDP will be published.

GBP/USD

Indicators point to the power of sellers: the price has fixed below 50 MA and 200 MA.

The MACD histogram is in the negative zone, but above the signal line, which gives a weak signal to sell GBP/USD.

Stochastic Oscillator is in the neutral zone, the %K line is below the %D line, which also gives a signal to sell GBP/USD.

Trading recommendations
  • Support levels: 1.30550, 1.30300
  • Resistance levels: 1.30900, 1.31300, 1.31650

If the price fixes below the support level of 1.30550, the GBP/USD quotes are expected to fall. The movement is tending to 1.30300-1.30000.

An alternative may be the growth of the GBP/USD currency pair to 1.31200-1.31400.

The USD/CAD currency pair

Technical indicators of the currency pair:
  • Prev Open: 1.30188
  • Open: 1.30409
  • % chg. over the last day: +0.13
  • Day’s range: 1.30107 – 1.30299
  • 52 wk range: 1.2059 – 1.3795

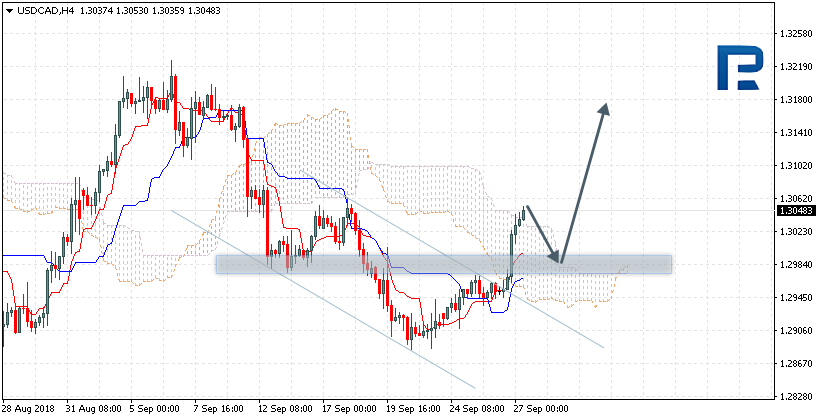
There is a variety of trends on the USD/CAD currency pair. At the moment, quotes have been declining. We expect statistics on Canada GDP. The round level of 1.30000 is the key support. The 1.31300 mark is already a “mirror” resistance. We recommend looking for entry points to the market from these levels.

The news feed on 2018.09.28:
  • – Canada GDP data at 15:30 (GMT+3:00).
USD/CAD

Indicators do not send accurate signals: the price has crossed 50 MA.

The MACD histogram is near the 0 mark.

Stochastic Oscillator is located in the neutral zone, the %K line has crossed the %D line. There are no accurate signals.

Trading recommendations
  • Support levels: 1.30000, 1.29700, 1.29300
  • Resistance levels: 1.30300, 1.30600. 1.30850

If the price fixes above the already “mirror” resistance level of 1.30300, the USD/CAD quotes are expected to grow. The movement is tending to 1.30600-1.30850.

Alternative option. If the price fixes below 1.30000, we recommend looking for entry points to the market to open short positions. The target level for profit-taking is 1.29700-1.29300.

The USD/JPY currency pair

Technical indicators of the currency pair:
  • Prev Open: 112.714
  • Open: 113.360
  • % chg. over the last day: +0.59
  • Day’s range: 113.401 – 113.432
  • 52 wk range: 104.56 – 114.74

Yesterday, the bullish sentiment was observed on the USD/JPY currency pair. The growth of quotes was almost 100 points. At the moment, quotes are consolidating. Local support and resistance levels are: 113.250 and 113.550, respectively. The positions should be opened from these marks. The trading instrument has the potential for further growth.

The news feed on the economy of Japan is rather calm.

USD/JPY

The price has fixed above 50 MA and 200 MA, which indicates the bullish sentiment.

The MACD histogram is located in the positive zone, but below the signal line, which gives a weak signal to buy USD/JPY.

Stochastic Oscillator is located near the oversold zone, the %K line is below the %D line, which gives a weak signal to sell USD/JPY.

Trading recommendations
  • Support levels: 113.250, 112.900, 112.550
  • Resistance levels: 113.550, 114.000

If the price fixes below the local support of 113.250, correction movement is expected. The movement is tending to 112.900-112.700.

An alternative may be the USD/JPY quotes growth to the level of 113.800-114.000.

Analytics by JustForex

The US Dollar Is in the Positive Zone

by JustForex

The US dollar strengthened significantly against the basket of major currencies. The US dollar index (#DX) updated the weekly high and closed in the positive zone (+0.80%). The US currency is supported by an increase in the Fed interest rate, as well as data on GDP. The index counted to 4.2% in the second quarter, as investors expected. Also, the GDP report indicates that the US economy has been growing at the fastest rate in the past 4 years.

Meanwhile, weak economic data were also published in the US, which still did not prevent the growth of the US currency. So, the core durable goods orders increased by 0.1% in August instead of the expected value of 0.4%. Pending home sales index counted to -1.8% in August, while experts forecasted -0.2%.

The “black gold” prices are consolidating. At the moment, futures for the WTI crude oil are testing a mark of $72.25 per barrel.

Market Indicators

Yesterday, the bullish sentiment was observed in the US stock market: #SPY (+0.28%), #DIA (+0.18%), #QQQ (+0.85%).

At the moment, the 10-year US government bonds yield is at the level of 3.04-3.05%.

The news feed on 2018.09.28:

– German unemployment change at 10:55 (GMT+3:00);
– UK GDP data at 11:30 (GMT+3:00);
– Consumer price index in the Eurozone at 12:00 (GMT+3:00);
– Canada GDP data at 15:30 (GMT+3:00).

by JustForex

EURUSD: euro takes a dip on Italian budget concerns

By Gabriel Ojimadu, Alpari

Previous:

On Thursday the 27th of September, trading on the euro closed down. The euro fell significantly against the dollar amid controversy in the Italian government over the budget deficit. EURUSD fell from 1.1757 to 1.1639 (-118 pips).

US data:

  • Pending home sales (Aug): -1.8% (forecast: -0.2%, previous: -0.08%).
  • GDP annualized (Q2): 4.2% (forecast: 4.2%, previous: 4.2%).
  • Initial jobless claims (Sep 21): 214 thou. (forecast: 210 thou., previous: 202 thou.).
  • Durable goods orders (Aug): 4.5% (forecast: 1.8%, previous: -1.2%).

Day’s news (GMT+3):

  • 10:55 Germany: unemployment change (Sep).
  • 11:30 UK: current account (Q2), GDP (QoQ) (Q2), total business investment (QoQ) (Q2).
  • 12:00 Eurozone: CPI (YoY) (Sep).
  • 15:30 Canada: GDP (MoM) (Jul), industrial product price (MoM) (Aug).
  • 15:30 US: personal spending (Aug), personal income (MoM) (Aug).
  • 16:45 US: Chicago Purchasing Managers’ Index (Sep).
  • 23:00 US: Baker Hughes US oil rig count.

Fig 1. EURUSD hourly chart.

Current situation:

On Friday during the Asian session, buyers tried to partially win back losses against the background of an overall weakening of the dollar as part of the corrections. However, the attempt proved unsuccessful, with sellers shifting the low to 1.1632.

The dollar remains strong after the FOMC meeting and signals from the Fed on a further tightening with regard to monetary policy for 2019. According to the forecast, I expect the euro to fall to 1.1618, despite the fact that sellers have opened the way to 1.1595 (D3). Here I relied on hourly cycles. Although the price is already at 1.1628. If 157th degree doesn’t hold, then the fall will continue to 1.1550. The euro will close down against the dollar just as it did yesterday, and on Monday I’ll compare this movement against Friday.

Fibo Analysis: AUD/USD and USD/CAD, 27.09.2018

Article By RoboForex.com

AUD/USD

On H4, the ascending trend on AUDUSD has stopped for a while. The nearest uptrend targets are 23.6% (0.7333) and 38.2% (0.7487), with the low at 0.7085 being the current support.

AUDUSD1
Risk Warning: the result of previous trading operations do not guarantee the same results in the future

On H1, the AUD/USD is forming a correctional downtrend after the divergence. The correction reached 38.2% Fibo and may reach 50.0% (0.7200), 61.8% (0.7173), and 76.0% (0.7140).

AUDUSD2
Risk Warning: the result of previous trading operations do not guarantee the same results in the future

USD/CAD

On H4, the USDCAD is uptrending after pulling back to 38.2% Fibo. The rising impulse is pushing the price back to 23.6% Fibo (1.3117). The major target of this rise is however the high at $1.3386. The downtrend may yet continue, with the targets at 50.00% and 61.80% Fibo (1.2818 and 1.2683, respectively).

USDCAD1
Risk Warning: the result of previous trading operations do not guarantee the same results in the future

On H1, the USDCAD is uptrending towards 1.3117.

USDCAD2
Risk Warning: the result of previous trading operations do not guarantee the same results in the future

Article By RoboForex.com

Attention!
Forecasts presented in this section only reflect the author’s private opinion and should not be considered as guidance for trading. RoboForex LP bears no responsibility for trading results based on trading recommendations described in these analytical reviews.

Ichimoku Analysis: AUD/USD, NZD/USD, USD/CAD, 27.09.2018

Article By RoboForex.com

AUD/USD

The AUD/USD is trading at 0.7227, inside the Ichimoku cloud, which means the pair is trading sideways. We expect a test of the upper cloud boundary at 0.7250, and then a downward pullback to 0.7130, which may be confirmed with the price bouncing off the resistance area. This may be prevented in case the price breaks out the upper boundary and closes above 0.7285, which will be a signal for a further rise to 0.7375 and above. Conversely, the fall may be confirmed once the bottom boundary gets broken out and the price closes below 0.7185.

AUDUSD
Risk Warning: the result of previous trading operations do not guarantee the same results in the future

NZD/USD

The NZD/USD is trading at 0.6636, above the Ichimoku cloud, which means there’s an uptrend forming. We expect a test of the upper cloud boundary at 0.6625, and then a rise to 0.6725, which may be confirmed with the price bouncing off the support area. This rise may be prevented in case price breaks out the lower boundary and closes below 0.6600, which will be a signal for a further fall to 0.6525. Conversely, the rise will be confirmed once the top boundary of the triangle pattern gets broken out and the price closes above 0.6695.

NZDUSD
Risk Warning: the result of previous trading operations do not guarantee the same results in the future

USD/CAD

The USD/CAD is trading at 1.3048, above the Ichimoku cloud, which means there’s an uptrend forming. We expect a test of upper cloud boundary at 1.2985, and then another rise to 1.3180, which may be confirmed with the price bouncing off the support area. This rise may be prevented in case price breaks out the lower boundary and closes below 1.2905, which will be a further fall to 1.2825.

USDCAD
Risk Warning: the result of previous trading operations do not guarantee the same results in the future

Article By RoboForex.com

Attention!
Forecasts presented in this section only reflect the author’s private opinion and should not be considered as guidance for trading. RoboForex LP bears no responsibility for trading results based on trading recommendations described in these analytical reviews.

The Analytical Overview of the Main Currency Pairs on 2018.09.27

Analytics by JustForex

The EUR/USD currency pair

Technical indicators of the currency pair:
  • Prev Open: 1.17654
  • Open: 1.17362
  • % chg. over the last day: -0.21
  • Day’s range: 1.16906 – 1.17570
  • 52 wk range: 1.0571 – 1.2557

The Fed, as expected, raised the key interest rate range by 25 basis points to 2.00% -2.25%. The regulator improved the forecast of GDP growth for 2018-2019. The head of the Central Bank, Jerome Powell, also said that the rejection of identifying the monetary policy as “stimulating” in the communique is not a signal of a change in the Fed’s current policy rate. At the moment the EUR/USD quotes show negative dynamics. The trading instrument is consolidating in the range of 1.16850-1.17100. The EUR/USD currency pair is tending to decrease.

The news feed on the US economy for 2018.09.27
  • – A report on GDP at 15:30 (GMT+3:00);
  • – The index of pending sales in the real estate market at 17:00 (GMT+3:00).

We also recommend paying attention to the speech by the heads of the ECB and the US Federal Reserve System.

EUR/USD

Indicators point to the power of sellers: the price has fixed below 50 MA and 200 MA.

The MACD histogram has moved to the negative zone and is below the signal line, which gives a strong signal to sell EUR/USD.

Stochastic Oscillator is located in the neutral zone, the %K line is below the %D line, which indicates the bearish sentiment.

Trading recommendations
  • Support levels: 1.16850, 1.16500, 1.16200
  • Resistance levels: 1.17100, 1.17300, 1.17700

If the price fixes below the support level of 1.16850, the EUR/USD quotes are expected to fall further. The movement is tending to 1.16500-1.16200.

An alternative may be the growth of the EUR/USD currency pair to the level of 1.17500-1.17700.

The GBP/USD currency pair

Technical indicators of the currency pair:
  • Prev Open: 1.31778
  • Open: 1.31653
  • % chg. over the last day: -0.09
  • Day’s range: 1.31230 – 1.31779
  • 52 wk range: 1.2361 – 1.4345

Yesterday the GBP/USD currency pair held the round level of 1.32000, which caused the bearish sentiment. The current technical pattern signals a further fall in quotations. The key levels of support and resistance are: 1.31250 and 1.31650 respectively. The positions must be opened from these marks. We recommend you to keep track of the current information regarding the Brexit process.

The news feed on the UK economy is calm. At 17:00 (GMT+3:00) investors will evaluate the speech by the head of the Bank of England.

GBP/USD

Indicators do not send accurate signals: 50 MA has crossed 200 MA.

The MACD histogram has moved into the negative zone, which signals the bearish sentiment.

Stochastic Oscillator is in the neutral zone, the %K line has crossed the %D line. There are no signals at the moment.

Trading recommendations
  • Support levels: 1.31250, 1.31000, 1.30700
  • Resistance levels: 1.31650, 1.32000, 1.32350

If the price falls below the support level of 1.31250, GBP/USD is expected to fall. The movement is tending to 1.31000-1.30700.

An alternative may be the growth of the GBP/USD currency pair to the level of 1.31800-1.32000.

The USD/CAD currency pair

Technical indicators of the currency pair:
  • Prev Open: 1.29498
  • Open: 1.30188
  • % chg. over the last day: +0.65
  • Day’s range: 1.30034 – 1.30587
  • 52 wk range: 1.2059 – 1.3795

There is a pronounced trend on the USD/CAD pair. Yesterday, the growth of quotations exceeded 70 points. Today, loonie has continued to lose ground against the US dollar. The trading instrument has approached the key resistance level of 1.30650. The local support is the mark of 1.30300. The USD/CAD currency pair is tending to grow.

The publication of important economic reports from Canada is not planned.

USD/CAD

Indicators point to the power buyers: the price has fixed above 50 MA and 200 MA.

The MACD histogram is in the positive zone and above the signal line, which gives a strong signal to buy USD/CAD.

Stochastic Oscillator is located near the overbought zone, the %K line is above the %D line, which also signals the purchase of USD/CAD.

Trading recommendations
  • Support levels: 1.30300, 1.30000, 1.29700
  • Resistance levels: 1.30650, 1.31000

If the price fixes above the resistance level of 1.30650, further growth of the USD/CAD quotations is expected. The movement is tending to 1.31000-1.31250.

Alternative option. If the price fixes below 1.30300, we recommend you to look for entry points to the market to open short positions. The target level for profit-taking is 1.30000-1.29700.

The USD/JPY currency pair

Technical indicators of the currency pair:
  • Prev Open: 112.970
  • Open: 112.714
  • % chg. over the last day: -0.23
  • Day’s range: 112.586 – 112.899
  • 52 wk range: 104.56 – 114.74

At the moment, the USD/JPY currency pair is consolidating after a significant increase since the beginning of this month. In the near future, a technical correction is not ruled out. The trading instrument is testing local support and resistance levels: 112.600 and 112.850, respectively. The positions must be opened from these marks. We recommend you to pay attention to economic reports from the USA.

The news feed on Japan’s economy is calm.

USD/JPY

The price has fixed between 50 MA and 200 MA, which are strong dynamic levels of support and resistance.

The MACD histogram is located in the negative zone and below the signal line, which gives a strong signal to sell USD/JPY.

Stochastic Oscillator is close to the oversold zone, the %K line is crossing the %D line. There are no signals at the moment.

Trading recommendations
  • Support levels: 112.600, 112.400, 112.100
  • Resistance levels: 112.850, 113.100

If the price fixes below the local support of 112.600, the correction movement is expected. The movement is tending to 112.400-112.100.

An alternative may be the growth of the USD/JPY quotations to the local offer zone of 113.000-113.100.

Analytics by JustForex

Investors Assess the Results of the Fed Meeting

by JustForex

The US currency strengthened against the basket of major currencies after the Fed meeting. As it became known, the regulator increased the range of the key interest rate by 25 basis points to 2.00%-2.25%, as investors expected. Yesterday, the US dollar index (#DX) closed in the positive zone (+0.06%) and continues to rise. The Central Bank published an optimistic forecast of the country’s economic growth for 2018-2019. The Fed Chairman, Jerome Powell, also said that the rejection of identifying the monetary policy as “stimulating” in the communique is not a signal of a change in the Fed’s current policy rate.

Today, during the Asian trading session, the Reserve Bank of New Zealand has also announced a decision on the interest rate. The indicator remained unchanged at 1.75%, as investors expected. The regulator plans to adhere to the current rate of monetary policy. Today, we recommend paying attention to the US news feed.

The “black gold” prices are rising. At the moment, futures for the WTI crude oil are testing a mark of $72.45 per barrel.

Market Indicators

Yesterday, there was a variety of trends in the US stock market: #SPY (-0.30%), #DIA (-0.36%), #QQQ (+0.07%).

At the moment, the 10-year US government bonds yield is at the level of 3.04-3.05%.

The news feed on the US economy on 2018.09.27:

– Core durable goods orders at 15:30 (GMT+3:00);
– GDP data at 15:30 (GMT+3:00);
– Pending home sales at 17:00 (GMT+3:00).

We also recommend paying attention to the speeches by the heads of the ECB, the Bank of England and the Fed.

by JustForex

EURUSD: breakout of the horizontal support at 1.1720

By Gabriel Ojimadu, Alpari

Previous:

On Wednesday the 26th of September, trading on the euro closed down. High volatility on the pair was observed during the day. The price managed to dip to 1.1726 ahead of the announcement of the Fed decision before returning to 1.1770.

The FOMC decided to raise rates by 0.25 basis points to a range between 2 and 2.25 percent. The decision coincided with market expectations, and was immediately followed by a fall in the US dollar index. Powell’s press conference strengthened the dollar. During the press conference Powell confirmed a fourth rate hike for 2018, and a three slated for 2019. The euro fell from 1.1798 to 1.1732, and in Asia to 1.1707.

Day’s news (GMT+3):

  • 09:00 Germany: GfK consumer confidence survey (Oct).
  • 11:00 Eurozone: economic bulletin.
  • 12:00 Eurozone: consumer confidence (Sep), industrial confidence (Sep), business climate (Sep), services sentiment (Sep).
  • 14:45 UK: MPC member Haldane speech.
  • 15:00 Germany: CPI (YoY) (Sep).
  • 15:30 US: GDP annualized (Q2), durable goods orders (Aug), initial jobless claims (Sep 21).
  • 16:30 Eurozone: ECB President Draghi’s speech.
  • 17:00 US: pending home sales (MoM) (Aug).

Fig 1. EURUSD hourly chart.

Current situation:

Projections for the EURUSD pair remained unchanged ahead of the US Fed decision. The price fell to 1.1726. During the Asian session, sellers demolished the trend line and the horizontal support (1.1720-1.1735). They themselves opened the way to 1.1635-1.1663.

I think that sellers will be met with resistance from buyers at 1.1697. After a brief consolidation, the decline will continue. As for the news, we should definitely pay attention to the ECB’s economic bulletin and MPC Member Haldane’s speech. I wouldn’t pay much attention to Draghi, Carney, and Powell’s speeches. Powell said everything yesterday. Nevertheless, it’s worth keeping the time of their speeches in mind if you plan to open or close positions, and also if you wish to set a stop loss.

I have nothing more to add to the chart. I’m waiting for the euro to weaken against the dollar to the 112thdegree.

The EUR/USD Waiting for Fed Decision: Market Review, 26.09.2018

Article By RoboForex.com

The EUR/USD is not changing a lot today. The pair is currently trading at 1.1770. As the two-day Fed meeting is coming to an end, the market is focusing on it sharply. The interest rate hike probability is 100%, and there’s not much about it. The rate will be most likely pushed to the target range of 2.00%-2.25%, i.e. +25 basic points.

What holds the market in suspence is what Jerome Powell is going to say on the press conference. First, the investors want to know whether the fourth hike is possible after the Dec meeting and whether the US economy is ready for it. Second, the governor’s estimations on the manufacturing production and exports are very interesting, too. Besides, while the job market and inflation are looking good, the Fed official review can also be valuable for the markets.

The Fed has been cutting the QE over this year, reducing the amounts of the debt securities being bought. The sales performed each month are not that large-scaled, but the US central bank may increase them anytime, which would make the greenback stronger.

The more hawkish Powell is today, the better for the US dollar. The details are going to be important, too.

Article By RoboForex.com

Attention!
Forecasts presented in this section only reflect the author’s private opinion and should not be considered as guidance for trading. RoboForex LP bears no responsibility for trading results based on trading recommendations described in these analytical reviews.

Tech Analysis: EUR/USD, GBP/USD, USD/CHF, USD/JPY, AUD/USD, USD/RUB, GOLD, BRENT; 26.09.2018

Article By RoboForex.com

EURUSD

The EUR/USD is trading within a consolidation range near 1.1762. Today, it may go up to 1.1793, within the diamond pattern. Then, the pair is likely to leave this range and go down to reach the target at 1.1725. and then, once a breakout occurs, to go further to 1.1660, i.e. a local target.

EURUSD
Risk Warning: the result of previous trading operations do not guarantee the same results in the future

GBPUSD

The GBP/USD has exited the 5-wave correction pattern and may now start falling to 1.3030, which is going to be the first target.

GBPUSD
Risk Warning: the result of previous trading operations do not guarantee the same results in the future

USDCHF

The USD/CHF is correcting; today, the pair may reach 0.9631 and test it from above. Then, a rise to 0.9682 is possible, i.e. a local target.

USDCHF
Risk Warning: the result of previous trading operations do not guarantee the same results in the future

USDJPY

The USD/JPY has completed its rising pattern and may now start correcting, with the first target at 112.32.

USDJPY
Risk Warning: the result of previous trading operations do not guarantee the same results in the future

AUDUSD

The AUDUSD got inside the first downward impulse, and then corrected. Today, the third downward wave may take the pair to 0.7200.

AUDUSD
Risk Warning: the result of previous trading operations do not guarantee the same results in the future

USDRUB

The USD/RUB has entered the consolidation range and is trading near its lows. Today, it may start going up. After breaking out at 65.95 the first correction phase may start, with the target at 66.60.

USDRUB
Risk Warning: the result of previous trading operations do not guarantee the same results in the future

GOLD

Gold may probably rise to 1206.70, but then is likely to fall till 1190.20.

GOLD
Risk Warning: the result of previous trading operations do not guarantee the same results in the future

BRENT

Brent crude reached the strategic uptrend target and may now start consolidating near its highs. In case a breakout occurs, the price may start correcting to 80.25.

BRENT
Risk Warning: the result of previous trading operations do not guarantee the same results in the future

Article By RoboForex.com

Attention!
Forecasts presented in this section only reflect the author’s private opinion and should not be considered as guidance for trading. RoboForex LP bears no responsibility for trading results based on trading recommendations described in these analytical reviews.