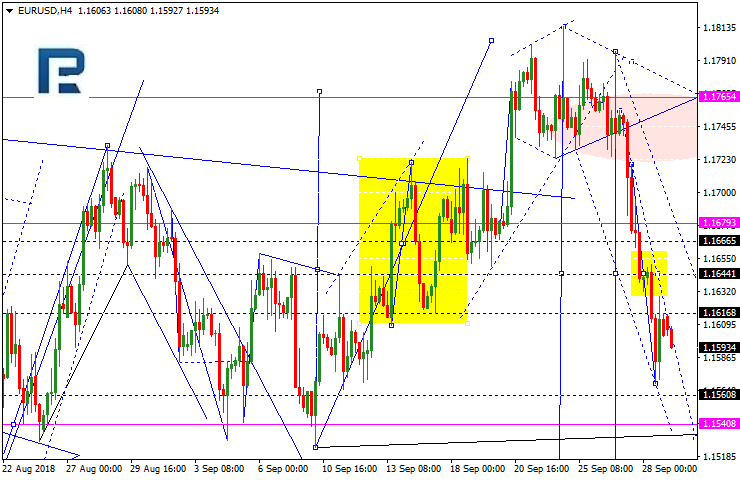
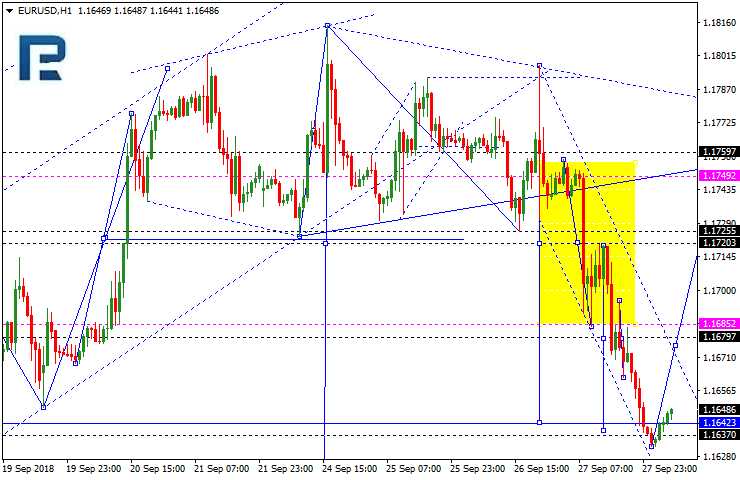
EURUSD is still moving downwards. Possibly, the pair may reach 1.1540 and then start a new correction to test 1.1616 from below. Later, the market may resume falling with the target at 1.1494.
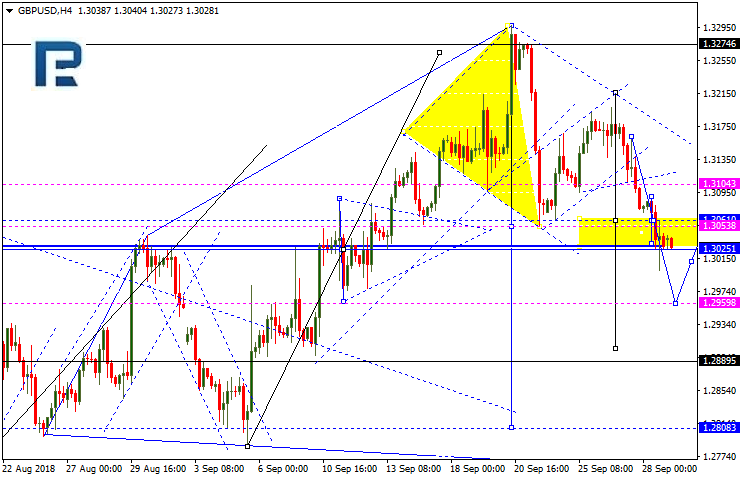
GBPUSD, “Great Britain Pound vs US Dollar”
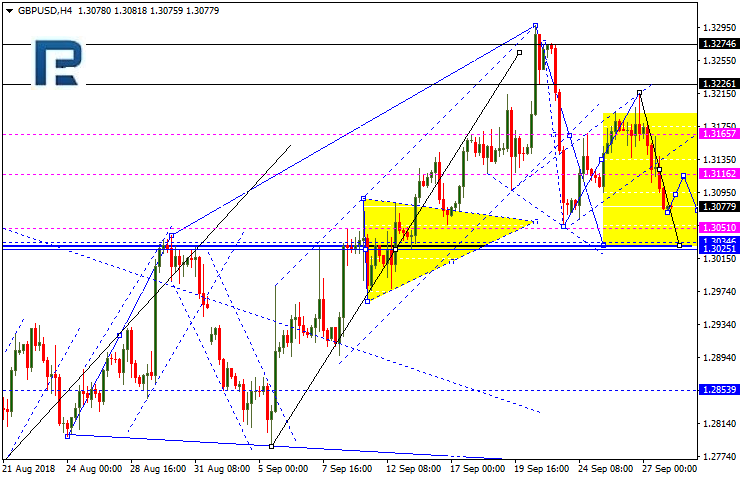
GBPUSD has reached the target of the fifth descending wave; it has finished another consolidation range, broken it downwards, and may continue falling to reach 1.2808. Possibly, today the pair may form a new descending structure to reach 1.2960 and then start a new correction to test 1.3030 from below. After that, the instrument may resume trading inside the downtrend with the target at 1.2888.
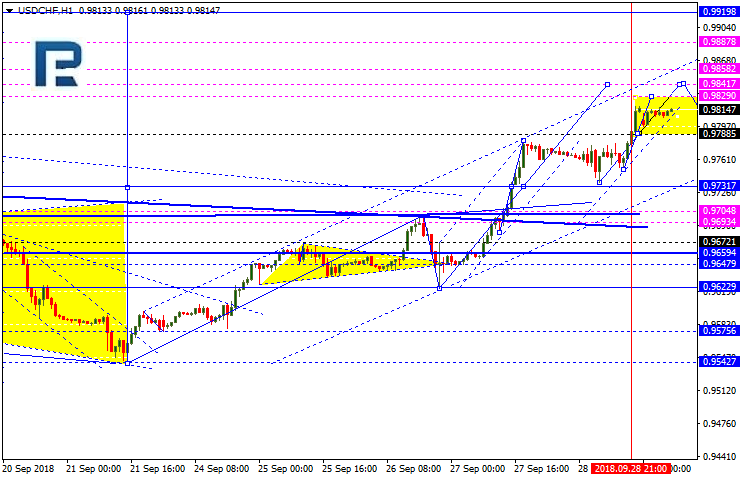
USDCHF, “US Dollar vs Swiss Franc”
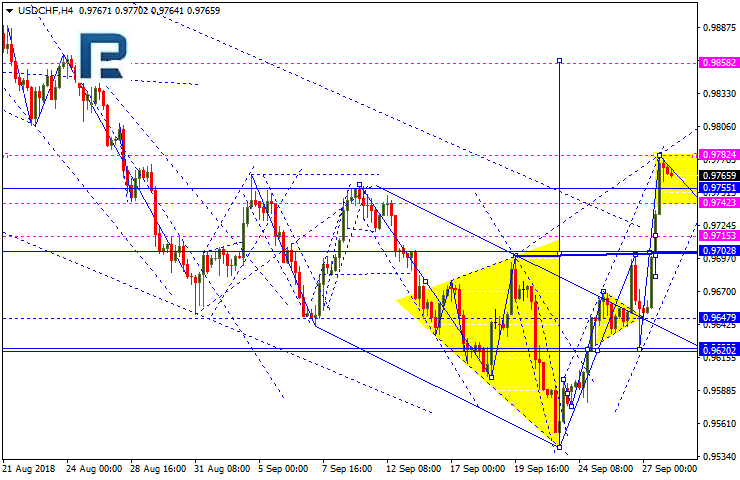
USDCHF is extending the current ascending wave. Today, the price may grow to reach 0.9841 and then start a new correction towards 0.9788. Later, the market may resume growing with the target at 0.9888.
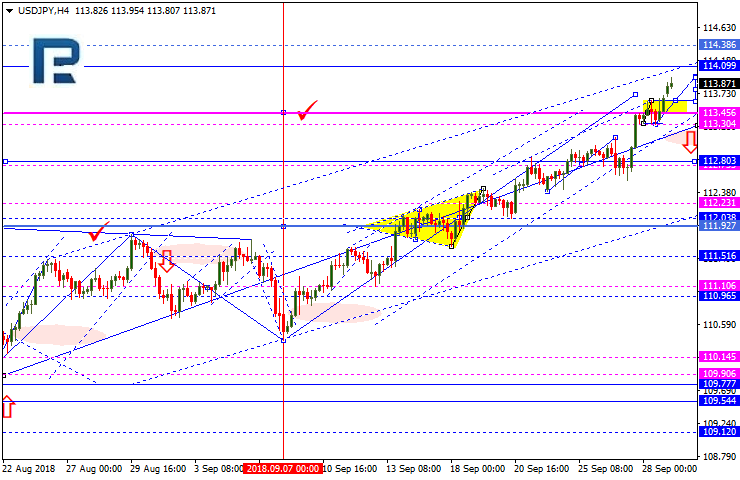
USDJPY, “US Dollar vs Japanese Yen”
USDJPY is extending the third wave; it has broken the consolidation range upwards and completed the first structure. Possibly, the pair may fall to reach 113.63 and then resume growing with the target at 114.10.
AUDUSD, “Australian Dollar vs US Dollar”
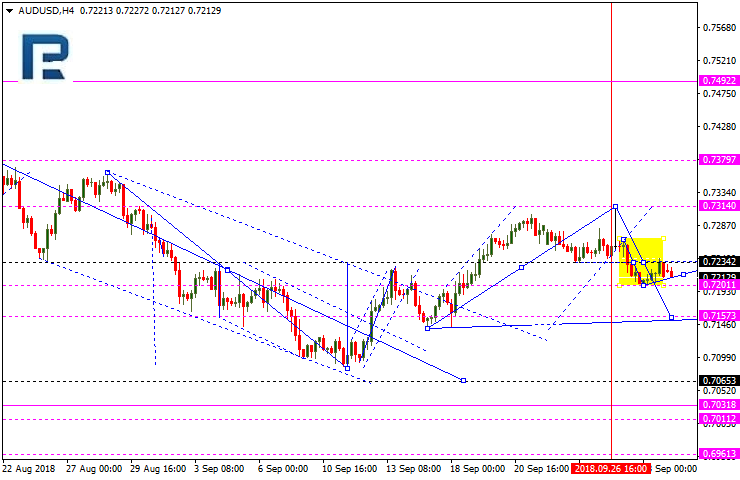
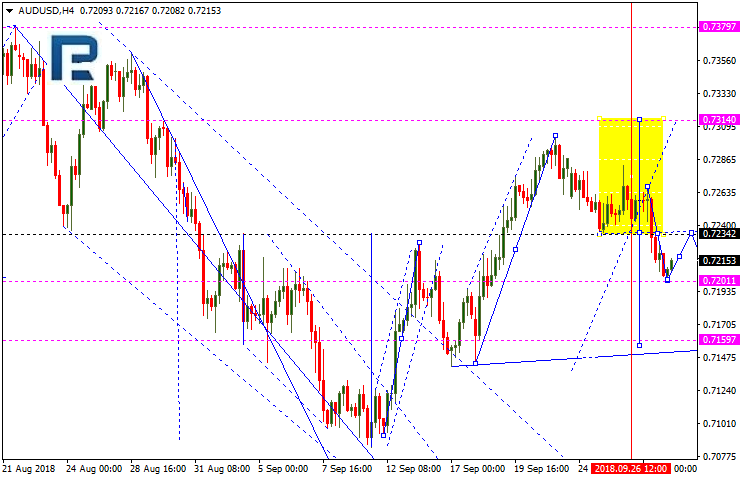
AUDUSD has reached the correctional target and right now is moving downwards. Possibly, the pair may continue trading inside the downtrend with the first target at 0.7157.
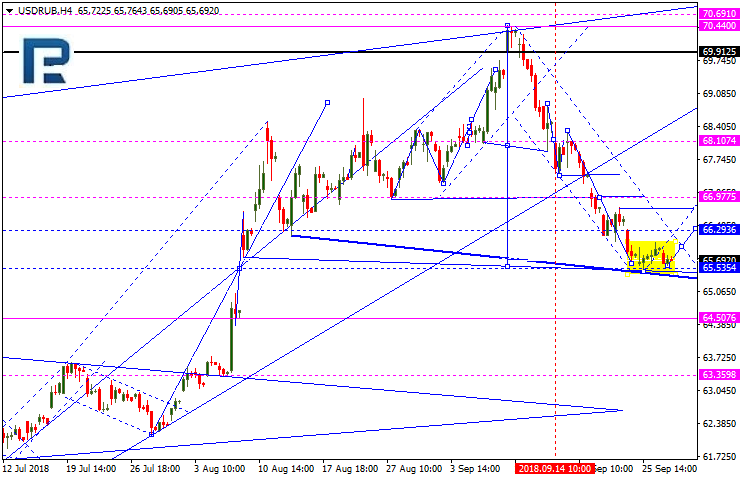
USDRUB, “US Dollar vs Russian Ruble”
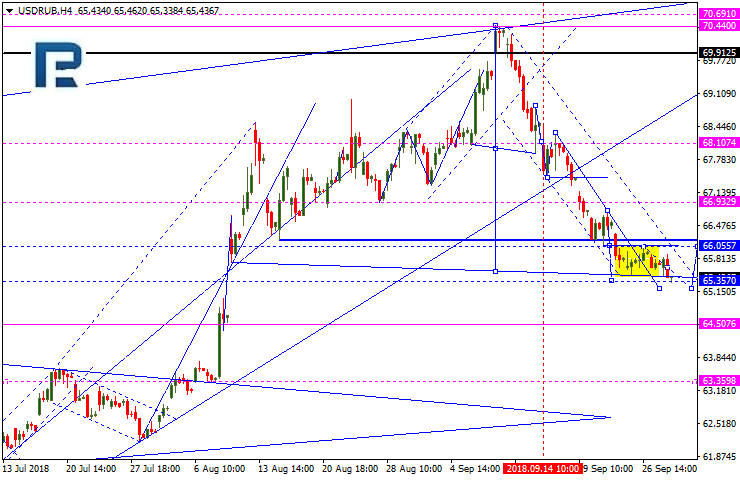
USDRUB is still consolidating near the lows. Possibly, today the pair may expand the range towards 65.00. If the instrument breaks this range to the upside, the price may be corrected to reach 67.00; if to the downside – resume falling with the target at 63.36.
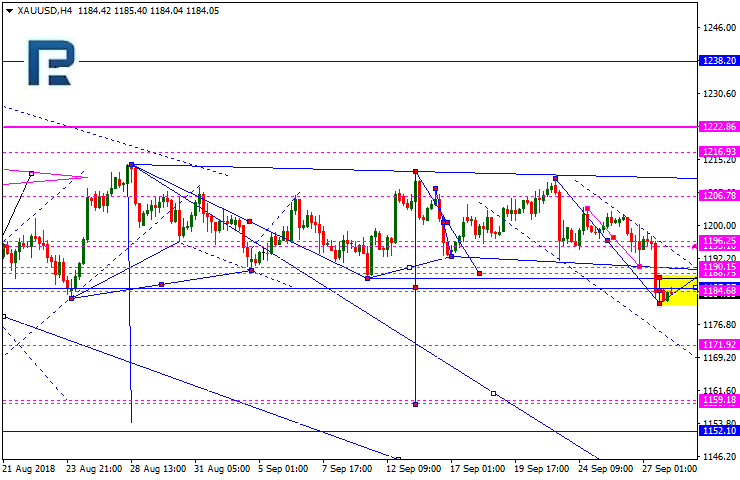
XAUUSD, “Gold vs US Dollar”
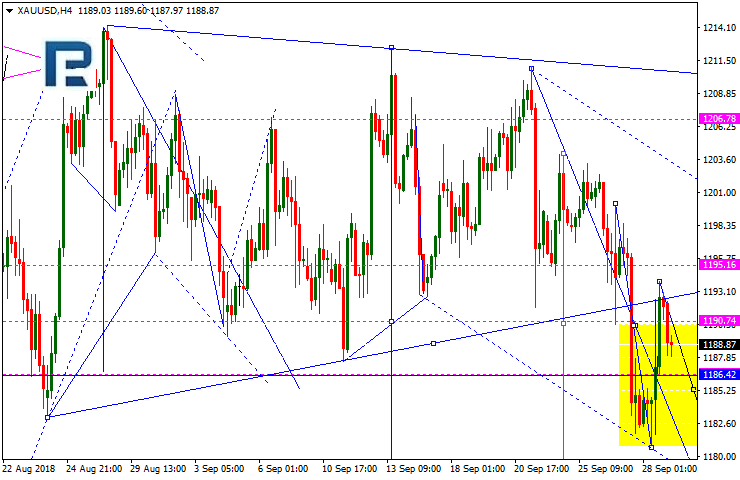
Gold has returned to 1190.75 and right now is moving downwards. Possibly, the pair may form a new descending structure to reach 1170.20.
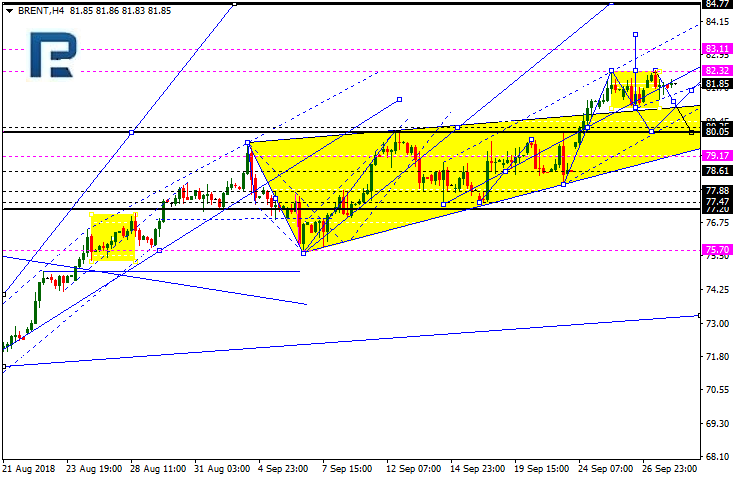
BRENT
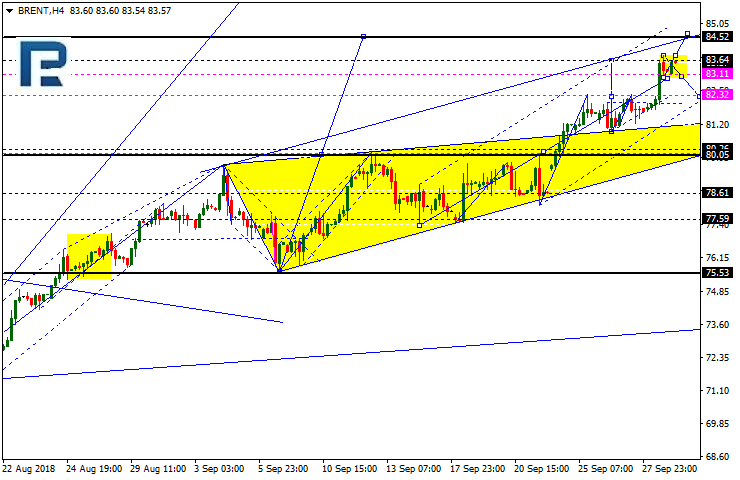
Brent is consolidating above 83.10. If the instrument breaks this range to the upside, the price may grow to reach 84.50; if to the downside – continue trading to the downside with the target at 82.32.
Attention! Forecasts presented in this section only reflect the author’s private opinion and should not be considered as guidance for trading. RoboForex LP bears no responsibility for trading results based on trading recommendations described in these analytical reviews.
There are sales on the EUR/USD currency pair. The euro is declining against the US dollar due to the concerns regarding the budget of Italy. At the moment, the EUR/USD quotes are consolidating. The key support and resistance levels are: 1.15700 and 1.16100, respectively. We recommend opening positions from these marks. The EUR/USD currency pair has the potential for further decrease.
The news feed on 2018.10.01:
– The index of economic activity in the manufacturing sector of Germany at 10:55 (GMT+3:00);
– The index of economic activity in the manufacturing sector of the US from ISM at 17:00 (GMT+3:00).
Indicators point to the power of sellers: the price has fixed below 50 MA and 200 MA.
The MACD histogram is in the negative zone, but above the signal line, which gives a weak signal to sell EUR/USD.
Stochastic Oscillator is located in the neutral zone, the %K line is above the %D line, which signals to buy EUR/USD.
Trading recommendations
Support levels: 1.15700, 1.15400, 1.15000
Resistance levels: 1.16100, 1.16500, 1.16800
If the price fixes below the support level of 1.15700, the EUR/USD quotes are expected to fall. The movement is tending to 1.15400-1.15000.
An alternative may be the growth of the EUR/USD currency pair to 1.16400-1.16700.
The GBP/USD currency pair
Technical indicators of the currency pair:
Prev Open: 1.30730
Open: 1.30379
% chg. over the last day: -0.39
Day’s range: 1.30242 – 1.30382
52 wk range: 1.2361 – 1.4345
On Friday, the bearish sentiment prevailed on the GBP/USD currency pair. The British pound weakened against the US dollar after the publication of a weak report on UK GDP. GDP (y/y) fell to 1.2% in the second quarter, while experts expected 1.3%. GDP (q/q) counted to 0.4%, as investors expected. At the moment, the key support and resistance levels are: 1.30200 and 1.30600, respectively. The positions should be opened from these marks.
At 11:30 (GMT+3:00), the index of economic activity in the UK manufacturing sector will be published.
Indicators point to the power of sellers: the price has fixed below 50 MA and 200 MA.
The MACD histogram is in the negative zone, but above the signal line, which gives a weak signal to sell GBP/USD.
Stochastic Oscillator is in the neutral zone, the %K line is above the %D line, which signals to buy GBP/USD.
Trading recommendations
Support levels: 1.30200, 1.29800
Resistance levels: 1.30600, 1.31000, 1.31400
If the price fixes below the support level of 1.30200, the GBP/USD quotes are expected to fall. The movement is tending to 1.29800-1.29600.
An alternative may be the growth of the GBP/USD currency pair to 1.31000-1.31400.
The USD/CAD currency pair
Technical indicators of the currency pair:
Prev Open: 1.30409
Open: 1.28477
% chg. over the last day: -0.53
Day’s range: 1.28184 – 1.28436
52 wk range: 1.2059 – 1.3795
Aggressive sales are observed on the USD/CAD currency pair. On Friday, the decline in quotes exceeded 200 points. Demand for Canadian currency is still at a high level. Optimistic report on Canada’s GDP supports Loonie. Governor of the Bank of Canada said that in the near future the regulator could consider raising interest rates. It also became known that Canada agreed to join the trade agreement with the US and Mexico. The new agreement will be called the US-Mexico-Canada Agreement (USMCA). At the moment, the key support and resistance levels are: 1.28100 and 1.28500, respectively. We recommend looking for entry points to the market from these levels.
Today, the publication of important economic reports from Canada is not planned.
Indicators point to the power of sellers: the price has fixed below 50 MA and 200 MA.
The MACD histogram is in the negative zone, but above the signal line, which gives a weak signal to sell USD/CAD.
Stochastic Oscillator is located in the neutral zone, the %K line is below the %D line, which also indicates a decline in quotes.
Trading recommendations
Support levels: 1.28100, 1.27600
Resistance levels: 1.28500, 1.29000, 1.29500
If the price fixes below 1.28100, we recommend looking for entry points to the market to open short positions. The target level for profit-taking is 1.27600-1.27400.
Alternative option. If the price fixes above the resistance level of 1.28500, the correction of the USD/CAD quotes is expected. The movement is tending to 1.29000-1.29200.
The USD/JPY currency pair
Technical indicators of the currency pair:
Prev Open: 113.360
Open: 113.703
% chg. over the last day: +0.27
Day’s range: 113.701 – 113.761
52 wk range: 104.56 – 114.74
There is an upward trend on the USD/JPY currency pair. During the Friday’s and today’s trading, the growth of quotes was almost 100 points. At the moment, local support and resistance levels are: 113.700 and 114.100, respectively. The positions should be opened from these marks. The trading instrument has the potential for further growth.
During the Asian trading session, weak statistics from Tankan have been published.
The price has fixed above 50 MA and 200 MA, which indicates the bullish sentiment.
The MACD histogram is located in the positive zone, above the signal line, which gives a strong signal to buy USD/JPY.
Stochastic Oscillator is in the overbought zone, the %K line is crossing the %D line. There are no accurate signals.
Trading recommendations
Support levels: 113.700, 113.350, 113.000
Resistance levels: 114.100, 114.500
If the price fixes above the local resistance of 114.100, further growth of the USD/JPY currency pair is expected. The movement is tending to 114.500-114.700.
An alternative may be the correction of the USD/JPY quotes to the level of 113.500-113.350.
The US currency shows positive dynamics. On Friday, the US dollar index (#DX) closed in the positive zone (+0.23%). The US currency is supported by the differential of interest rates, as well as optimistic economic reports. Financial market participants expect a report on the US labor market for September.
As it became known, Canada agreed to join the trade agreement with the US and Mexico. The new agreement will be called the US-Mexico-Canada Agreement (USMCA) and will replace the North American Free Trade Agreement (NAFTA).
The euro is declining against the US dollar due to concerns regarding Italy. On Friday, Italy submitted a budget for the next year, which foresaw a deficit of 2.4% of GDP. This indicator of a deficit is three times higher than the previous directions of Italy’s government. The British pound also weakened against the US dollar after the publication of a weak report on UK GDP. GDP (y/y) fell to 1.2% in the second quarter, while experts expected 1.3%. GDP (q/q) counted to 0.4%, as investors expected.
The “black gold” prices are growing. At the moment, futures for the WTI crude oil are testing a mark of $73.40 per barrel.
Market Indicators
On Friday, there was a variety of trends in the US stock market: #SPY (+0.01%), #DIA (+0.06%), #QQQ (-0.02%).
At the moment, the 10-year US government bonds yield is at the level of 3.05-3.06%.
The news feed on 2018.10.01:
– The index of economic activity in the manufacturing sector of Germany at 10:55 (GMT+3:00); – The index of economic activity in the manufacturing sector of the UK at 11:30 (GMT+3:00); – The index of economic activity in the manufacturing sector of the US from ISM at 17:00 (GMT+3:00).
On Friday the 28th of September, trading on the euro closed down. The euro dropped to 1.1570 over the course of the European session. The single currency came under pressure over concerns about Italy’s budget for 2019. Investors fear that the budget deficit will reach 2.4% of GDP, where they originally expected just 1.6%. The Italian FSTE MIB index has fallen by 3.74% on these fears. Italian 10-year bond yields surged on the back of this selloff.
In the US session, the euro regained ground against the dollar to reach 1.1630. The Canadian dollar may have led to the closing of short positions ahead of the weekend after it shot up against the greenback following optimistic remarks from BoC Governor Steven Poloz. He hinted at a rate hike in October and favourable GDP data.
Day’s news (GMT+3):
10:15 Switzerland: real retail sales (Aug).
10:15 Spain: Markit manufacturing PMI (Sep).
10:30 Switzerland: SVME – PMI (Sep).
10:45 Italy: Markit manufacturing PMI (Sep).
10:50 France: Markit manufacturing PMI (Sep).
10:55 Germany: Markit manufacturing PMI (Sep).
11:00 Eurozone: Markit manufacturing PMI (Sep).
11:30 UK: Markit manufacturing PMI (Sep), net lending to individuals (Aug), M4 money supply (Aug), mortgage approvals (Aug).
12:00 Eurozone: unemployment rate (Aug).
16:45 USA: Markit manufacturing PMI (Sep).
17:00 USA: ISM manufacturing PMI (Sep), construction spending (Aug).
Fig 1. EURUSD hourly chart.
Current situation:
The decline on the EURUSD pair came to an end just below the 180th degree at the D3 MA line (blue). It then rebounded upwards by 45 degrees.
The euro has opened down in today’s Asian session. I reckon that this upwards correction will continue to 1.1650. The balance line will make it to this level in time for the US session, which will act as a resistance to buyers.
For today, I don’t see the pair dropping any further than 1.1570. This is according to cycles, patterns, and the wave structure. If the euro rises to 1.1650 as per my forecast, we’ll need to take a look at the impulse structure and at how the euro crosses behave.
If the euro remains under pressure, and the other majors are ready for a decline against the greenback, one might consider going short from 1.1650. This level is just a rough estimate. As our pair approaches this level, we’ll need to re-evaluate the viability of a short position, because growth could go as far as 1.1685 on the back of the dollar’s correction.
Last week was definitely an eventful one for DXY, which came as no surprise considering the full calendar we had. We’d have been surprised if nothing had happened, and traders took those fundamental events from last week very well!
DXY is climbing higher and it looks like the bad times are past us, as we prepare for a new upswing. First, DXY broke the mid-term downwards trend line (green), which had been connecting the lower highs since mid-August. That was the first sign of a spring here. Then DXY broke the 23.6% Fibonacci, and finally the 38.2% Fibo, which in the same time was a crucial S/R level in the past few weeks (since the 22nd of August, when it was first used as a support). The breakout of that line is currently the most important achievement for buyers.
The buy signal is on and will be here as long as the price stays above 23.6% Fibonacci. The crucial resistance and the current target is at 61.8% Fibonacci. A small bearish correction may be triggered if we make it there, but the overall trend should remain intact, so buy.
The dollar ended last week with a bang! It seems that the US dollar has finally strengthened and we are returning to the bullish trend. One of the best examples on the market is AUDUSD, where the technical situation is very promising for potential sellers.
First of all, the price bounced from the long-term downwards trend line (black), which has been connecting lower highs since the beginning of the year. Actually, the price tested that resistance twice, which brings us to the another factor: a double top formation. But wait, there is more! The second top is a shooting star on the daily chart. In addition to that, the recent correction was a flag and we broke lower line of this formation. Want more? After the bigger flag, AUDUSD created a smaller one (green) and the price is currently breaking the lower line of this formation, giving us a fresh sell signal. It looks nice, and to be honest, I do not see any positive factors here.
The sell signal will be cancelled when the price breaks the black line, which for the time being, is less likely to happen. As for the potential target, September’s lows seem like a great place and AUDUSD should have its sights set there.
US Dollar Index bets fell for just the second time in the past twenty-three weeks
Overall, the major currencies that improved this week were the euro (2,030 weekly change in contracts), British pound sterling (12,180 contracts), Swiss franc (2,355 contracts), Canadian dollar (10,579 contracts), New Zealand dollar (154 contracts) and the Mexican peso (10,885 contracts).
The currencies whose speculative bets declined this week were the US Dollar Index (-447 weekly change in contracts), the Japanese yen (-20,964 contracts) and the Australian dollar (-4,058 contracts). See full article
The non-commercial contracts of WTI crude futures totaled a net position of 560,085 contracts, according to data from this week. This was a lift of 29,719 contracts from the previous weekly total. See full article
The large speculator contracts of gold futures totaled a net position of -17,648 contracts. This was a weekly decline of -6,804 contracts from the previous week. See full article
The large speculator contracts of 10-year treasury note futures totaled a net position of -756,316 contracts. This was a weekly reduction of -71,604 contracts from the previous week. See full article
The large speculator contracts of S&P500 Mini futures totaled a net position of 197,916 contracts. This was a rise of 47,954 contracts from the reported data of the previous week. See full article
The non-commercial contracts of silver futures totaled a net position of -23,255 contracts, according to data from this week. This was a weekly gain of 2,261 contracts from the previous totals. See full article
The large speculator contracts of copper futures totaled a net position of 11,104 contracts. This was a weekly boost of 11,295 contracts from the data of the previous week. See full article
The Commitment of Traders report data is published in raw form every Friday by the Commodity Futures Trading Commission (CFTC) and shows the futures positions of market participants as of the previous Tuesday (data is reported 3 days behind).
Fact: The direction of interest rates does not determine the stock market’s trend
By Elliott Wave International
Investing is hard. You, like many others, probably watch financial TV networks, read analysis, listen to talk shows and talk to fellow investors, trying to understand what’s next.
One popular stock market “indicator” is interest rates. Analysts parse every word from the Fed, hoping they hear a clue about interest rates. They assume that falling rates means higher stock prices, while rising rates means lower stocks.
But does the conventional wisdom about interest rates and stocks square with reality? Let’s do a brief historical review.
From October 1974 to December 1976, the stock market rose as the Fed funds rates trended lower. This occurred again from July 1984 to August 1987. Conversely, stock prices faltered as interest rates climbed from January 1973 to October 1974 and again from December 1976 to February 1978. So far, so good: rates up/stocks down, or vice versa.
But stock prices have also fallen as interest rates declined — more than once. Take a look at the chart below. The commentary is from the February 2010 Elliott Wave Theorist:
[The chart] shows a history of the four biggest stock market declines of the past hundred years. They display routs of 54% to 89%. In all these cases, interest rates fell, and in two of those cases they went all the way to zero!
The next chart shows you when stocks and interest rates trended higher together. You can see the Dow rise from March 2003 to October 2007 as rates climb from around 1% to over 5%.
Here’s the point: There is no consistent relationship between interest rates and the stock market.
That doesn’t mean volatility will be absent around the time of a Fed meeting. But, if that ever turns out to be the case, keep this in mind from a classic Elliott Wave Theorist:
The Fed’s decision will not cause any such volatility; it just may (or may not) coincide with it. Whether volatility continues around the Fed’s meeting is up to the markets, not the Fed… [The] Fed’s meeting, therefore, is not crucial, pivotal, historic or momentous. It is mostly irrelevant.
Investing is hard, but believing in the myth that interest rates have a big influence on the stock market makes it even harder. And, we have several more popular myths to dispel for you in our free report, Market Myths Exposed.
Did you know that the vast majority of portfolios are built on false assumptions? These false assumptions — or Market Myths — have been passed down across generations. They are so baked into investor psyche that no one ever thinks to challenge them… but we do. Do earnings really drive stock prices? Can the FDIC actually protect you? Is portfolio diversification a smart move? Download Market Myths Exposed now and find out whether your portfolio is built on flawed foundations. We guarantee you’ll be shocked to find the truth.
This article was syndicated by Elliott Wave International and was originally published under the headline Will the Fed’s Rate Hikes Choke the Stock Market Rally?. EWI is the world’s largest market forecasting firm. Its staff of full-time analysts led by Chartered Market Technician Robert Prechter provides 24-hour-a-day market analysis to institutional and private investors around the world.
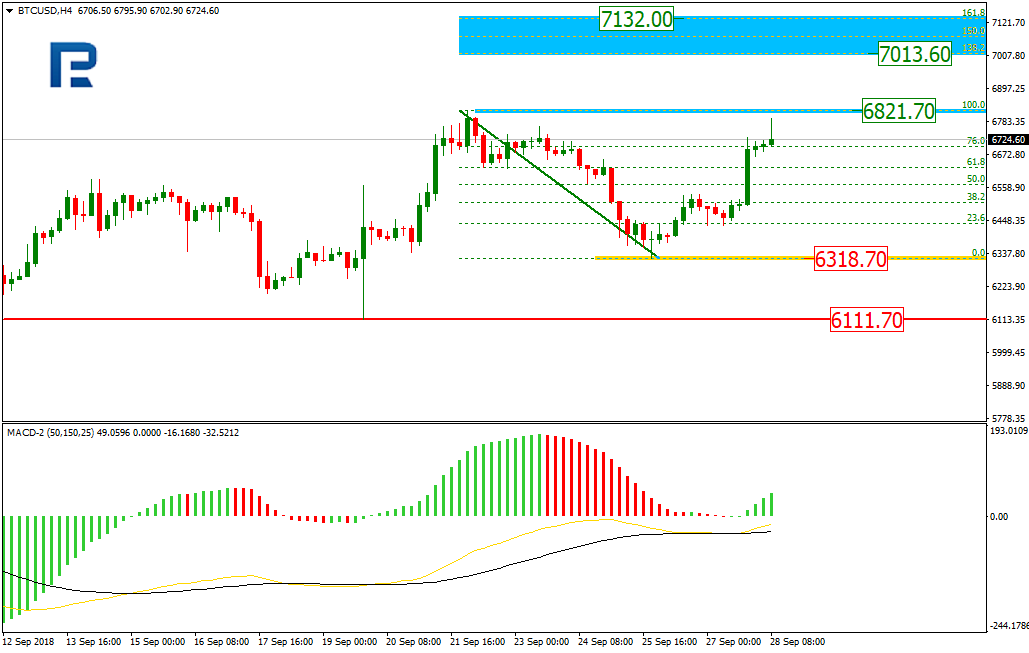
On H4, Bitcoin is moving going up. The crypto is approaching the local high at $6,821.70. In case it gets broken out, the price may well reach the post correctional extension between 138.2%-161.8% Fibo, or $7,013.60-$7,132.00. The support is meanwhile at the low, i.e. $6,318.70.
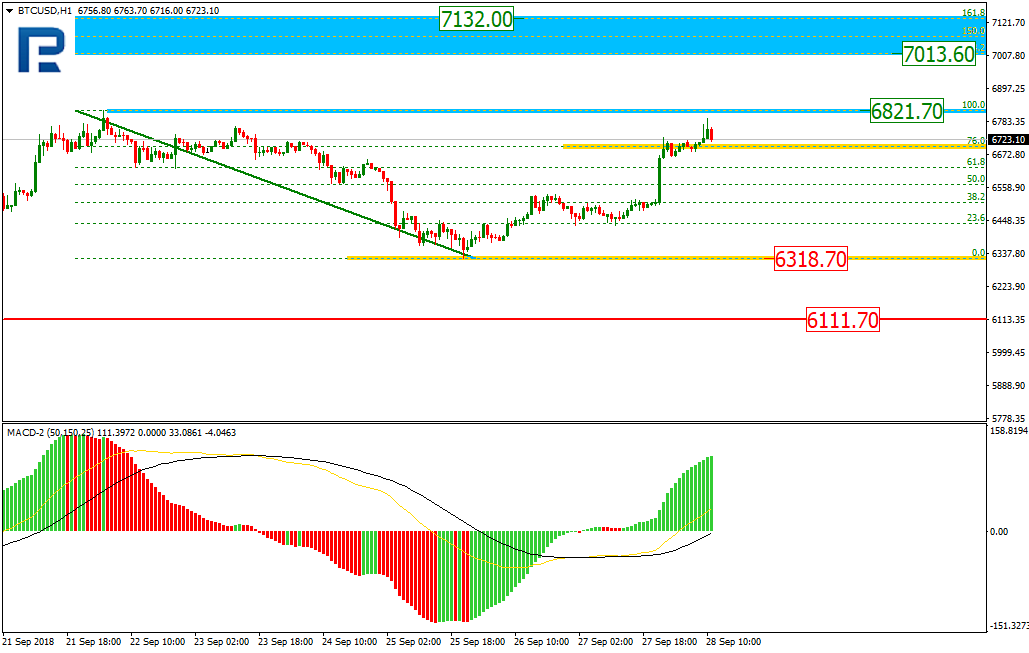
On H1, Bitcoin is trying to reach 6,821.70, but is likely to start pulling back in the short term.
Ethereum
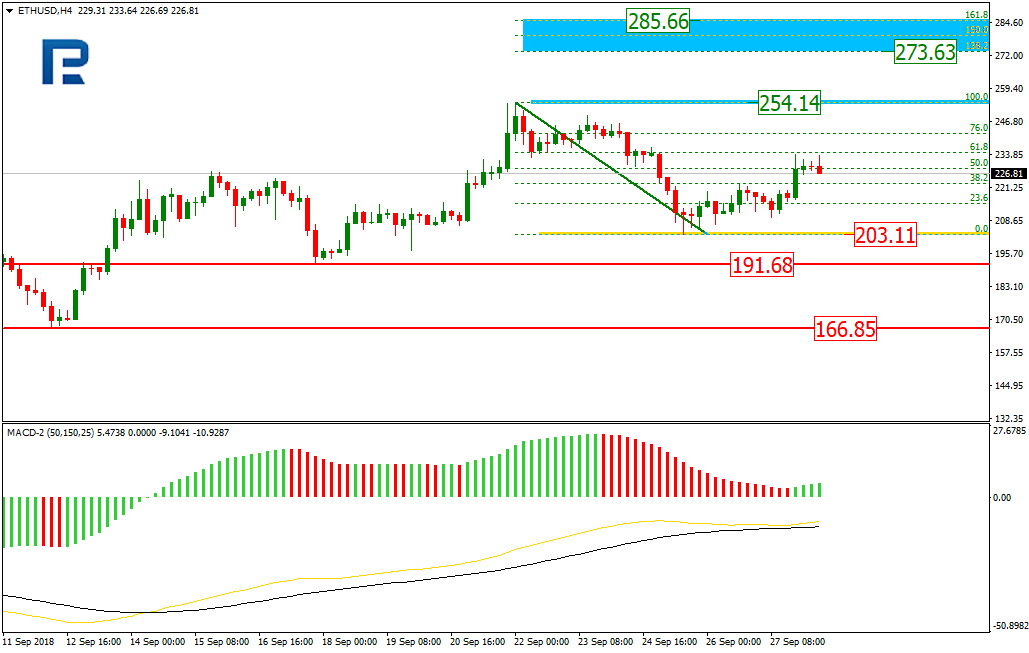
On H4, Ether is trying to rise after the previous downtrend. The target may be at $254.14. In case it gets broken out, the price may well reach the post correctional extension between 138.2%-161.8% Fibo, or $273.63-$285.66. Conversely, if the support at $203.11 gets hit, the prices may go to the fractal levels of $191.68 and $166.85.
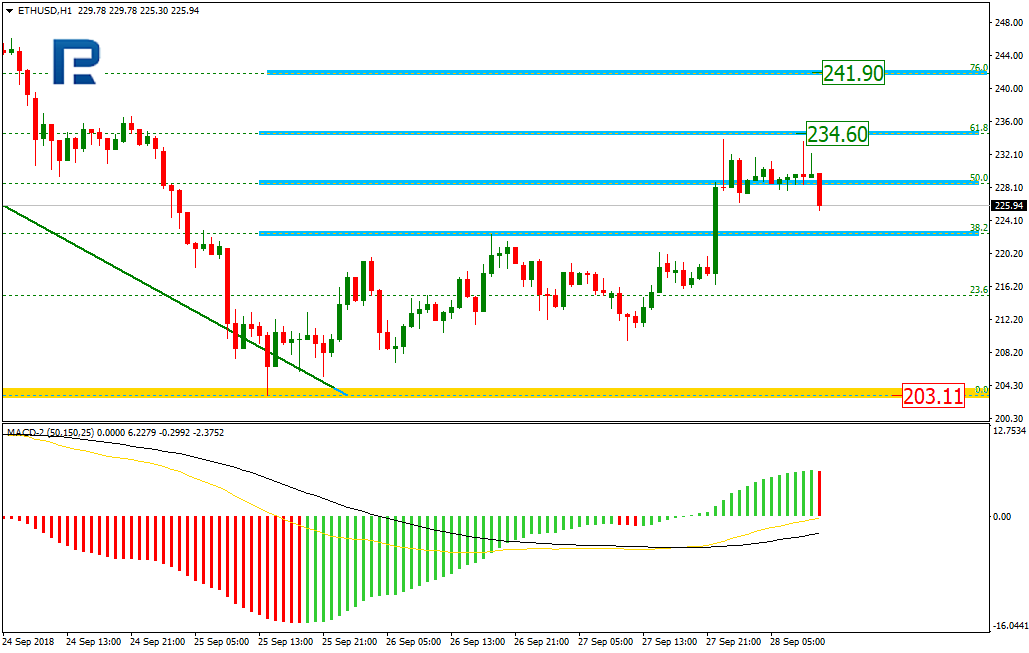
On H1, Ether is moving going up. The crypto is approaching to 61.8% Fibo ($234.60), with respect to the previous downtrend. The trend then may head towards 76%, or $241.90.
Attention! Forecasts presented in this section only reflect the author’s private opinion and should not be considered as guidance for trading. RoboForex LP bears no responsibility for trading results based on trading recommendations described in these analytical reviews.
The EUR/USD has done trading within the third downward wave and is now forming a consolidation pattern. If the price goes down, it may reach 1.1625; if it goes up, the correction towards 1.1679 may follow, and then a fall till 1.1625.
GBPUSD
The GBPUSD is continuing to trade within wave 5 (downmove), the target being at 1.3030. Today, it may start going up to 1.3115, and then get back to the downward wave again. Then, it may start correcting to 1.3166.
USDCHF
The USD against the franc is trading as if it were inside wave 3 going upwards. Today, it may start consolidating. If the price goes down, the correction towards 0.9700 may follow, if it goes up, the continuation towards 0.9858 is likely.
USDJPY
The dollar is inside the extended wave 3 against the yen; today, the pair may start consolidating near its highs. A downward breakout will push the price down to 112.00. If the price goes up, conversely, the continuation towards 114.10 is likely.
AUDUSD
The AUD/USD reached the third descending wave local target. Today, it may rise to 0.7232, and then a fall till 0.7160, which is going to be the first target.
USDRUB
The USD/RUB is still inside the consolidation range and is trading near its lows. If it goes up, the correction towards 66.80 may follow, at least. If the price goes down, it may reach 64.50.
GOLD
Gold has reached its downtrend target and may now start consolidating near its lows. If the price goes up, the rise towards 1195.00 may follow, while a converse breakout will push the price down to 1171.90.
BRENT
Brent crude is forming the consolidation pattern near its highs. This pattern may reach 83.10, and then, once a breakout occurs, go down further to 80.00.
Attention! Forecasts presented in this section only reflect the author’s private opinion and should not be considered as guidance for trading. RoboForex LP bears no responsibility for trading results based on trading recommendations described in these analytical reviews.