The Australian Dollar is getting “lighter” against the USD on Tuesday. The current quote for the instrument is 0.7186, which is the lowest over the last couple of weeks.
During its latest meeting, the Reserve Bank of Australia decided to keep the key rate intact at 1.5%. No one expected the rate to be revised, that’s why this news was no surprise for anybody.
In the comments, the RBA said that the current rate value was fine with the outlook for the inflation and economic growth, but at the same time, the regulator was expecting the employment and CPI readings to improve. The inflation is expected to grow rather slowly, the outlook for 2019 and 2020 are quite promising.
As for the Aussie, the RBA believes that the national currency is trading inside the range, which was formed over the last couple of years. There were no other comments and it was rather strange: earlier, the Australian regulator never missed an opportunity to say that the Australian Dollar was too expensive, thus being pretty risky to the entire economic system. Among external risks, the RBA mentioned the US trade policy, which is now providing a lot of uncertainty.
The Aussie would have probably “survived” this meeting of the regulator, if it hadn’t been for the USD, which has been “attacking on all fronts” for several consecutive trading sessions. In this light, the Australian currency is forced to retreat.
Attention! Forecasts presented in this section only reflect the author’s private opinion and should not be considered as guidance for trading. RoboForex LP bears no responsibility for trading results based on trading recommendations described in these analytical reviews.
Author: Dmitriy Gurkovskiy, Chief Analyst at RoboForex
On Tuesday afternoon, the Japanese Yen is rising against the USD and it seems that investors are showing a little bit of interest in “safe haven” assets for the first time in a long period. There are no reasons for stresses and massive sell-outs at the moment, but it can be clearly seen even now that investors’ interest in the Yen is growing.
It became known today that all major ministers of the Japanese government would stay on their positions. The Prime Minister of Japan Shinzō Abe said he would keep at least three politicians, who were involved in trade talks with the USA. Most likely, they are ministers for METI (Minister of Economy, Trade and Industry), Foreign Affairs, and Finance.
This is very important, because in the nearest future Japan will have to reach an agreement in trade talks with Washington in order to keep the economic balance: unlike China, which is very persistent in its resistance to the US trade aggression, Japan can’t afford to have such “trade wars”. It’s very essential for Japan to make the cars produced in the country available for export, because earlier both countries agreed on keeping duties on exports intact. However, the Japanese government understands that the Trump’s office may easily change their mind, that’s why Japan needs assurance that export duties on cars won’t be increased.
The statistics published today showed that the Consumer Confidence in Japan rose up to 43.4 points in September after being 43.3 points the month before and against the expected reading of 43.0 points. It’s a good signal: as a rule, the country’s population is very careful in estimating the economic outlook and everything that is happening in the Japanese economy.
The current demand for the Yen as a “safe haven” asset may be influenced by political aggression that comes from the White House.
After finishing the mid-term correction, USDJPY formed another impulse of the long-term uptrend. The H1 chart shows that the pair reached the resistance line of the mid-term ascending channel and rebounded from it. Apart from this, one can see that the price broke the support line of the short-term channel as well. Taken together, these factors indicate a correctional downtrend with the possible target near the support line of the mid-term channel at 113.15. After reaching it, the instrument may start forming a new rising wave with the targets close to the resistance levels at 114.20 and 114.85.
Disclaimer
Any predictions contained herein are based on the authors’ particular opinion. This analysis shall not be treated as trading advice. RoboForex shall not be held liable for the results of the trades arising from relying upon trading recommendations and reviews contained herein.
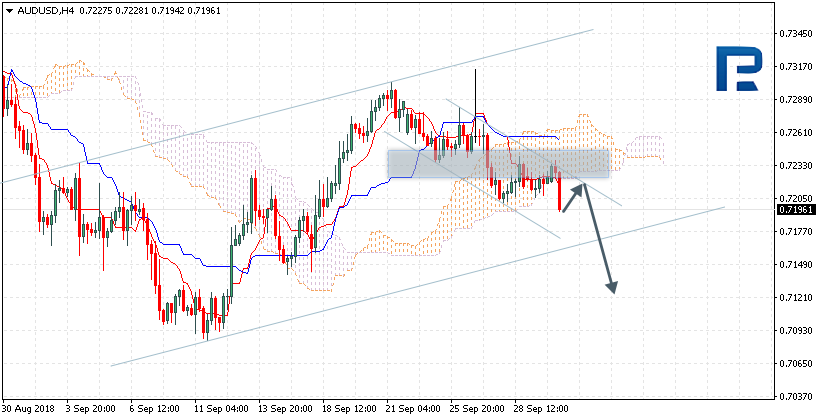
AUDUSD is trading at 0.7196; the instrument is moving below Ichimoku Cloud, thus indicating a descending tendency. The markets could indicate that the price may test the downside border of the cloud at 0.7215 and then resume moving downwards to reach 0.7125. Another signal to confirm further descending movement is the price’s rebounding from the channel’s upside border. However, the scenario that Implies further decline may be cancelled if the price breaks the upside border of the cloud and fixes above 0.7265. In this case, the pair may continue growing towards 0.7365. After breaking the channel’s downside border and fixing below 0.7160, the price may continue moving downwards.
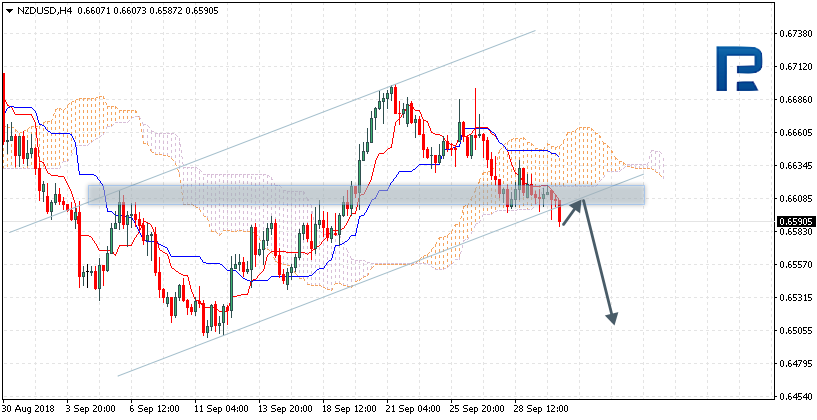
NZDUSD, “New Zealand Dollar vs US Dollar”
NZDUSD is trading at 0.6590; the instrument is moving below Ichimoku Cloud, thus indicating a descending tendency. The markets could indicate that the price may test the downside border of the cloud at 0.6610 and then resume moving downwards to reach 0.6505. Another signal to confirm further descending movement is the price’s rebounding from the resistance level. However, the scenario that Implies further decline may be cancelled if the price breaks the upside border of the cloud and fixes above 0.6650. In this case, the pair may continue growing towards 0.6735.
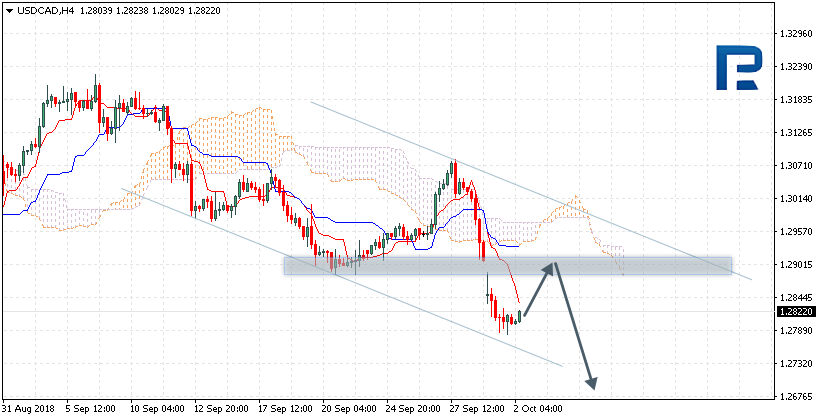
USDCAD, “US Dollar vs Canadian Dollar”
USDCAD is trading at 1.2822; the instrument is moving below Ichimoku Cloud, thus indicating a descending tendency. The markets could indicate that the price may test Tenkan-Sen and Kijun-Sen at 1.2905 and then continue moving downwards to reach 1.2675. Another signal to confirm further descending movement is the price’s rebounding from the resistance level. However, the scenario that implies further decline may be cancelled if the price breaks the upside border of the cloud and fixes above 1.3020. In this case, the pair may continue growing towards 1.3110.
Attention! Forecasts presented in this section only reflect the author’s private opinion and should not be considered as guidance for trading. RoboForex LP bears no responsibility for trading results based on trading recommendations described in these analytical reviews.
Sales are prevailing on the EUR/USD currency pair. Demand for the US currency is still high amid improvements in international trade. At the moment, the key support and resistance levels are: 1.15200 and 1.15700, respectively. We recommend opening positions from these marks. The EUR/USD currency pair has the potential for further decline.
The news feed on the economy of the Eurozone and the US is calm. We recommend paying attention to the speech by the Fed Chairman Powell.
Indicators point to the power of sellers: the price has fixed below 50 MA and 200 MA.
The MACD histogram is in the negative zone, below the signal line, which gives a strong signal to sell EUR/USD.
Stochastic Oscillator is in the oversold zone, the %K line is crossing the %D line. There are no accurate signals.
Trading recommendations
Support levels: 1.15200, 1.14800
Resistance levels: 1.15700, 1.16100, 1.16500
If the price fixes below the support level of 1.15200, the EUR/USD quotes are expected to fall. The movement is tending to 1.14800-1.14600.
Alternative option. If the price fixes above the already “mirror” resistance level of 1.15700, we recommend considering purchases. The target movement level is 1.16100-1.16500.
The GBP/USD currency pair
Technical indicators of the currency pair:
Prev Open: 1.30379
Open: 1.30423
% chg. over the last day: +0.03
Day’s range: 1.30254 – 1.30442
52 wk range: 1.2361 – 1.4345
Yesterday, there was a variety of trends on the GBP/USD currency pair. The British pound strengthened after it became known that the UK was ready to compromise in solving the problem with the Irish border. British Prime Minister Theresa May plans to sign an agreement on Brexit with the European Union. At the moment, quotes are declining. The key support and resistance levels are: 1.29850 and 1.30350, respectively. Positions should be opened from these marks.
At 11:30 (GMT+3:00) the index of economic activity in the UK construction sector will be published.
Indicators point to the power of sellers: the price has fixed below 50 MA and 200 MA.
The MACD histogram is in the negative zone, below the signal line, which gives a strong signal to sell GBP/USD.
The Stochastic Oscillator is in the oversold zone, the %K line is crossing the %D line. There are no accurate signals.
Trading recommendations
Support levels: 1.29850, 1.29500
Resistance levels: 1.30350, 1.30800, 1.31200
If the price fixes below the support level of 1.29850, a further drop in the GBP/USD quotes is expected. The movement is tending to 1.29500-1.29300.
An alternative may be the growth of the GBP/USD currency pair to the level of 1.30800-1.31000.
The USD/CAD currency pair
Technical indicators of the currency pair:
Prev Open: 1.28477
Open: 1.28095
% chg. over the last day: -0.19
Day’s range: 1.28198 – 1.28295
52 wk range: 1.2059 – 1.3795
At the moment, the USD/CAD currency pair has become stable after a sharp decline at the end of September. Quotes are in a sideways trend. Investors expect additional drivers. Key support and resistance levels are: 1.27850 and 1.28300, respectively. Positions should be opened from these marks. We recommend paying attention to the dynamics of oil prices.
Today, the publication of important economic reports from Canada is not planned.
Signals of the indicators are different: the price has fixed below 50 MA and 200 MA.
The MACD histogram is in the negative zone, but has started rising. There are no accurate signals.
Stochastic Oscillator is located near the overbought zone, the %K line is above the %D line, which indicates the USD/CAD quotes growth.
Trading recommendations
Support levels: 1.27850, 1.27500
Resistance levels: 1.28300, 1.28600, 1.29000
If the price fixes below 1.27850, we recommend looking for entry points to the market to open short positions. The target level for profit taking is 1.27500-1.27300.
Alternative option. If the price fixes above the resistance level of 1.28300, correction of the USD/CAD quotes is expected. The movement is tending to 1.28600-1.29000.
The USD/JPY currency pair
Technical indicators of the currency pair:
Prev Open: 113.703
Open: 113.875
% chg. over the last day: +0.13
Day’s range: 113.686 – 113.775
52 wk range: 104.56 – 114.74
Yesterday, the USD/JPY currency pair kept the round level of 114.000. At the moment, the technical pattern is ambiguous. The trading instrument is testing local support of 113.700. In the near future, correction of the USD/JPY quotes is not excluded after a prolonged rally. Positions should be opened from the key levels. We recommend paying attention to the US government bonds yield.
The news feed on the economy of Japan is calm.
Indicators do not send accurate signals: the price has crossed 50 MA.
The MACD histogram is located near the 0 mark.
Stochastic Oscillator is near the oversold zone, the %K line is below the %D line, which indicates the bearish sentiment.
Trading recommendations
Support levels: 113.700, 113.450, 113.300
Resistance levels: 114.000
If the price fixes below the local support of 113.700, correction of the USD/JPY currency pair is expected. The movement is tending to 113.450-113.300.
An alternative may be the further growth of the USD/JPY quotes to the level of 114.000-114.250.
Our focus is on developing and deploying very specialized price modeling and predictive analysis systems. Our objective is to inform our members of these potential price moves and to assist them in finding successful trading opportunities. We are alerting all of our followers of a potential move today, because we believe this move could frighten some investors as we expect price rotation as Q3 earnings data is released just before the November 2018 mid-term elections.
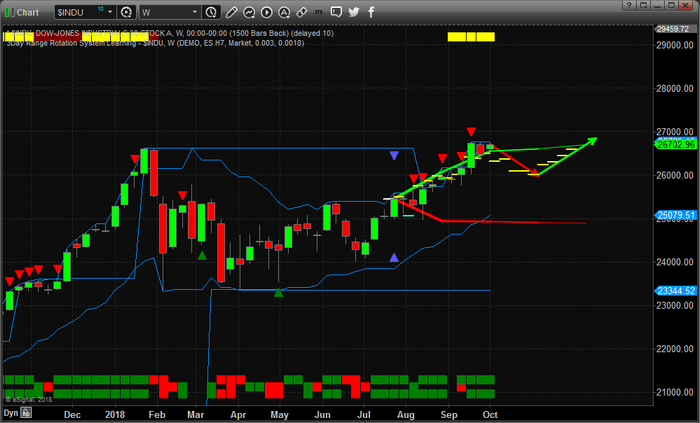
The weekly $INDU (Dow Industrial Average) chart shows our Adaptive Predictive Learning (ADL) modeling system at work. In this example, we asked our ADL system what it believed would be the most likely outcome originating from July 23, 2018. The reason we selected this date is because this weekly price bar prompted the current upside price move. This type of price trigger can often generate highly accurate future predictive price data. This bar consisted of 11 unique price markers that predict future price moves, first lower, then back to the upside, with a range of probability from 83% to 96%. The initial downside price move suggests that an initial -800 to -1000 pt move (-4%) will take place before November 10, 2018. Subsequently, price should begin to move upward again after the US mid-term elections and through the end of 2018.
In conclusion, October is known as a weak month for US equities so get ready for price volatility and expect the Tech-heavy NASDAQ to rotate in a larger range than the S&P and the $INDU. Additionally, expect the VIX to increase in value over the next 30+ days as October passes.
I will admit the charts in July/Early September were showing signs of a market correction in mind September but no bearish reversal pattern formed and price continued higher. During this time we closed out a position in YINN for 14% profit and another 4.3% in the IYT ETF. This goes to show how we can profit to the long side even when we are expecting a sell off the markets. We trade based on technical analysis and use our ADL and other forecasting analysis to add more conviction to a move, but we don’t trade based on predictions along.
If you want to know how we help our members find and execute for greater success, visit www.TheTechnicalTraders.com to see our completed trades for this year and learn how we can help you find great opportunities now and in the future.
The US currency strengthened against the basket of major currencies. The US dollar index (#DX) has reached a maximum in 2 weeks and closed in the positive zone (+0.20%). The US dollar is supported by improved US trade relations with international partners. So, last week a “friendly conversation” between the US President Donald Trump and the President of Turkey Recep Tayyip Erdogan, who participated in the annual meeting of the United Nations General Assembly, took place. It seems that relations between countries are getting better. Also, Donald Trump assesses the new agreement with Mexico and Canada as the best and most beneficial in the US history.
The British pound strengthened after it became known that the UK was ready to compromise in solving the problem with the Irish border. British Prime Minister Theresa May plans to sign an agreement on Brexit with the European Union. Britain intends to fully participate in the customs union with the EU. At the moment, the US dollar has recovered all the losses.
Today, during the Asian trading session, the decision on the interest rate of the Reserve Bank of Australia has been published. The indicator remained at the same level of 1.50%, as investors expected.
The “black gold” prices show positive dynamics. At the moment, futures for the WTI crude oil are testing a mark of $75.75 per barrel. At 23:30 (GMT+3:00) API weekly crude oil stock will be published.
Market Indicators
Yesterday, the bullish sentiment was observed in the US stock market: #SPY (+0.35%), #DIA (+0.88%), #QQQ (+0.20%).
At the moment, the 10-year US government bonds yield is at the level of 3.06-3.07%.
The news feed on 2018.10.02:
– The index of economic activity in the UK construction sector at 11:30 (GMT+3:00).
We also recommend paying attention to the speech by the Fed Chairman Powell.
On Monday the 1st of October, trading on the euro closed down. The rate rose to 1.1625 during the European session before dropping to 1.1564 in the US. I found the market’s behaviour confusing yesterday given that the euro dropped against the dollar on the back of positive news concerning Brexit, a rise in oil prices, and a drop in US10Y bond yields.
Brent oil rose to 85.30 USD per barrel, which provided support to commodity currencies. The USDCAD currency pair dropped to 1.2782. The loonie rose as the euro took a dive. Moreover, this all happened against the backdrop of a decline in US10Y bond yields.
Aside from oil, the loonie was also propped up by Canada agreeing to a new three-way free trade deal called the USMCA (US-Mexico-Canada Agreement).
September’s ISM manufacturing PMI disappointed markets. The report came out lower than the previous value, and lower than the forecasted value. The release of this PMI data stopped the US dollar’s rise in its tracks, but now it’s back on the attack.
Day’s news (GMT+3):
11:30 UK: PMI construction (Sep).
12:00 Eurozone: PPI (Aug).
19:45 US: Fed’s Powell speech.
Fig 1. EURUSD hourly chart.
Current situation:
During Monday’s European session, the euro rose to 1.1625, missing out on my target of 1.1650. It then dropped from the LB balance line to 1.1563. I had predicted a recovery for the euro to 1.1618, but the bears scuppered this, pushing the rate down to 1.1547.
The pair has exited the channel. I’m not considering a decline today given that the hourly cycles and patterns show the euro strengthening. Add to this my confusion over the euro’s decline yesterday and I can say that for me, the market situation is ambiguous.
If we take a look at the daily timeframe, the 1.1525 low from the 10th of September catches the eye, as this has the potential to stop the euro’s decline against the greenback. If the bears break through the 1.1525 – 1.1535 zone, then we’ll see a further decline to 1.1470.
FOMO (the Fear Of Missing Out) will drive the price of Bitcoin and other cryptocurrencies higher before the end of the year, affirms the CEO of one of the world’s largest independent financial advisory organizations.
The observation from Nigel Green, founder and chief executive of deVere Group, comes ahead of his address this week at the DELTA Summit, Malta’s official blockchain and digital event.
He notes: “It’s a real honour to be in the line-up at this prestigious summit alongside not only the Prime Minister of Malta, Joseph Muscat, who is a prominent advocate of cryptocurrencies, but also some of the highest-profile and most influential figureheads in the fintech, blockchain, cryptocurrencies and digital sectors.
“Thanks to the progressive, forward-thinking and truly ground-breaking approach of the Maltese government regarding blockchain and digital currency regulation and legislation, Malta has positioned itself to be a global leader in these ever-expanding markets.”
He continues: “I have long shared the view stated by Prime Minister Muscat at the UN General Assembly over the weekend that cryptocurrencies are the ‘inevitable future of money,’ and I welcome his public championing of this increasingly vital sector.
“It promises to be a landmark event that not only celebrates and galvanizes Malta’s position as a pioneering blockchain and cryptocurrency country, but one that celebrates the sector itself.”
Mr Green goes on to say that: “Bitcoin and other cryptocurrencies are, I believe, on the verge of a true global breakout. This is largely due to ‘FOMO’, the fear of missing out.
“Adoption is increasing all the time. This is evidenced not only in the financial sector, in which major banks are increasingly looking at blockchain and crypto, but with big names within the tech and retail sectors too.
“I feel that there’s a growing sense amongst institutions that unless they embrace this sector, their competitors could move way out in front and they might find it difficult to catch up. This is especially true as the public – their customers – are increasingly eager to explore the opportunities themselves.”
Mr Green concludes: “I’m not sure we’ll see the stratospheric rise in cryptocurrency prices that we experienced at the end of 2017. However, with growing acceptance that that they are indeed the future of money, I believe that the environment is now right for an upswing before year-end.”
About:
deVere Group is one of the world’s largest independent advisors of specialist global financial solutions to international, local mass affluent, and high-net-worth clients. It has a network of more than 70 offices across the world, over 80,000 clients and $12bn under advisement.
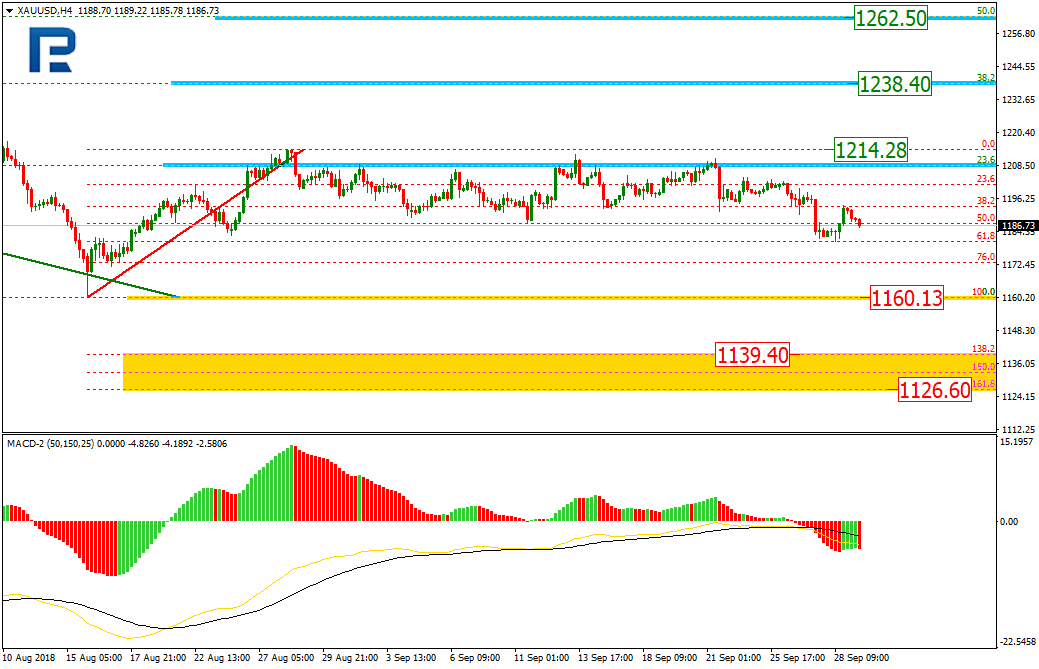
As we can see in the H4 chart, XAUUSD is trying to stop its correctional sideways movement and resume falling. If the price breaks the short-term low at 1160.13, the pair may move downwards to reach the post-correctional extension area between the retracements of 138.2% and 161.8% at 1139.40 and 1126.60 respectively. However, if the instrument breaks the high at 1214.28, the price may continue trading upwards to reach the retracements of 38.2% and 50.0% at 1238.40 and 1262.50 respectively.
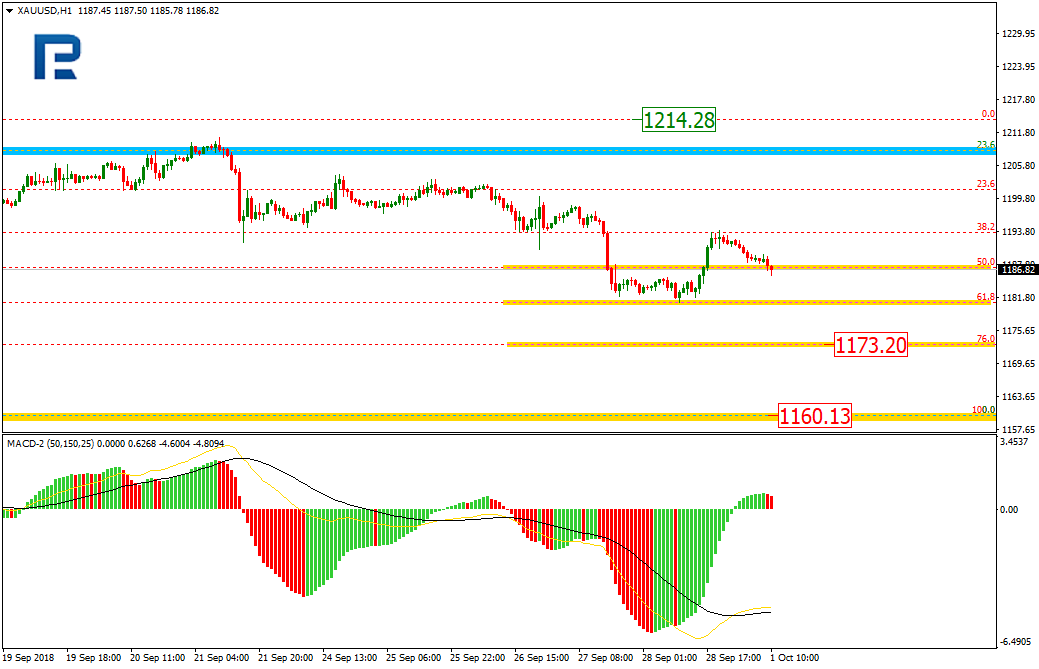
In the H1 chart, the pair is forming a new descending impulse. The next target is the retracement of 76.0% at 1173.20.
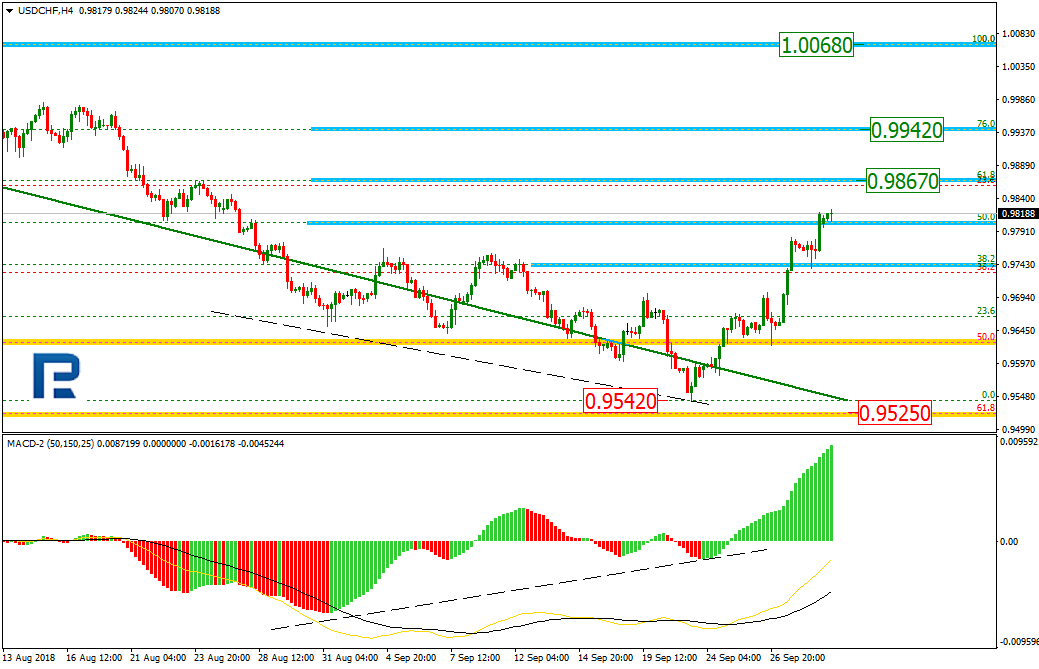
USDCHF, “US Dollar vs Swiss Franc”
As we can see in the H4 chart, the USDCHF completed the downtrend at the retracement of 61.8% at 0.9525 and then started a new uptrend, which has already reached the retracement of 50.0%. The next upside targets may be the retracements of 61.8% and 76.0% at 0.9867 and 0.9942 respectively. The support level is the low at 0.9542.
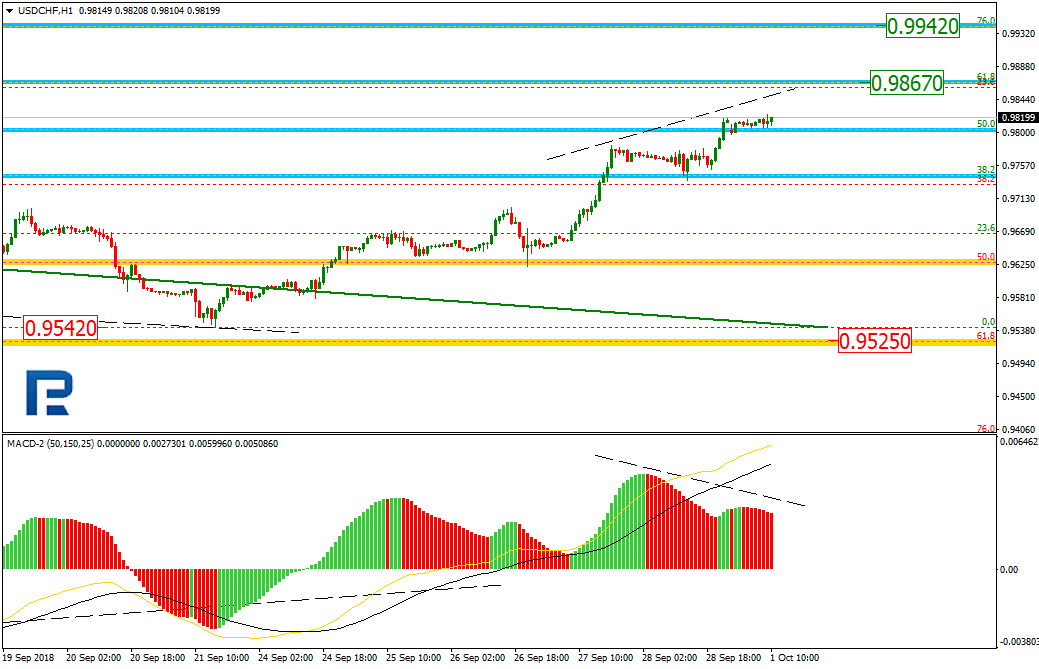
In the H1 chart, the pair is trading upwards to reach the retracement of 61.8% at 0.9867. At the same time, the divergence is being formed, which may indicate a new pullback after the instrument reaches its upside targets.
Attention! Forecasts presented in this section only reflect the author’s private opinion and should not be considered as guidance for trading. RoboForex LP bears no responsibility for trading results based on trading recommendations described in these analytical reviews.
Last week finished great for USD, which should have been bad for commodities in theory, although oil buyers didn’t seem bothered about this at all. This situation changes dramatically, however, when we look at gold. Precious metals are definitely feeling the rising demand for the US dollar. The situation on the XAUUSD instrument is far from optimistic.
On gold, we finally have a legitimate trading signal. For the past few weeks, since the 24th of August to be precise, the XAUUSD has been locked in a sideways trend. This formed a pennant (black lines), which dramatically decreased volatility. A lack of bullish momentum exposed the weakness in the buyers’ camp. That resulted in a downside breakout, which brought us a technical sell signal. At the end of the week, gold tried a reversal, but that was just a technical pull-back which tested the recent support as a resistance. This is a typical movement, which can serve as an opportunity to jump into the trade for those who missed the initial drop.
The sell signal is on as long as we stay below the green line. Do not forget that on gold, we are very close to the long-term upwards trend line (10 years). A breakout of such an important support could have catastrophic consequences. That is one of the reasons why we had such a strong upswing in the middle of August. Buyers have to defend it at all costs.