Author Archive for InvestMacro – Page 351

The 10-year US Government Bonds Yield Has Updated a Maximum in 7 Years

by JustForex

The US dollar strengthened against a basket of major currencies during yesterday’s trading session. The US dollar index (#DX) closed in the positive zone (+0.28%). The American currency was supported by a record increase in the 10-year US government bonds yield. Yesterday, the indicator rose by 3 basis points and exceeded 3.2% for the first time since 2011.

Positive economic statistics from the United States provided additional support for the US currency. According to ADP, the number of people employed in the nonfarm sector rose to 230K in September, while experts expected 187K. The ISM non-manufacturing employment index grew from 58.5 to 61.6 in September. Also, the positive statements by the Fed representatives contributed to the increase in the 10-year US government bonds yield. Chicago Fed President Charles Evans said that the US economy reached such growth rates that the Fed would be forced “to step back from the aggressive stance”.

The “black gold” prices are consolidating. At the moment, futures for the WTI crude oil are testing a mark of $76.25 per barrel.

Market Indicators

Yesterday, the bullish sentiment was observed in the US stock market: #SPY (+0.05%), #DIA (+0.14%), #QQQ (+0.11%).

At the moment, the 10-year US government bonds yield is at 3.20-3.21%.

The news feed on 2018.10.04:

– Initial jobless claims in the US at 15:30 (GMT+3:00);
– The index of economic activity in Canada at 17:00 (GMT+3:00).

by JustForex

EURUSD: approaching the daily trend line

By Gabriel Ojimadu, Alpari

Previous:

On Wednesday the 3rd of October, trading on the euro closed down. The single currency dropped to 1.1560 during the European session, before dropping further to 1.1465 in the US. This decline was brought about by positive US data as well as significant growth in US10Y bond yields.

The ADP employment report and services PMI data both exceeded market expectations. US bond yields rose to 3.17% before jumping further to 3.21% in Asia. I’m not ruling out the possibility that bond yields rose in response to Fed Chair Jerome Powell’s speech, because they didn’t react to the economic data. Powell said that the central bank was still far away from having a neutral rate, thereby hinting at a tight monetary policy in 2019.

According to Automatic Data Processing (ADP), 230k new private sector jobs were created in September (forecast: +185k, previous reading revised from 163k to 168k).

The ISM non-manufacturing PMI for September grew to 61.6 points, up from 58.6 in August.

Day’s news (GMT+3):

  • 15:30 US: initial jobless claims (28 Sep).
  • 16:15 US: Fed’s Quarles speech.
  • 17:00 Canada: Ivey PMI (Sep).
  • 17:00 US: factory orders (Aug).

Fig 1. EURUSD daily chart.

Current situation:

My sense of the market has been off point this week. When I don’t understand something, I don’t make predictions. Given that market prices are swinging in all directions on the statements of officials, today I’ve uploaded the daily chart for our pair. We can clearly see that the bears are pushing towards the lower line of the A-A channel. Today’s bar runs through 1.1450, and the trend line through 1.1390. If the euro continues its decline against the greenback at this pace, the pair should reach the trend line (TR from 1.0340) at around 1.14. The correction on the growth from 1.1301 to 1.1815 has passed the 61.8% Fibonacci level. The 76.4% Fibo is at 1.1420 (around the trend line). We can expect a rebound from there.

Forex Technical Analysis & Forecast 03.10.2018 (EURUSD, GBPUSD, USDCHF, USDJPY, AUDUSD, USDRUB, GOLD, BRENT)

Article By RoboForex.com

EURUSD, “Euro vs US Dollar”

EURUSD has finished another ascending structure. Possibly, today the pair may fall to reach 1.1548 and form a new consolidation range. If the instrument breaks this range to the downside, the price may resume falling towards 1.1483; if to the upside – continue the correction to reach 1.1650.

EURUSD
Risk Warning: the result of previous trading operations do not guarantee the same results in the future


GBPUSD, “Great Britain Pound vs US Dollar”

GBPUSD has completed another descending structure and right now is being corrected. Today, the pair may test 1.3011 from below and then resume trading inside the downtrend with the target at 1.2907.

GBPUSD
Risk Warning: the result of previous trading operations do not guarantee the same results in the future


USDCHF, “US Dollar vs Swiss Franc”

USDCHF is still consolidating. If the instrument breaks this range to the upside, the price may resume growing to reach 0.9930; if to the downside – start a new correction towards 0.9790 and then resume trading upwards.

USDCHF
Risk Warning: the result of previous trading operations do not guarantee the same results in the future


USDJPY, “US Dollar vs Japanese Yen”

USDJPY has finished the descending impulse along with the correction. Possibly, today the pair may fall towards 113.42, break it, and then continue trading inside the downtrend with the short-term target at 112.98.

USDJPY
Risk Warning: the result of previous trading operations do not guarantee the same results in the future


AUDUSD, “Australian Dollar vs US Dollar”

AUDUSD is forming the fifth descending structure to reach 0.7155. Later, the market may start another correction towards 0.7234.

AUDUSD
Risk Warning: the result of previous trading operations do not guarantee the same results in the future


USDRUB, “US Dollar vs Russian Ruble”

USDRUB has formed another consolidation range; right now, it is trading to rebound from the center to the downside. Possibly, today the pair may reach 64.50. If the price breaks the upside border, the instrument may be corrected with the target at 66.15.

USDRUB
Risk Warning: the result of previous trading operations do not guarantee the same results in the future


XAUUSD, “Gold vs US Dollar”

Gold has completed the fourth structure. Possibly, the pair may form a new consolidation range near the highs. After that, the instrument may break it downwards and start a new descending wave with the first target at 1194.00.

GOLD
Risk Warning: the result of previous trading operations do not guarantee the same results in the future


BRENT

Brent is consolidating close to the highs. Today, the pair may expand the range towards 85.90 and then fall to reach 84.54. If the instrument breaks this range to the upside, the price may grow to reach 87.60; if to the downside – start another decline with the target at 83.20.

BRENT
Risk Warning: the result of previous trading operations do not guarantee the same results in the future

Article By RoboForex.com

Attention!
Forecasts presented in this section only reflect the author’s private opinion and should not be considered as guidance for trading. RoboForex LP bears no responsibility for trading results based on trading recommendations described in these analytical reviews.

Japanese Candlesticks Analysis 03.10.2018 (GOLD, NZDUSD)

Article By RoboForex.com

XAUUSD, “Gold vs US Dollar”

As we can see in the H4 chart, XAUUSD has reached the resistance level and formed several Shooting Star reversal patterns there. Judging by the previous movements, it may be assumed that the price may form another the pullback from the resistance level and then continue its ascending movement.

GOLD
Risk Warning: the result of previous trading operations do not guarantee the same results in the future


NZDUSD, “New Zealand vs. US Dollar”

As we can see in the H4 chart, NZDUSD is still being corrected and forming Harami, Hammer, and Inverted Hammer reversal patterns. Right now, the price is testing the support level. Judging by the previous movements, it may be assumed that the instrument may complete the pullback and then start a new growth.

NZDUSD
Risk Warning: the result of previous trading operations do not guarantee the same results in the future

Article By RoboForex.com

Attention!
Forecasts presented in this section only reflect the author’s private opinion and should not be considered as guidance for trading. RoboForex LP bears no responsibility for trading results based on trading recommendations described in these analytical reviews.

The Analytical Overview of the Main Currency Pairs on 2018.10.03

Analytics by JustForex

The EUR/USD currency pair

Technical indicators of the currency pair:
  • Prev Open: 1.15791
  • Open: 1.15457
  • % chg. over the last day: -0.23
  • Day’s range: 1.15752 – 1.15842
  • 52 wk range: 1.0571 – 1.2557

During yesterday’s trading session, sales prevailed on the EUR/USD currency pair. The euro weakened against a basket of currencies due to resumed concerns about the Italian budget. Today, quotes have started recovering. At the moment, the key support and resistance levels are: 1.15600 and 1.16000, respectively. We recommend opening positions from these marks.

The news feed on 2018.10.03:
  • – ADP nonfarm employment change in the US at 15:15 (GMT+3:00);
  • – ISM non-manufacturing business activity in the US at 17:00 (GMT+3:00).

We also recommend paying attention to the speech by the Fed Chairman Powell.

EUR/USD

Indicators do not send accurate signals: the price has fixed between 50 MA and 200 MA.

The MACD histogram has moved to the positive zone, which gives a signal to buy EUR/USD.

Stochastic Oscillator is in the neutral zone, the %K line has crossed the %D line. There are no accurate signals.

Trading recommendations
  • Support levels: 1.15600, 1.15200
  • Resistance levels: 1.16000, 1.16400, 1.16800

If the price fixes below the support level of 1.15600, a further drop in the EUR/USD quotes is expected. The movement is tending to 1.15200-1.15000.

Alternative option. If the price fixes above the round level of 1.16000, we recommend considering purchases. The target movement level is 1.16400-1.16800.

The GBP/USD currency pair

Technical indicators of the currency pair:
  • Prev Open: 1.30423
  • Open: 1.29770
  • % chg. over the last day: -0.49
  • Day’s range: 1.29972 – 1.30082
  • 52 wk range: 1.2361 – 1.4345

Yesterday, the bearish sentiment was observed on the GBP/USD currency pair. In September, the index of economic activity in the UK construction sector fell from 52.9 to 52.1. Today, the correction of the quotes is observed. At the moment, the key support and resistance levels are: 1.29700 and 1.30200, respectively. Positions should be opened from these marks. Investors expect additional drivers.

At 11:30 (GMT+3:00) the index of economic activity in the UK services sector will be published.

GBP/USD

Indicators do not send accurate signals. The price is testing 50 MA.

The MACD histogram is near the 0 mark.

Stochastic Oscillator is located near the overbought zone, the %K line has crossed the %D line. There are no accurate signals.

Trading recommendations
  • Support levels: 1.29700, 1.29400, 1.29000
  • Resistance levels: 1.30200, 1.30700, 1.31200

If the price fixes below the support level of 1.29700, a further drop in the GBP/USD quotes is expected. The movement is tending to 1.29400-1.29000.

An alternative may be the growth of the GBP/USD currency pair to the level of 1.30700-1.31000.

The USD/CAD currency pair

Technical indicators of the currency pair:
  • Prev Open: 1.28095
  • Open: 1.28233
  • % chg. over the last day: +0.06
  • Day’s range: 1.28215 – 1.28322
  • 52 wk range: 1.2059 – 1.3795

At the moment, the technical pattern on the USD/CAD currency pair is ambiguous. Quotes are in a sideways trend. Investors assess a new trade agreement (USMCA) between the United States, Mexico and Canada. The key support and resistance levels are: 1.28100 and 1.28500, respectively. Positions should be opened from these marks. In the near future, correction of the USD/CAD quotes is not excluded.

Today, the publication of important economic reports from Canada is not planned.

USD/CAD

Indicators do not send accurate signals: the price has crossed 50 MA.

The MACD histogram is near the 0 mark.

The Stochastic Oscillator is in the neutral zone, the %K line is above the %D line, which indicates the growth of the USD/CAD quotes.

Trading recommendations
  • Support levels: 1.28100, 1.27750
  • Resistance levels: 1.28500, 1.29000, 1.29500

If the price fixes below 1.28100, we recommend looking for entry points to the market to open short positions. The target level for profit taking is 1.27750-1.27500.

Alternative option. If the price fixes above the resistance level of 1.28500, correction of the USD/CAD quotes is expected. The movement is tending to 1.29000-1.29200.

The USD/JPY currency pair

Technical indicators of the currency pair:
  • Prev Open: 113.875
  • Open: 113.632
  • % chg. over the last day: -0.32
  • Day’s range: 113.875 – 113.882
  • 52 wk range: 104.56 – 114.74

There is a variety of trends on the USD/JPY currency pair. Financial market participants expect additional drivers. At the moment, the key support and resistance levels are: 113.700 and 114.000, respectively. In the near future technical correction is not excluded. We recommend paying attention to the US government bonds yield, as well as to the news feed from the United States.

The news feed on the economy of Japan is calm.

USD/JPY

Indicators do not send accurate signals: the price has crossed 50 MA.

The MACD histogram is located near the 0 mark.

Stochastic Oscillator is located near the overbought zone, the %K line is above the %D line, which gives a weak signal to buy USD/JPY.

Trading recommendations
  • Support levels: 113.700, 113.450, 113.300
  • Resistance levels: 114.000, 114.500

If the price fixes below the support level of 113.700, correction of the USD/JPY currency pair is expected. The movement is tending to 113.400-113.200.

An alternative may be a further growth of the USD/JPY quotes to the level of 114.200-114.400.

Analytics by JustForex

The US Dollar Index Has Updated Two-Week High

by JustForex

Demand for the US currency is still high after the conclusion of a deal between the United States, Mexico and Canada. Yesterday, the US dollar index (#DX) updated its two-week high and closed in the positive zone (+0.22%). Meanwhile, the US dollar slightly weakened against the Japanese yen. This movement is caused mostly by technical factors. Today, participants have taken a wait-and-see attitude before publication of the important economic reports from the United States.

The euro weakened against a basket of currencies due to resumed concerns about the Italian budget. Yesterday, Deputy Prime Minister of Italy, Luigi Di Maio, said that the government did not intend to deviate from its stated goals for government expenditures, which implied a budget deficit of 2.4% of GDP. However, this indicator significantly exceeds the limit value set by the European Union.

The “black gold” prices are consolidating. At the moment, futures for the WTI crude oil are testing a mark of $75.35 per barrel. At 17:30 (GMT+3:00), a report on the US crude oil inventories will be published.

Market Indicators

Yesterday, there was a variety of trends in the US stock market: #SPY (-0.06%), #DIA (+0.31%), #QQQ (-0.23%).

At the moment, the 10-year US government bonds yield is at the level of 3.06-3.07%.

The news feed on 2018.10.03:

– The index of economic activity in the UK services sector at 11:30 (GMT+3:00);
– ADP nonfarm employment change in the US at 15:15 (GMT+3:00);
– ISM non-manufacturing business activity in the US at 17:00 (GMT+3:00).

We also recommend paying attention to the speech by the Fed Chairman Powell.

by JustForex

How to keep the Philippine economic future on track

By Dan Steinbock

The Philippines is on the right path, if the government can continue to balance between strong growth amid international uncertainty, while pushing reforms that raise living standards. Inflation and foreign investment tell the story.

According to the just-released report by the International Monetary Fund (IMF), Philippine real GDP grew by 6.7% in 2017 and by 6.3% in the first half of 2018 on a year-to-year basis, led by strong public investment.

The current challenge is inflation, which rose to 6.4% in August 2018. That’s an average of 4.8% percent year to date, which is above the inflation target band of 2−4%.

The medium-term challenge is the infrastructure program, particularly foreign investment which supports investment growth – and which has taken off dramatically in the Duterte era.

The forces behind inflation

Self-induced policy mistakes play a role in higher-than-expected inflation. The IMF attributes more than half of Philippine inflation to price increases in food, beverages and tobacco, particularly rice.

The National Food Authority administrator resigned a month ago after failures to purchase enough rice grains from local farms to stave off the need to import. The IMF supports the Philippine policymakers’ plan to replace the rice import quota system with one based on tariffs, while stressing the need to support small farmers affected by the reform.

As monetary policy has been accommodative, inflation has been driven by adjustments in excise taxes, rising oil prices, the weaker peso, and above-trend growth. That’s why Bangko Sentral raised its benchmark interest by half a percentage point last week. Inflation remains the top concern of Filipinos, as evidenced by the recent Pulse Asia survey.

The effort to curb inflation must remain elevated, however, because inflation may remain a challenge in the foreseeable future. First, while real GDP growth is projected at almost 7% over the medium term, inflation has also been projected at above the 4% upper target bound in 2018 and around 3−4% during 2019–20. Recent monthly figures exceeded the target bound by margin that’s too wide. Second, in normal times, mild discrepancies could be tolerated. But these are no normal times, as evidenced by the Fed’s rate hikes, strengthening dollar and escalating trade wars.

That’s also why Philippines is not alone in this battle. In my last column, I showed how the U.S. rate hikes and the dollar have penalized emerging Asian currencies causing significant damage in Asia’s most rapidly-growing economies, including India, Indonesia and the Philippines.

That’s why Indonesia’s central bank raised its policy rate to 5.75% last Thursday. The Bangko Sentral has raised rates by 150 basis points since May, which is its most aggressive tightening since 2000. Indonesia’s rate hikes this year also amount to 1.50 percentage points. India’s central bank has already raised its rate to 6.5% and is expected to hike ratesates for the third time in October.

The difference of capital flows in Aquino and Duterte eras

Following surpluses before 2016, the current account deficit widened to 0.8% of GDP in 2017, driven mainly by imports of capital goods, oil and raw materials, reflecting strong investment growth. According to the IMF, the Philippine current account deficit is projected to remain manageable. In this view, Philippine output would stay above potential in 2018-20, even though the current account deficit may widen to 1.5% of GDP in 2018 driven by a continued rise of capital goods imports, mostly financed by foreign direct investment (FDI).

Here’s the difference between the Aquino and Duterte governments: In the Aquino era, early optimism and promises to change the FDI legislation paced an increase of capital flows in the early 2010s. But these flows represented mainly portfolio and other investments, not foreign investment. Eventually, these capital inflows reversed into significant outflows. In the Duterte era, early optimism and promises to bring in more FDI have paced a dramatic increase of capital flows, which could be sustained until early 2020s (Figure).

Figure Great Difference: Capital flows in Aquino and Duterte Eras*

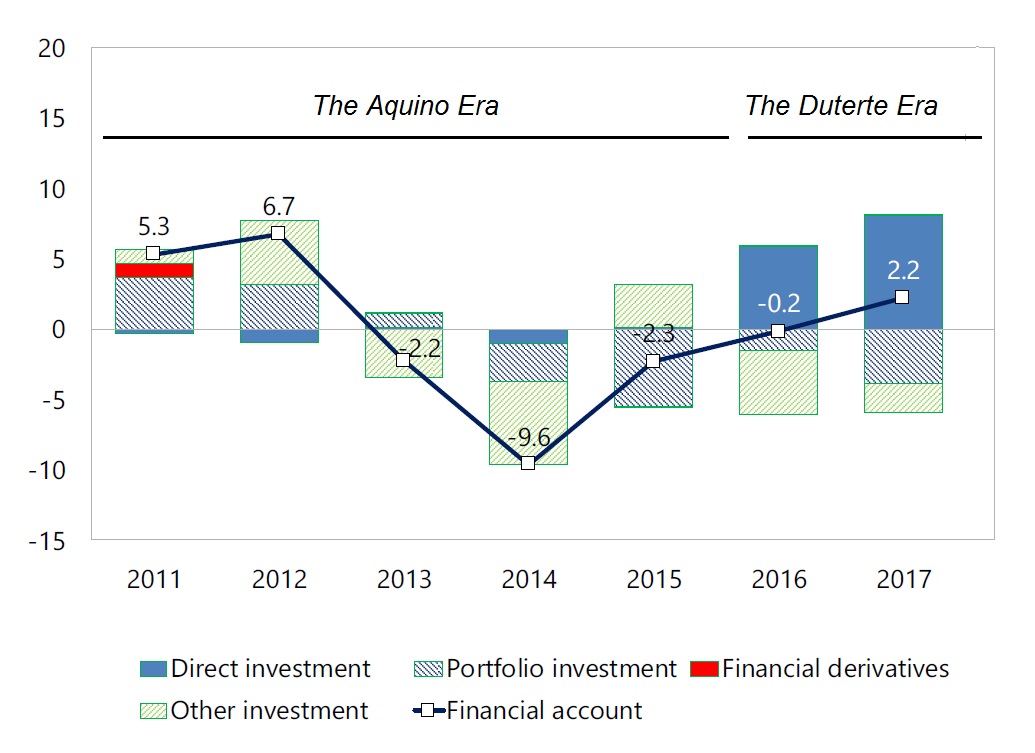
* Capital Flows (In billions of U.S. dollars, + = inflow)

Source: Data from IMF(September 2018)

True, the current account balance declined in 2017, as the critics complain, but it did so mainly due to higher investment, which reflects Philippines attractiveness as an investment destination, and higher oil prices, which are not under the control of domestic policymakers. Moreover, last year FDI inflows more than offset the outflows in portfolio and other investment.

It is also true that international reserves have declined in the Duterte era. However, Philippine reserves remain higher than in most emerging economies worldwide – and significantly higher than in India and Indonesia which cope with similar challenges.

That’s precisely why the overwhelming majority of Filipinos oppose any effort at a destabilization of the Duterte government. That’s why they stand behind its economic program and the war against drugs and corruption. They want no return to the past. They want the economic future that has eluded them far too long.

About the Author:

Dan Steinbock is the founder of Difference Group and has served as research director of international business at the India, China and America Institute (US) and a visiting fellow at the Shanghai Institute for International Studies (China) and the EU Center (Singapore). For more, see http://www.differencegroup.net/     

The original commentary was released by The Manila Times on October 1, 2018


Competing Narratives: Is the Growth of Giant Companies Good for the Economy?

By Amram Margalit – Leverate

Competition in the American economy is changing, but the shift isn’t about the number of new businesses coming into the market, rather about the perceived monopoly from big corporations.

A recent conference of bankers, policymakers, and academics highlights a key concern over market concentration in which larger companies appear to be cutting competition as well as reducing wages and productivity.

However, another perspective came about from the discussions: economist John Van Reenen believes that the market concentration might not be due to reduced competition but rather a change in its nature. Van Reenen cited AirBnB and Google as examples to prove his point, adding that such productive businesses are simply acquiring a larger market share.

So which is it: is the growth of larger businesses good or bad for the U.S. economy?

Bigger Firms Buying Up Smaller Businesses

Corporate consolidation can lead to favorable outcomes, like better productivity and greater opportunities with more resources.

GenFKD.org reports that mergers and acquisitions may not be that bad. Given the efficiency of larger firms, they have the means to provide quality products at lower prices. But it could also mean mass layoffs and create unfair competition for small businesses.

Small companies lack the heft of resources that big companies have, and this capability could cause problems in the supply chain.

Take for example the tiff between Oakley sunglasses and the world’s most dominant eyewear company, Luxottica. Oakley challenged the eyewear company on pricing, and Luxottica responded by taking out the brand from its stores.

What happens to a business if it can’t get its products to its customers? Oakley’s stock price dropped, and it had to merge with Luxottica.

The proliferation of “superstar companies”, as one Bloomberg report refers to big and old businesses, is so evident that they are increasing in number to dominate the market. The effect doesn’t just create problems for small businesses, but it also limits options for consumers.

What Happens with Reduced Competition?

Fewer options for consumers could mean higher prices. When people have only a couple of options for what airline to take on certain routes for example, those airlines may ask for higher fares. As it stands, only four airlines control 80 percent of the US market. And travelers are feeling the pinch, with a 5 percent rise in domestic fares.

So the lack of competition doesn’t just affect small businesses – consumers also pay the price.

Some industries are not giving way to market concentration though. Technology and transportation are two industries that are thriving as they give way to new players. Media also has some type of immunity as new outfits like Netflix and Hulu give the competition a run for their money, and being wildly successful with its entry into the market.

How Superstar Companies Got Away with It

Merge activities occurred in the early 1900s with the creation of steel and oil monopolies. The increase in consolidation happened due to several factors, the first being deregulation. As the aviation in the 1970s and banking in the 1980s underwent deregulation, companies had more freedom to operate in whichever way they wanted. This led to wave after wave of merger activities.

The conditions of the economy also contributed to today’s rising market concentration. For a time, the Federal Reserve kept interest rates very low. In spite of the weak economy, the move of the Federal Reserve boosted stock prices. With high stock values, superstar companies had more resources to take over rivals.

Every market has to have room for all the players — big and small. Competition is healthy for America because it encourages small businesses, which can provide jobs and consumer spending, which stimulates the economy. That competition, however, has to have its balances.

About the Author:

Amram Margalit is a professional writer who has worked in a wide range of settings, including technology companies, nonprofits, and the entertainment industry. Within these positions, Amram has provided quality content and advertising services and is currently the Content Manager at Leverate.


EURUSD: the pair has gained a foothold above the balance line

By Gabriel Ojimadu, Alpari

Previous:

On Tuesday the 2nd of October, trading on the EURUSD pair closed down. In the US session, buyers recovered a big portion of the losses they incurred during trading in Europe. The euro is under pressure from the situation in Italy, where the government has approved a budget deficit of 2.4% for 2019. Italian Deputy Prime Minister Luigi Di Maio gave markets some respite after saying that the government has no plans to leave the EU.

Fed Chair Jerome Powell’s speech didn’t didn’t spark any serious volatility. The euro recovered to 1.1570, after which the EURUSD pair went into a correctional phase, where it has been for the last 9 hours.

Day’s news (GMT+3):

  • 10:15 Spain: Markit services PMI (Sep).
  • 10:45 Italy: Markit services PMI (Sep).
  • 10:50 France: Markit services PMI (Sep).
  • 10:55 Germany: Markit services PMI (Sep).
  • 11:00 Eurozone: Markit services PMI (Sep).
  • 11:30 UK: Markit services PMI (Sep).
  • 12:00 Eurozone: retail sales (Aug).
  • 15:00 US: ADP employment change (Sep).
  • 16:45 US: Markit services PMI (Sep).
  • 17:00 US: ISM non-manufacturing PMI (Sep)
  • 17:30 US: EIA crude oil stocks change (28 Sep).

Fig 1. EURUSD hourly chart.

Current situation:

The fundamentals overpowered technical factors, which took me by surprise. Nevertheless, the bulls were able to recover their losses in the US, and further strengthened their positions in Asia.

The euro surged on the news that Italy plans to reduce its budget deficit to 2% in 2021. The news isn’t that great, because it’s still 2018. It’s easy to make promises now, and not fulfil them later.

From the 1.1505 low, the euro recovered by 67 degrees. From a technical standpoint, there’s nothing stopping this correction continuing to 1.1613 (90 degrees). There’s a resistance at this level, which is drawn from the highs of 1.1630 and 1.1625.

If today doesn’t give us any negative news about Brexit or the Italian budget, then we could see quotes rise to 1.1650 ahead of Friday’s payrolls.

From today’s US data, it’s worth paying attention to the ADP employment report, and the PMI data from Markit and ISM. The former is important for traders in order to revise their positions ahead of the NFP report. The PMI reports are important for the Federal Reserve.

I wrote yesterday that the longer prices move against the cycles, the bigger the rebound will be. Our pair could make is as far as the 112th degree at 1.1639 (today’s limit) unimpeded. A breakout of 1.1552 (meaning a breakout of the local upwards channel) will, conversely, increase pressure on buyers. The pair is trading above the LB balance line, which is therefore now providing support to buyers.

Successful Traders “Learn to Do Something That Almost No One Else Can Do”

Why successful financial speculators are so rare

By Elliott Wave International

Most market speculators dream about trading their way to wealth.

But, also, most discover very quickly that their list of trading “dos” and “don’ts” are just not sufficient.

The hard, cold truth is that most will fail. According to brokers’ statistics, up to 90% of all traders will end up losing money. It’s a steep hill to climb.

But, there is a way. As you keep reading, you’ll discover how to get important insights into what makes traders successful.

In the meantime, let’s start off with some words of warning from professional trader Peter Brandt, who contributed this to the April 1991 Elliott Wave Theorist (Brandt’s insights are timeless):

I believe that it takes a minimum of 3 to 5 years for a person to learn enough about speculative markets and the speculative process to become a successful trader. I also believe that every successful trader has his or her unique approach to trading. I have not known two successful traders that operate in the same exact fashion. Each has found a special niche that seems to fit his personality.

The major problem is that the vast majority of individuals (80-90%) either burn out their pocketbooks or their emotional will to continue trading before they figure out the rules of the game. This is a cold and harsh reality, but a reality it is.

Robert Prechter explained why successful traders are few and far between in the June 2004 Theorist:

This discussion about the natural tendency of people to apply physics to finance explains why successful traders are so rare and why they are so immensely rewarded for their skills.

There is no such thing as a “born trader” because people are born — or learn very early — to respect the laws of physics. This respect is so strong that they apply these laws even in inappropriate situations. Most people who follow the market closely act as if the market is a physical force aimed at their heads. Buying during rallies and selling during declines is akin to ducking when a rock is hurtling toward you. Successful traders learn to do something that almost no one else can do. They sell near the emotional extreme of a rally and buy near the emotional extreme of a decline.

The mental discipline that a successful trader shows in buying low and selling high is akin to that of a person who sees a rock thrown at his head and refuses to duck. He thinks, I’m betting that the rock will veer away at the last moment, of its own accord. In this endeavor, he must ignore the laws of physics to which his mind naturally defaults. In the physical world, this would be insane behavior; in finance, it makes him rich.

Unfortunately, sometimes the rock does not veer. It hits the trader in the head. All he has to rely upon is percentages. He knows from long study that most of the time, the rock coming at him will veer away, but he also must take the consequences when it doesn’t. The emotional fortitude required to stand in the way of a hurtling stone when you might get hurt is immense, and few people possess it. It is, of course, a great paradox that people who can’t perform this feat get hurt over and over in financial markets and endure a serious stoning, sometimes to death. Many great truths about life are paradoxical, and so is this one.

Prechter won the United States Trading Championship in 1984. He made approximately 200 short-term trades as he followed hourly market data over a four-month period.

After reflecting on his trading experiences, Prechter decided to write down the guidelines you really need to trade the financial markets successfully.

Get the free report, “What Every Trader Really Needs to be Successful.”

What You and Every Other Trader REALLY Need to Be Successful

Trading isn’t easy. You know as well as we do how confusing and frustrating it can be.

So frustrating, in fact, that it can lead you to veer off course – and give up trading entirely.

There is a better way. Often, all a trader like you needs are a few simple tips to right the ship and set it back on course.

You can get tips from a U.S. Trading Champion.

In 1984, in a monitored account, Robert Prechter won the U.S. Trading Championship with a then-record 444% return. He later earned the title of “The Guru of the Decade” from the network today called CNBC.

Bob knows a thing or two about trading – and you can learn from him. Free.

This free special report gives you Bob’s 5 tips every trader must know to win in the markets.

Read the report now, free – and put Bob’s tips to good use today.

This article was syndicated by Elliott Wave International and was originally published under the headline Successful Traders “Learn to Do Something That Almost No One Else Can Do”. EWI is the world’s largest market forecasting firm. Its staff of full-time analysts led by Chartered Market Technician Robert Prechter provides 24-hour-a-day market analysis to institutional and private investors around the world.