EURUSD has reached 1.1540. Possibly, today the pair may expand the consolidation range towards 1.1450. If later the instrument breaks this range to the downside, the price may resume trading inside the downtrend towards 1.1344; if to the upside – continue the correction to reach 1.1650.
GBPUSD, “Great Britain Pound vs US Dollar”
GBPUSD has reached 1.3030. Today, the pair may start another decline towards 1.2870 and then resume growing with the target at 1.2994.
USDCHF, “US Dollar vs Swiss Franc”
USDCHF has reached the short-term upside target. Possibly, today the pair may form a new consolidation range near the highs with a reversal pattern and start another correction to reach 0.9760. After that, the instrument may move upwards with the target at 0.9990.
USDJPY, “US Dollar vs Japanese Yen”
USDJPY is forming the first descending impulse. Today, the pair may reach 113.58 and then grow towards 114.07, thus forming a new consolidation range. If the instrument breaks 114.20 to the downside, the price may start another decline with the short-term target at 112.00.
AUDUSD, “Australian Dollar vs US Dollar”
AUDUSD is still consolidating near the lows. Possibly, the pair may break the upside border and start a new correction to reach 0.7130. Later, the market may resume falling towards the target at 0.7000.
USDRUB, “US Dollar vs Russian Ruble”
After the gap up, USDRUB has reached first target of the correction. Possibly, today the pair may form a new descending structure towards 66.05 and then grow to reach 67.16. After that, the instrument may resume falling with the target at 66.60 and then start another growth towards 68.10.
XAUUSD, “Gold vs US Dollar”
Gold is moving downwards with the target at 1194.00. After that, the instrument may grow to reach 1201.00 and then start a new descending wave towards the short-term target at 1187.00.
BRENT
Brent is consolidating near the highs. Today, the pair may fall towards 85.55 and then fall to reach 84.00. Later, the market may return to 85.55. If the instrument breaks this range to the downside, the price may start a new correction with the target at 81.65.
Attention! Forecasts presented in this section only reflect the author’s private opinion and should not be considered as guidance for trading. RoboForex LP bears no responsibility for trading results based on trading recommendations described in these analytical reviews.
Yesterday, the EUR/USD quotes moved away from local lows. At the moment, the technical pattern is ambiguous. The trading instrument is consolidating near the “mirror” resistance of 1.15150. The key support is the 1.14650 mark. Investors took a wait-and-see attitude before the publication of report on the US labor market. We recommend paying attention to the difference between the actual and forecasted values. Positions should be opened from the key levels.
At 15:30 (GMT+3:00) we expect statistics on the US labor market.
Indicators do not send accurate signals: the price is testing 50 MA.
The MACD histogram is near the 0 mark.
Stochastic Oscillator has started moving out of the oversold zone, the %K line is above the %D line, which gives a signal to buy EUR/USD.
Trading recommendations
Support levels: 1.14650, 1.14250, 1.14000
Resistance levels: 1.15150, 1.15650, 1.15900
If the price fixes above the resistance level of 1.15150, the EUR/USD quotes are expected to recover. The movement is tending to 1.15750-1.16000.
An alternative may be a further decrease in the EUR/USD currency pair to the level of 1.14500-1.14250.
The GBP/USD currency pair
Technical indicators of the currency pair:
Prev Open: 1.29363
Open: 1.30190
% chg. over the last day: +0.63
Day’s range: 1.30031 – 1.30594
52 wk range: 1.2361 – 1.4345
The GBP/USD currency pair has begun to recover. Yesterday, the growth of quotes exceeded 80 points. At the moment, the trading instrument is consolidating. Financial market participants expect a report on the US labor market. The key support and resistance levels are 1.30000 and 1.30600, respectively. Positions should be opened from these marks.
Today, the news feed on the UK economy is calm.
The price has fixed between 50 MA and 200 MA, which are strong dynamic support and resistance levels.
The MACD histogram is in the positive zone and continues to rise, which indicates the growth of the GBP/USD currency pair.
Stochastic Oscillator is in the neutral zone, the %K line is above the %D line, which gives a signal to buy GBP/USD.
Trading recommendations
Support levels: 1.30000, 1.29400
Resistance levels: 1.30600, 1.31000, 1.31500
If the price fixes above the resistance level of 1.30600, further correction of the GBP/USD quotes is expected. The movement is tending to 1.31000-1.31300.
An alternative may be the decrease of the GBP/USD currency pair to the level of 1.29750-1.29500.
The USD/CAD currency pair
Technical indicators of the currency pair:
Prev Open: 1.28656
Open: 1.29207
% chg. over the last day: +0.40
Day’s range: 1.29157 – 1.29353
52 wk range: 1.2059 – 1.3795
The USD/CAD currency pair continues to show positive dynamics. Yesterday, the Canadian dollar weakened against the US dollar by more than 60 points. Weak statistics on the Ivey purchasing managers’ index in Canada put pressure on Loonie. At the moment, the trading instrument is consolidating in the range of 1.29000-1.29400. Investors expect reports on labor markets of the US and Canada. Positions should be opened from the key levels.
At 15:30 (GMT+3:00) statistics on the labor market will be published in Canada.
The price has fixed above 200 MA, which indicates the power of buyers.
The MACD histogram is in the positive zone, but below the signal line, which gives a weak signal to buy USD/CAD.
Stochastic Oscillator has started moving out of the overbought zone, the %K line is below the %D line, which indicates the bearish sentiment.
Trading recommendations
Support levels: 1.29000, 1.28600, 1.28400
Resistance levels: 1.29400, 1.29700, 1.30000
If the price fixes above the resistance level of 1.29400, further growth of the USD/CAD currency pair is expected. The movement is tending to 1.29700-1.30000.
Alternative option. If the price fixes below the round level of 1.29000, it is necessary to consider sales of USD/CAD. The movement is tending to 1.28600-1.28400.
The USD/JPY currency pair
Technical indicators of the currency pair:
Prev Open: 114.503
Open: 113.868
% chg. over the last day: -0.55
Day’s range: 113.786 – 114.101
52 wk range: 104.56 – 114.74
Yesterday, sales prevailed on the USD/JPY currency pair. Quotes moved away from annual highs and updated local extremes. At the moment, the trading instrument is moving in the flat. Investors expect labor statistics from the United States. The key support and resistance levels are 113.650 and 114.000, respectively. The USD/JPY currency pair has the potential for further correction. Positions should be opened from the key levels.
The news feed on the economy of Japan is quite calm.
Indicators do not send accurate signals. The price has fixed between 50 MA and 200 MA.
The MACD histogram is in the negative zone and continues to decline, which indicates the bearish sentiment.
Stochastic Oscillator is in the neutral zone, the %K line has crossed the %D line. There are no signals at the moment.
Trading recommendations
Support levels: 113.650, 113.300, 113.000
Resistance levels: 114.000, 114.200, 114.500
If the price fixes below the support level of 113.650, further correction of the USD/JPY currency pair is expected. The movement is tending to 113.300-113.000.
An alternative may be the growth of the USD/JPY quotes to the level of 114.250-114.500.
The US dollar is being traded near highs over the past one and a half month. The US dollar index (#DX) is consolidating. Yesterday, the index closed unchanged (0.00%). Investors took a wait-and-see attitude before publication of important economic data on the US labor market. Experts expect that in September, the number of people employed in the US non-farm sector will slow down to 185,000. The unemployment rate will fall from 3.9% to 3.8%. The growth of the average hourly wage will count to 0.3%. We recommend paying attention to the difference between the actual and forecasted values.
Yesterday, the Ivey purchasing managers’ index for September was published in Canada, which dropped to 50.4 and turned out to be worse than the forecasted value of 62.3. Today, during the Asian trading session, data on the volume of retail sales have been published in Australia. In August, the indicator increased by 0.3%, as investors expected.
The “black gold” prices have started recovering after a sharp decline during yesterday’s trading session. At the moment, futures for the WTI crude oil are testing a mark of $74.85 per barrel.
Market Indicators
Yesterday, the aggressive sales were observed in the US stock market: #SPY (-0.87%), #DIA (-0.63%), #QQQ (-1.92%).
At the moment, the 10-year US government bonds yield is at the level 3.20-3.21%.
The news feed on 2018.10.05:
– Reports on the US labor market at 15:30 (GMT+3:00); – Employment change in Canada at 15:30 (GMT+3:00).
On Thursday the 4th of October, trading on the euro closed up. The single currency rebounded from a low of 1.1463. This rise was facilitated by a broadly weaker dollar as well as the closing of short positions in anticipation of today’s employment report from the US.
The rise of the British pound also led traders to open long positions on the euro. The EU’s chief Brexit negotiator, Michel Barnier, announced that the EU and UK had entered the final stages of negotiations. The current situation on the Forex market favours the further recovery of the euro. Buyers just need to weather the NFP report.
Day’s news (GMT+3):
09:00 Germany: factory orders (Aug), PPI (Aug).
09:45 France: trade balance (Aug).
10:15 Switzerland: CPI (Sep).
10:30 UK: Halifax house prices (Sep).
15:30 US: trade balance (Aug), nonfarm payrolls (Sep), average weekly hours (Sep), average hourly earnings (Sep), labour force participation rate (Sep).
15:30 Canada: imports (Aug), exports (Aug).
20:00 US: Baker Hughes US oil rig count.
Fig 1. EURUSD hourly chart.
Current situation:
The euro recovered 67 degrees against the greenback. The pair first rebounded upwards from the 112thdegree, and then downwards from the trend line. Markets are holding their breath as they await the release of US data.
There’s no forecast on today’s chart given the importance of the statistics coming out later. The US will publish a report of the number of new jobs created in September. The ADP report significantly exceeded expectations, so the NFP could too. Growth in employment is expected to pick up where it left off in August, with about 200k new jobs expected.
I reckon that volatility will be high following the report’s release. The thing is that Fed Chair Jerome Powell has hinted at an aggressive tightening of monetary policy. For this, today’s economic data should come out higher than expected. Any shortcomings on this front will cause the US dollar index to fall and the other major currencies to rise.
The EURUSD pair is currently trading around the trend line. Traders have their protective stop levels at 1.1543. If the NFP report posts fewer than 180k new jobs, the euro will jump to 1.1600. If unemployment rises, and the values for the previous two months are revised downwards, the pair is likely to rise as far as 1.1629. If the NFP comes out at 220k or higher, we can expect the pair to revisit to low of 1.1463, followed by a sharp rebound ahead of the weekend.
Global Forex and Contract for Difference (CFD) broker Admiral Markets AS has relocated its head office in Tallinn. The new location is located in Maakri Kvartal, or the Maakri Quarter, in the first highrise taller than 100 metres to be built in Tallinn in over 10 years.
The move comes after having been based at Ahtri 6a in the Kompassi district for the past eight years.
When commenting on the reasons for the move, Admiral Markets AS CEO Sergei Bogatenkov said, “Following unprecedented growth over the past 12 months, we are happy to be taking this next step with our team. We look forward to continuing to serve our clients and delivering a superior trading and investment experience from our new location.”
Under the international financial services trademark of Admiral Markets, the company offers its clients Forex and leveraged CFD web-based trading services in the over-the-counter market as well as listed instruments. Since its foundation in 2001, Admiral Markets has continually expanded its reach, and today it is physically represented in 16 countries through its regulated trading companies with a customer portfolio covering over 110 countries.
Expansion and improvement have been an ongoing focus for Admiral Markets since its foundation, with new services and instruments being added for their clients on a regular basis. In 2018 alone, the company added over 4,000 new stocks and 100 exchange-traded funds (ETFs) to its suite of trading instruments available on Admiral.Invest accounts in Admiral Markets AS and Admiral Markets UK Ltd. Additionally, over 3,000 stock CFDs and 80 ETF CFDs were introduced on the Admiral.MT5 account.
2018 also saw Admiral Markets apply for a credit institution licence through the Estonian Financial Supervision Authority, with the intention to provide financial services that complement its current investment services to countries in the European Union. The Authority is currently processing the application.
These were just some of the initiatives that contributed to Admiral Markets earning record revenue and profits during the first six months of 2018, with net trading income increasing to 12.6 million euros (3.6 million euros more than the same period in 2017). The company’s net profit was 5 million euros – 127% higher compared to 2.2 million euros a year earlier – and profit margins increased to 40% compared with 24% year-on-year.
The company’s move to its new head office reflects the expansion of recent years, and expectations of continued growth into the future.
“Buildings and architecture reflect the Admiral Markets story, as we move to a new sphere with our new office,” said Co-CEO of Admiral Markets Group AS Jens Chrzanowski. “The highest business floor in Tallinn is now ours.”
Admiral Markets’ new premises is part of Tallinn’s Maakri Kvartal development, which comprises seven commercial buildings, including the thirty-storey highrise where the Admiral Markets head office is now situated. The 110-metre highrise is a modern, glass tower that links the historical heart of Tallinn with the commercial district marked by future highrise planning.
The new address of company is Maakri 19/21, Maakri Kvartal, 11th floor, Tallinn, 10114, Republic of Estonia. The general contact details of Admiral Markets AS will remain the same.
About Admiral Markets
Admiral Markets is a leading online trading provider specialising in equities, securities and contracts for difference. In addition to a wide range of financial instruments, Admiral Markets offers free educational materials, including analytics, webinars and seminars.
The cryptocurrency and blockchain sector must now actively call out crypto demagogues, do more to prove crypto cynics wrong, and push for regulation.
This was the bold and controversial message in the address to The Delta Summit, Malta’s official blockchain and digital event, by Nigel Green, the founder and chief executive of deVere, one of the world’s largest independent financial advisory organizations.
In his rallying speech, he namedropped U.S. President Donald Trump; cybersecurity expert, John McAfee; and legendary billionaire investor, Warren Buffett.
Speaking to the press after his Delta Summit address, Mr Green noted: “Cryptocurrencies and blockchain technology have taken the world by storm.
“This is because they have the enormous, real potential to improve society, how we handle money, how we do business, and how we govern ourselves.
“But for this potential to be fully realised, we need to build trust. Building trust is one of the biggest challenges facing the industry.”
He continued: “Trust in the sector is routinely compromised by crypto demagogues who make wild and unsubstantiated claims and who sell themselves out to the highest bidder, regardless of facts and consequences.
“Trust in the sector is also under attack by crypto cynics. These are those high-profile financial traditionalists and institutions, who are likely to either have vested interests in maintaining the status quo or have no understanding and/or no desire to understand the unprecedented shift taking place right now.
“Their dismissiveness must be proved misguided by showing them that these hugely exciting, far-reaching developments are legitimate, here to stay and are beneficial.
“In addition, a sound and enforceable regulatory framework will enhance trust by giving investors even more confidence and protection.”
“In short, the cryptocurrency and blockchain sector must now actively call out crypto demagogues, do more to prove crypto cynics wrong, and push for regulation.”
Mr Green concluded: “There is already a huge and continually growing appetite for cryptocurrencies and blockchain.
“People across the world are increasingly looking for alternatives to fiat money, traditional financial services, and centralised agencies and governments – and this sector answers that demand.
“As such, once we have established trust, the environment will be ripe for the phase of mass adoption and investment.”
About:
deVere Group is one of the world’s largest independent advisors of specialist global financial solutions to international, local mass affluent, and high-net-worth clients. It has a network of more than 70 offices across the world, over 80,000 clients and $12bn under advisement.
As the international community is becoming more aware of the threat the U.S.-Sino trade war poses to global growth, what was originally a bilateral tariff conflict is spreading across regions.
During a press conference on September 26, President Donald Trump disclosed why he believes China, despite the U.S. tariff wars, respects him – because of his “very, very large brain.”
Whether it is the net effect of the president’s extraordinary brain or the result of more conventional economic and geopolitical forces, the U.S. tariff wars are set to derail global recovery that has taken a decade to materialize.
Escalation Through Three Scenarios
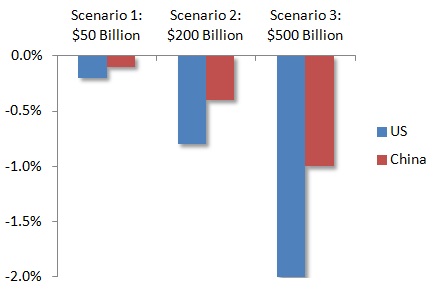
Where will the current tensions lead? The progression of Trump’s tariff war can be illustrated through three scenarios, showing the development of the dispute from a mere bilateral trade conflict to a potential global trade war. Following a series of tariff threats from the Trump administration in spring, the economic stakes have been increased from $50 billion to $200 billion, and now to a threatened $500 billion of Chinese imports in America (Figure 1).
Figure 1
Three Tariff Scenarios: From Bilateral Trade Conflict to Global Trade War
Source: Data from International Trade Administration, Standard & Poor’s, Difference Group.
Scenario 1: Unilateral Muddling Through. In July, this stage began when the two countries imposed 25 percent tariffs on $34 billion of the other’s imports and levies on another $16 billion. With just $50 billion of goods impacted, the tariff’s economic impact would have been limited to 0.1 percent of Chinese GDP and 0.2 percent of American GDP, respectively. That’s when some of Trump’s key constituencies, such as the U.S. Chamber of Commerce and the National Farmers’ Association, began a campaign against the tariffs; they were soon joined by American retailers and a host of other industry associations.
Scenario 2: ‘America First’ Escalation. Every U.S. president has exploited China-bashing in the post-Cold War presidential campaigns. However, Trump is the first to walk the talk in the White House. With escalation, the stakes quadrupled to $200 billion, and the potential collateral damage quadrupled relative to the first scenario. In China, it could shave off 0.4 percent of GDP; in the U.S., 0.8 percent of GDP.
Scenario 3: Global Trade War. It is the third scenario that has hovered as a threat above the global economy ever since the 2000s, as China has been increasingly used as a scapegoat for America’s trade deficit. When the stakes of the White House’s tariff war escalate to $500 billion, the potential collateral damage will increase tenfold from the first scenario. While China’s GDP could take a hit of 1 percent, the U.S. GDP is likely to suffer a net impact of 2 percent (see Figure 1 sources).
Derailing Global Economic Integration
Following a surprisingly sharp upswing in 2017, both exports and imports in Asia have held up very well year-to-date, with continued double-digit growth in many economies. However, now there is heightened uncertainty about the external environment. The three pillars of global economic integration – world trade, investment and migration flows –– are now positioned to take severe hits, only a decade after the global financial crisis.
Falling Trade. According to the World Trade Organization (WTO), merchandise trade volume growth was expected to reach 4.4 percent in 2018; that’s only a few percentage points below the 2017 level. But as Trump’s tariffs are escalating trade tensions, a fall in business confidence and changing investment decisions are likely to compromise the 4.4 percent outlook. A full trade war could derail trade recovery for years.
Stagnating Investment. Before the global financial crisis, world investment soared to almost $2 trillion. According to the UN, global FDI flows were projected to resume growth in 2017 and surpass $1.8 trillion in 2018. In reality, they fell to $1.5 trillion last year; that’s 15 percent below the pre-crisis peak. In the near term, Trump’s trade war and the Fed’s interest rate hikes seem set to undermine world investment prospects.
Migration Crises. After the terrorist attacks in 2001, the subsequent U.S.-led wars in Afghanistan and Iraq, and conflicts elsewhere in the Middle East and Africa, more than 68 million people have been driven from their homes. That translates to the greatest global forced displacement since 1945. In the Trump era, a tariff war and the historical reversal of American immigration policy are likely to aggravate geopolitical friction new migration crises, and terrorism.
Global Economic Prospects No Longer Immune
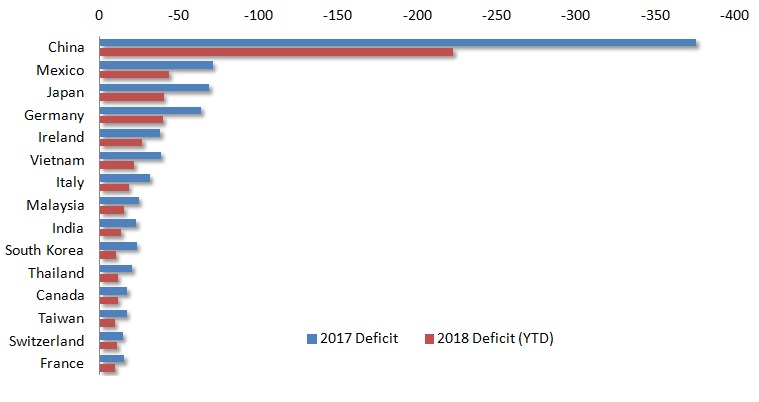
In 2017-18, the U.S. had major trade deficits with China, Mexico, Japan and Germany, as well as more minor deficits with a number of other countries. In addition to the European Union, these economies represent America’s NAFTA partners, U.S. geopolitical allies in East Asia (Japan and South Korea) and low-cost emerging Asia (Figure 2). If President Trump keeps his pledge to challenge these major “deficit offenders” along with China, trade wars will spread multilaterally.
Figure 2 U.S. Trade Deficit, 2017- July 2018 ($ Billions)
Source: Data from U.S. Census Bureau, Difference Group.
Yet, the progress of Trump’s trade hawks may already have stalled. The Trump White House has greatly benefited from the Republican Congress, but now both the Democrats and U.S. trade partners are positioned to wait to negotiate until after the mid-term elections. The outcome of the midterms could constrain Trump’s leverage significantly (if Democrats win the House) or very significantly (if Democrats win both the House and the Senate). When talks between the U.S. and China begin anew, we can expect one of these four scenarios:
Scenario 1: Pragmatism Prevails. Both parties formulate a mutually acceptable retreat from their initial positions. Since both economies are not hugely dependent on external demand, and effective tariff schedules could be delayed or diluted, a joint retreat with mutual face-saving measures is still possible, though not probable. In this case, global supply chains would remain largely in place. Investor and business confidence would return. Economic outlook would be upgraded.
Scenario 2: Agreeing to Disagree. Both sides reaffirm the existing venues of economic and strategic dialogue and begin vital talks about bilateral schisms, such as intellectual property rights, technology transfer, investment review and market access, and strategic M&As. In this and the following scenario, regional supply chains would be reconfigured. Economic certainty would be restored, except for periodic market volatility. Global prospects would suffer a dip, but improve over time.
Scenario 3: Balancing Trade, Kind Of. In this opportunistic scenario, China pledges to absorb substantial amounts of U.S. imports by slowing deleveraging, defers its economic rebalancing and supports importers in a big way. The trade balance would look better and the bilateral deficit would shrink, but a sustained trade balance would take longer to achieve.
Scenario 4: Warring for Global Trade. Both sides dig in for the long term. The bilateral battle spreads to other regions and global supply chains are disrupted. A U.S.-Sino trade war would trigger a slowdown in Asia, which would precipitate severely impaired prospects across several regions. The outlook for global growth would be significantly downgraded.
Not All Scenarios Are Equal
In the absence of policy changes, scenarios 1-2 seem currently unlikely (though more probable after the midterm elections.) Scenario 3 has suffered a premature death, thanks to Trump’s inclination to kill the prospect of daytime talks with nighttime tweets. If scenario 4 triumphs, protectionist trade policies will dramatically aggravate conditions internationally.
Even as the recent rate hike is boosting the U.S. dollar and causing broad distress in emerging economies that fuel global growth prospects, the White House is navigating toward pitfalls that represent everything but a safe haven.
The international community should not follow in Trump’s footprints. If it does, that will encourage new attacks against global trade, lead to new protectionist offensives against the major EU and Asian trading economies and thus virtually ensure that some kind of scenario 4 will materialize.
Instead, what is needed is international support for trade trajectories that will support scenarios 1-2. In the long-run, only those scenarios are in the interest of both the U.S. and Chinese economies, as well as the global economy.
About the Author:
Dan Steinbock is the founder of Difference Group and has served as research director of international business at the India, China and America Institute (US) and a visiting fellow at the Shanghai Institute for International Studies (China) and the EU Center (Singapore). For more, see http://www.differencegroup.net/
The original commentary was released by China-US Focus on October 2, 2018
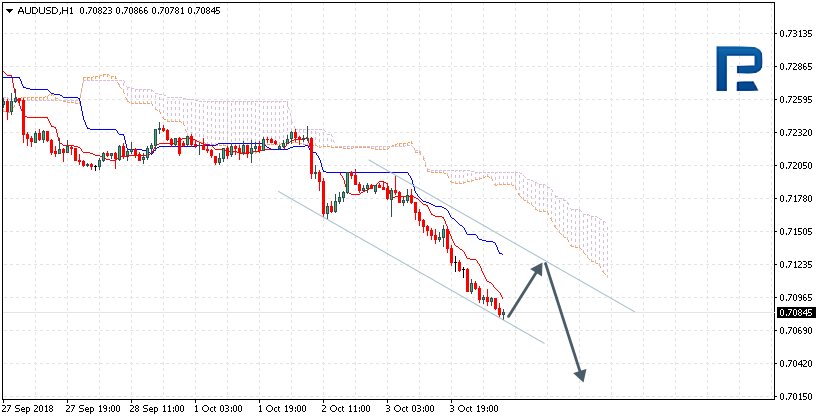
In the H4 chart, AUDUSD is forming another descending impulse inside the long-term downtrend; it has already broken the previous high. The possible targets may be inside the post-correctional extension area between the retracements of 138.2% and 161.8% at 0.6998 and 0.6944 respectively. The key resistance level is t 0.7315.
As we can see in the H1 chart, the pair is trading downwards to reach the post-correctional extension area.
USDCAD, “US Dollar vs Canadian Dollar”
As we can see in the H4 chart, the downtrend has already reached the retracement of 50.5%. The next downside target is the retracement of 61.8% at 1.2683. At the same time, the convergence is being formed, which may indicate that after reaching its downside targets USDCAD may reverse and start a new pullback towards the retracements of 23.6%, 38.2%, and 50.0% at 1.2812, 1.2891, and 1.2955 respectively.
In the H1 chart, the correctional uptrend is heading towards the retracement of 50.0% at 1.2897.
Attention! Forecasts presented in this section only reflect the author’s private opinion and should not be considered as guidance for trading. RoboForex LP bears no responsibility for trading results based on trading recommendations described in these analytical reviews.
AUDUSD is trading at 0.7084; the instrument is moving below Ichimoku Cloud, thus indicating a descending tendency. The markets could indicate that the price may test Tenkan-Sen and Kijun-Sen at 0.7125 and then resume moving downwards to reach 0.7025. Another signal to confirm further descending movement is the price’s rebounding from the channel’s upside border. However, the scenario that Implies further decline may be cancelled if the price breaks the upside border of the cloud and fixes above 0.7180. In this case, the pair may continue growing towards 0.7255.
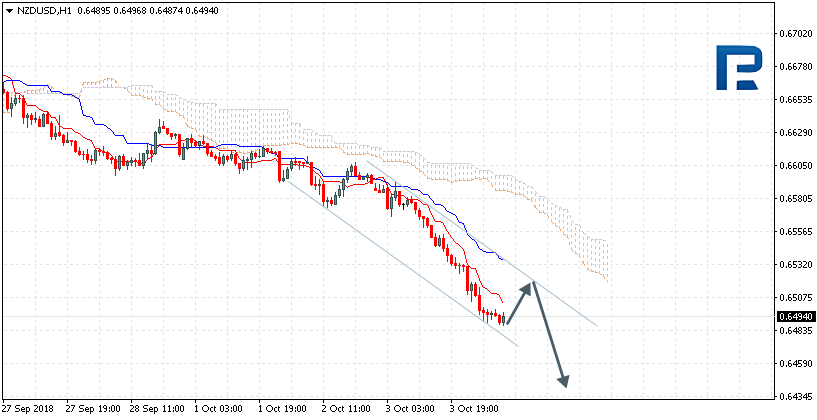
NZDUSD, “New Zealand Dollar vs US Dollar”
NZDUSD is trading at 0.6494; the instrument is moving below Ichimoku Cloud, thus indicating a descending tendency. The markets could indicate that the price may test Tenkan-Sen and Kijun-Sen at 0.6515 and then resume moving downwards to reach 0.6445. Another signal to confirm further descending movement is the price’s rebounding from the channel’s upside border. However, the scenario that Implies further decline may be cancelled if the price breaks the upside border of the cloud and fixes above 0.6590. In this case, the pair may continue growing towards 0.6685.
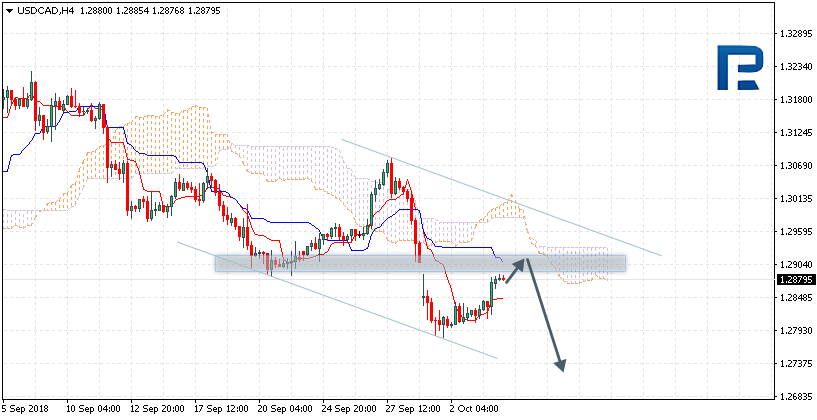
USDCAD, “US Dollar vs Canadian Dollar”
USDCAD is trading at 1.2879; the instrument is moving below Ichimoku Cloud, thus indicating a descending tendency. The markets could indicate that the price may test Tenkan-Sen and Kijun-Sen at 1.2905 and then continue moving downwards to reach 1.2735. Another signal to confirm further descending movement is the price’s rebounding from the resistance level. However, the scenario that implies further decline may be cancelled if the price breaks the upside border of the cloud and fixes above 1.2960. In this case, the pair may continue growing towards 1.3045.
Attention! Forecasts presented in this section only reflect the author’s private opinion and should not be considered as guidance for trading. RoboForex LP bears no responsibility for trading results based on trading recommendations described in these analytical reviews.
Negative dynamics is still observed on the EUR/USD currency pair. Yesterday, the drop in quotes exceeded 70 points. The trading instrument updated local lows. The American currency was supported by positive economic reports from the USA. At the moment, the EUR/USD currency pair is consolidating near the local support of 1.14650. The mark of 1.15150 is already a “mirror” resistance. The EUR/USD quotes are tending to further decline. Positions must be opened from the key levels.
Today the news feed is rather calm:
– The number of initial jobless claims in the US at 15:30 (GMT+3:00);
– Factory orders in the US at 17:00 (GMT+3:00).
The price has fixed below 50 MA and 200 MA, which indicates the power of the sellers.
The MACD histogram is in the negative zone, which indicates the bearish sentiment.
Stochastic Oscillator is in the neutral zone, the %K line is above the %D line, which gives a signal to buy EUR/USD.
Trading recommendations
Support levels: 1.14650, 1.14250, 1.14000
Resistance levels: 1.15150, 1.15650, 1.15900
If the price consolidates below the local support of 1.14650, a further drop in the EUR/USD quotes is expected. The movement is tending to 1.14250-1.14000.
An alternative could be the growth of the EUR/USD currency pair to the level of 1.15300-1.15600.
The GBP/USD currency pair
Technical indicators of the currency pair:
Prev Open: 1.29770
Open: 1.29363
% chg. over the last day: -0.30
Day’s range: 1.29219 – 1.29613
52 wk range: 1.2361 – 1.4345
The bearish sentiment prevails on the GBP/USD currency pair. Pressure on the pound is pout by weak data on economic activity in the UK. At the moment, the GBP/USD quotes are testing the local demand zone of 1.29250-1.29400. The nearest resistance is at 1.29750. Trading instrument is tending to further decline. We recommend opening positions from the key levels.
Today, the news feed on the UK economy is calm.
The price has fixed below 50 MA and 200 MA, which indicates the bearish sentiment.
The MACD histogram is in the negative zone, but above the signal line, which gives a weak signal to sell GBP/USD.
The Stochastic Oscillator is in the neutral zone, the %K line is above the %D line, which indicates that GBP/USD is rising.
Trading recommendations
Support levels: 1.29250, 1.29000
Resistance levels: 1.29750, 1.30150, 1.30600
If the price fixes below 1.29250, a further drop in the GBP/USD quotes is expected. The movement is tending to 1.29000-1.28750.
An alternative could be the growth of the GBP/USD currency pair to the level of 1.30000-1.30250.
The USD/CAD currency pair
Technical indicators of the currency pair:
Prev Open: 1.28233
Open: 1.28656
% chg. over the last day: +0.45
Day’s range: 1.28615 – 1.28880
52 wk range: 1.2059 – 1.3795
The USD/CAD currency pair has started to recover after a sharp fall in late September. At the moment, the quotes are consolidating. The key trading range is 1.28600-1.29000. Demand for US currency remains high. In the near future, we do not rule out further correction of the USD/CAD currency pair. We recommend opening positions from the key levels.
At 17:00 (GMT+3:00) the economic activity index in Canada from Ivey will be published.
Indicators do not give accurate signals: the price has fixed between 50 MA and 200 MA.
The MACD histogram is in the positive zone and continues to rise, which indicates the growth of the USD/CAD quotes.
Stochastic Oscillator is in the neutral zone, the %K line is below %D line, which sends a signal to sell USD/CAD.
Trading recommendations
Support levels: 1.28600, 1.28400, 1.28000
Resistance levels: 1.29000, 1.29400, 1.29700
If the price is consolidating above the round level of 1.29000, a further correction of the USD/CAD currency pair is expected. The movement is tending to 1.29400-1.29700.
Alternative option. If the price fixes below 1.28600, you need to consider selling USD/CAD. The movement is tending to 1.28300-1.28000.
The USD/JPY currency pair
Technical indicators of the currency pair:
Prev Open: 113.632
Open: 114.503
% chg. over the last day: +0.74
Day’s range: 114.217 – 114.549
52 wk range: 104.56 – 114.74
There is a pronounced uptrend on the USD/JPY currency pair. Yesterday, the growth of quotations exceeded 80 points. The trading instrument overcame and fixed above the key mark of 114.000. At the moment, the USD/JPY currency pair is consolidating in the range of 114.200-114.500. We do not exclude further growth of the USD/JPY quotes. We recommend paying attention to the yield of US government bonds.
The news feed on the Japan’s economy is calm.
The price has fixed above 50 MA and 200 MA, which indicates the power of buyers.
The MACD histogram is located in the positive zone, but below the signal line, which gives a weak signal to buy USD/JPY.
Stochastic Oscillator is in the neutral zone, the %K line has started to cross the %D line. There are no signals at the moment.
Trading recommendations
Support levels: 114.200, 114.000, 113.800
Resistance levels: 114.500, 115.000
If the price fixes above the resistance level of 114.500, further growth of the USD/JPY quotes is expected. The movement is tending to the round level of 115.000.
An alternative may be the correction of the USD/JPY currency pair to the level of 114.000-113.800.