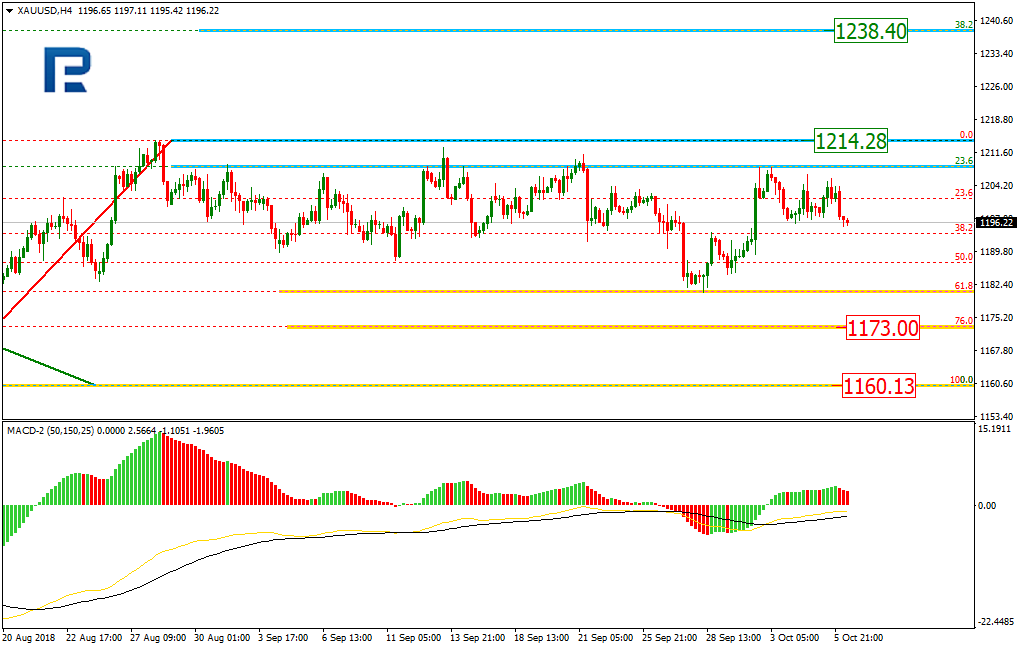
As we can see in the H4 chart, after being corrected downwards by 61.8%, XAUUSD has formed a new rising impulse. In case the descending impulse continues, the target will be the retracement of 76.0% at 1173.00. However, if the pair breaks the high at 1214.28, the instrument may move upwards to reach the retracement of 38.2% at 1238.40.
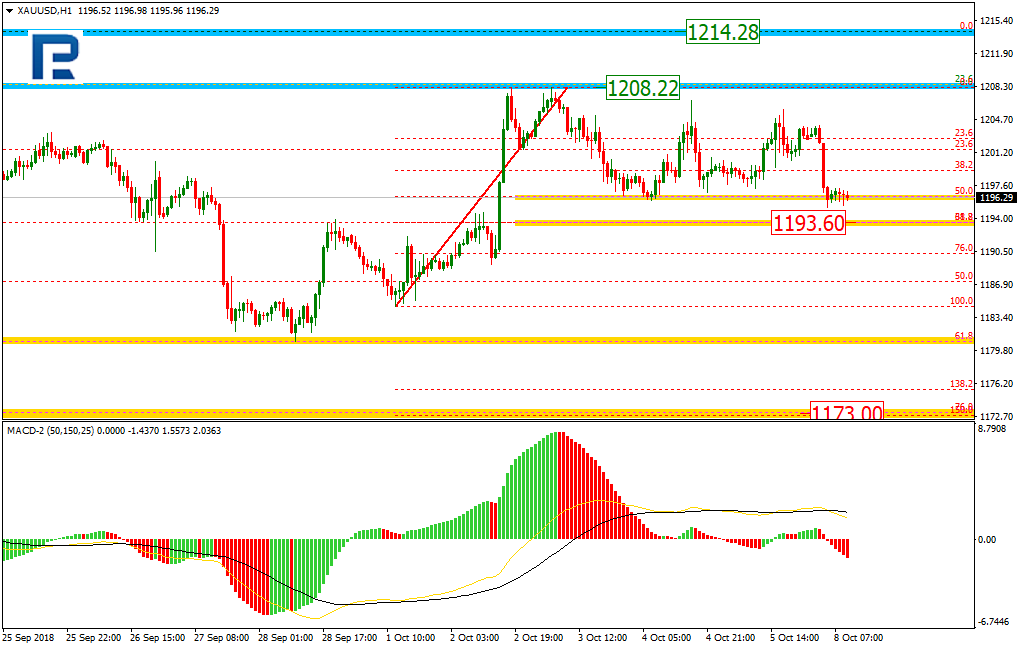
In the H1 chart, the pair is forming a short-term descending correction, which is heading towards the retracement of 61.8% at 1193.60. The main resistance level is the high at 1208.22.
USDCHF, “US Dollar vs Swiss Franc”
As we can see in the H4 chart, the uptrend has reached the retracement of 76.0%. At the same time, one can see the divergence being formed, which may indicate a possible pullback. After that, the instrument may break the high at 0.9955 and then continue trading upwards to reach the resistance level at 1.0068.
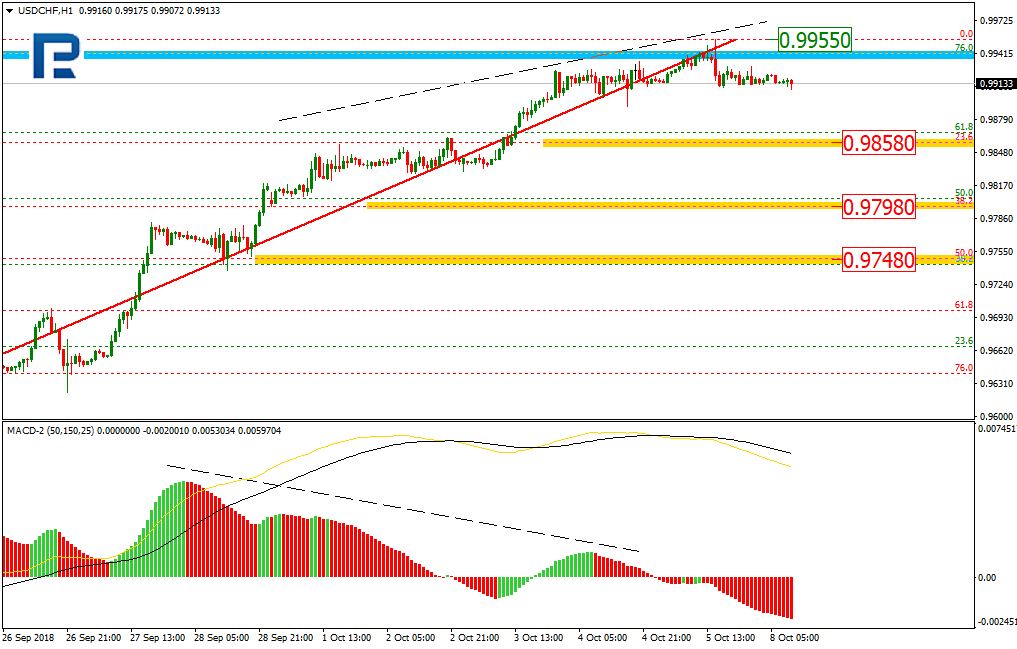
In the H1 chart, the divergence made USDCHF start a new decline. The possible targets ate the retracements of 23.6%, 38.2% and 50.0% at 0.9858, 0.9798, and 0.9748 respectively.
Attention! Forecasts presented in this section only reflect the author’s private opinion and should not be considered as guidance for trading. RoboForex LP bears no responsibility for trading results based on trading recommendations described in these analytical reviews.
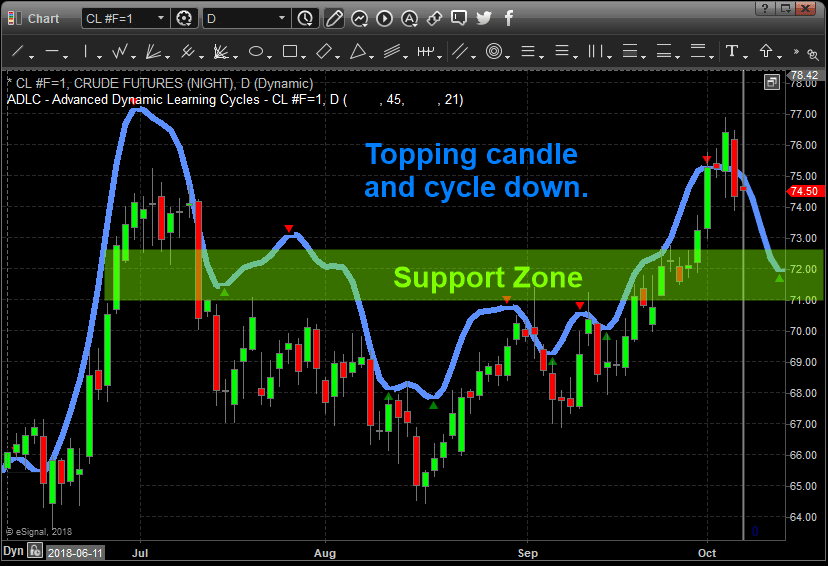
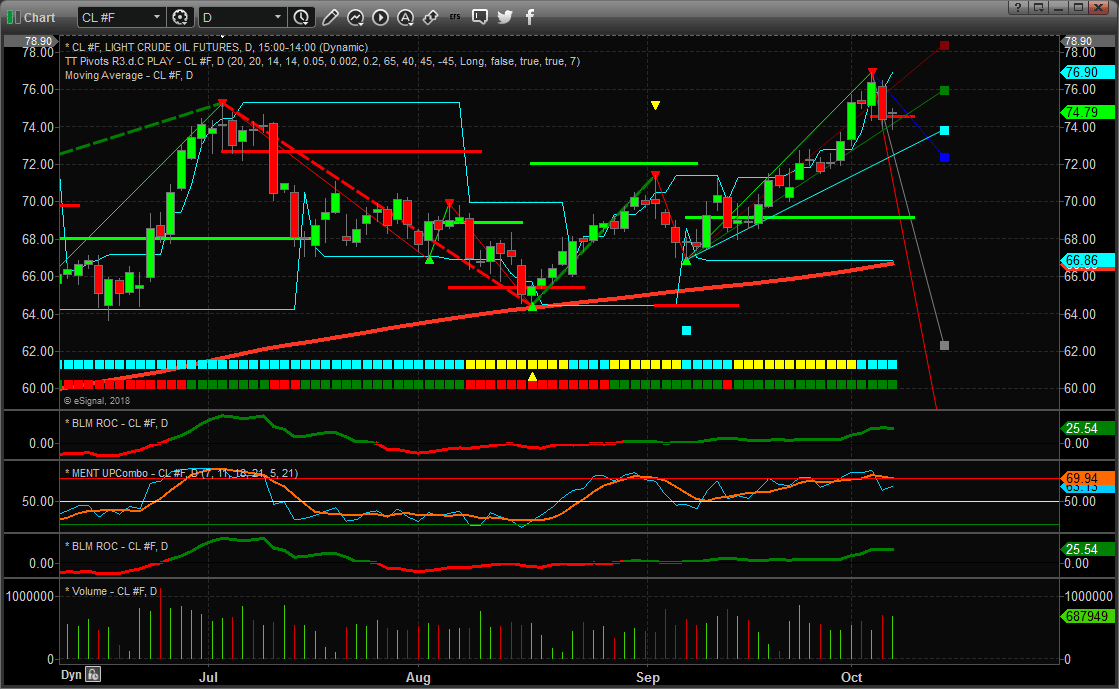
Our research team, at Technical Traders Ltd., has been very interested in Oil recently as the current rally appears to have rotated lower near a top. Our predictive modeling systems, predictive cycle analysis and other tools suggest Oil/Energy may be setting up for a downward price trend. This may be an excellent opportunity for skilled traders to identify profitable trades as this trend matures.
This Daily Crude Oil Chart shows our Predictive Cycle Modeling system and shows the projected price cycles out into the future. One can see the downside projected price levels very clearly. This cycle analysis tool does not predict price levels, it just predicts price trends. We can’t look at this indicator and think that $72 ppb is a price target (near the right side). We can only assume that a downward price cycle is about to hit and use historical price as a guide to where price may attempt to fall to.
Using our adaptive Fibonacci price modeling tool, we can see from the chart below that downside price targets are currently near $72 ppb, $67 ppb and $65 ppb. Therefore, we believe the $72 price level will become the first level of support, where our price cycle tool suggests a small rotation may occur, and the $67 price level may become the ultimate downside target level.
We believe the current price rotation in Oil/Energy may be setting up for a decent downside price move with a lower price target at or below $67 ppb. Historical data shows that this type of price action, downward, at this time is historically accurate and predictable. If you want to know how you can profit from this move and learn how our research team continues to find and execute superior trades for our members, visit www.TheTechnicalTraders.com to learn more.
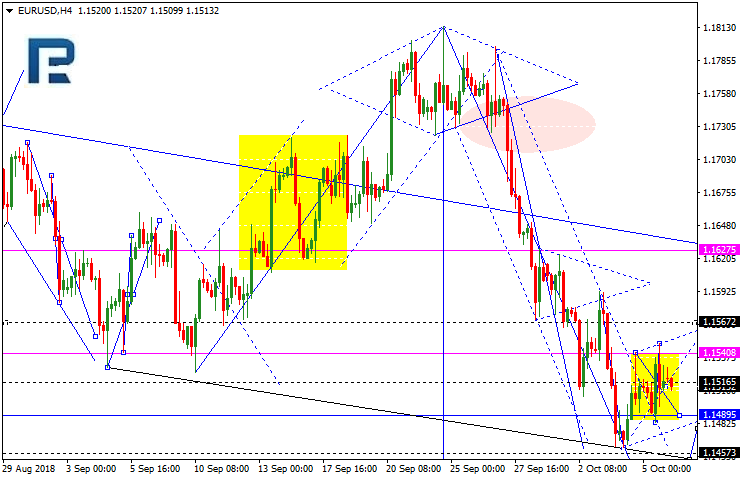
EURUSD has finished the ascending impulse and right now is consolidating around 1.1516. If later the instrument breaks this range to the downside, the price may resume trading inside the downtrend towards 1.1447; if to the upside – continue the correction to reach 1.1567.
GBPUSD, “Great Britain Pound vs US Dollar”
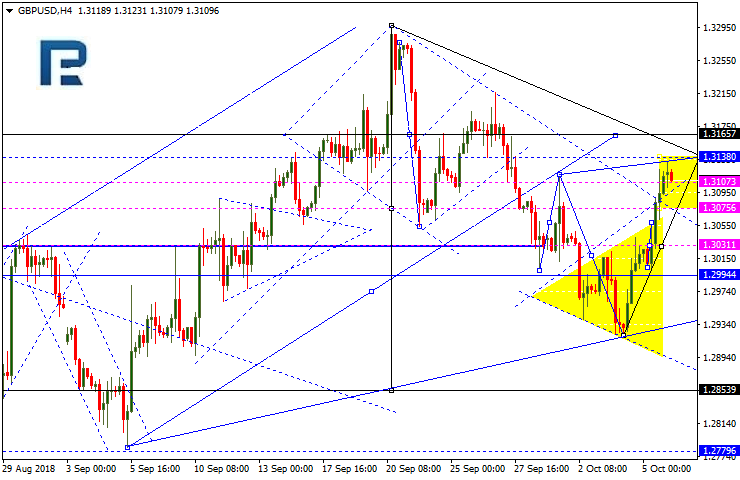
GBPUSD has broken the consolidation range upwards and right now is still being corrected. The target is at 1.3138. Later, the market may fall to reach 1.3030, thus forming a new consolidation range. If later the instrument breaks this range to the downside, the price may resume trading inside the downtrend towards 1.2855; if to the upside – continue the correction to reach 1.3167.
USDCHF, “US Dollar vs Swiss Franc”
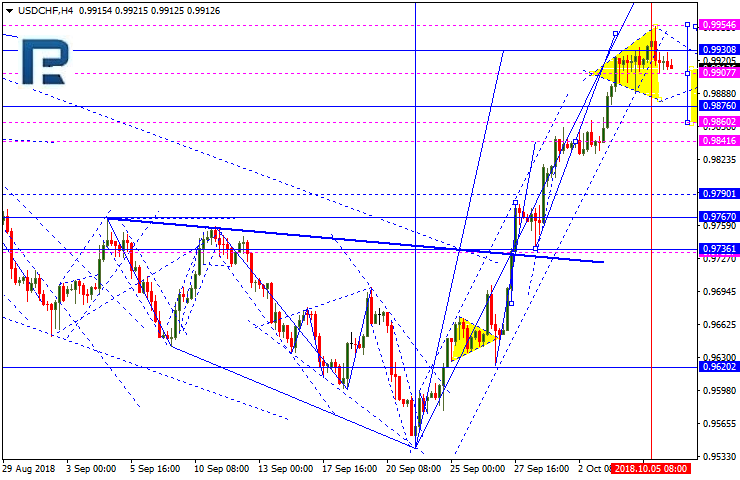
USDCHF is moving downwards. Possibly, today the pair may fall to reach 0.9860 and then return to 0.9910, thus forming a new consolidation range. If the instrument breaks this range to the downside, the price may start another decline towards 0.9767 and then move upwards with the target at 0.9990.
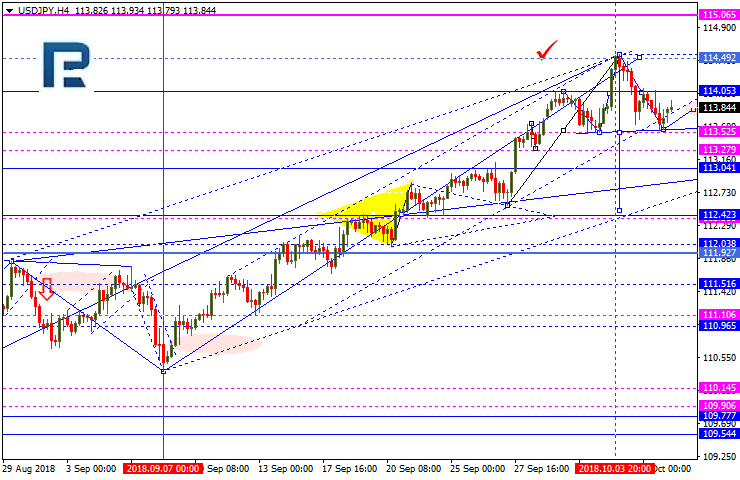
USDJPY, “US Dollar vs Japanese Yen”
USDJPY has completed the first descending wave; right now, it is trading upwards with the target at 114.05 and forming a new descending structure. If the instrument breaks 114.20 to the downside, the price may start another decline towards 112.42; if to the upside – resume trading inside the uptrend to reach 115.05.
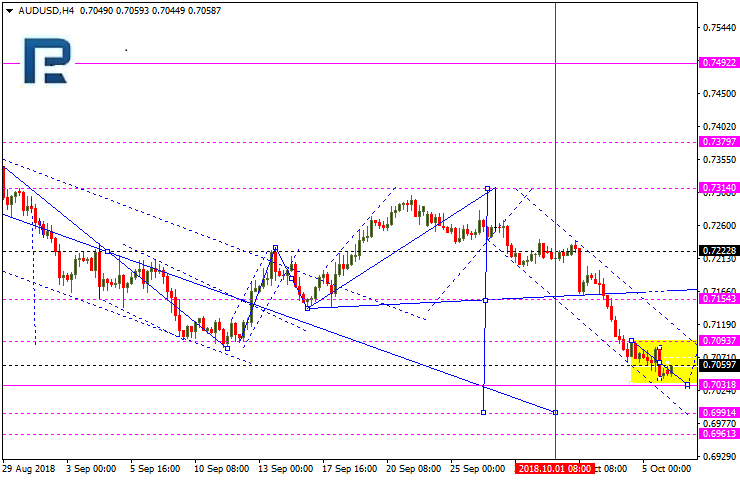
AUDUSD, “Australian Dollar vs US Dollar”
AUDUSD is still consolidating near the lows. Today, the pair may fall to reach 0.7031 and then grow towards 0.7093, thus forming a new consolidation range. If later the instrument breaks this range to the downside, the price may resume trading inside the downtrend with the target at 0.7000; if to the upside – continue trading upwards to reach 0.7154.
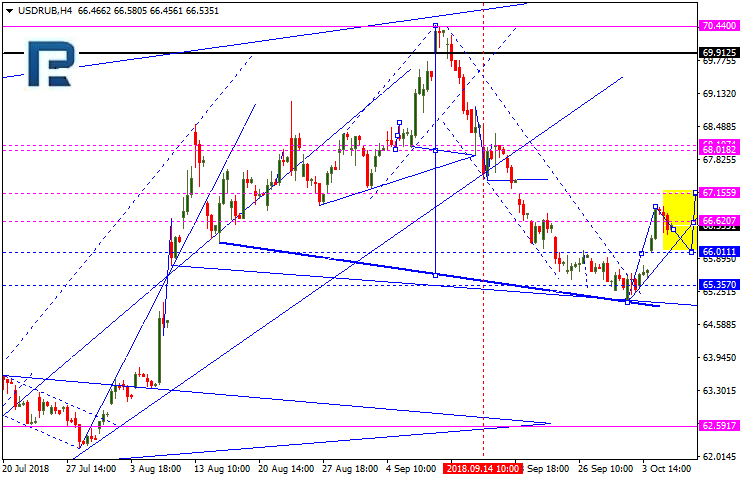
USDRUB, “US Dollar vs Russian Ruble”
USDRUB is consolidating around 66.50. Possibly, today the pair may fall towards 66.01 and then grow to reach 67.15. Later, the market may resume falling with the target at 66.60. If later the instrument breaks this range to the upside, the price may resume growing towards 68.10; if to the downside – continue trading inside the downtrend with the target at 65.35.
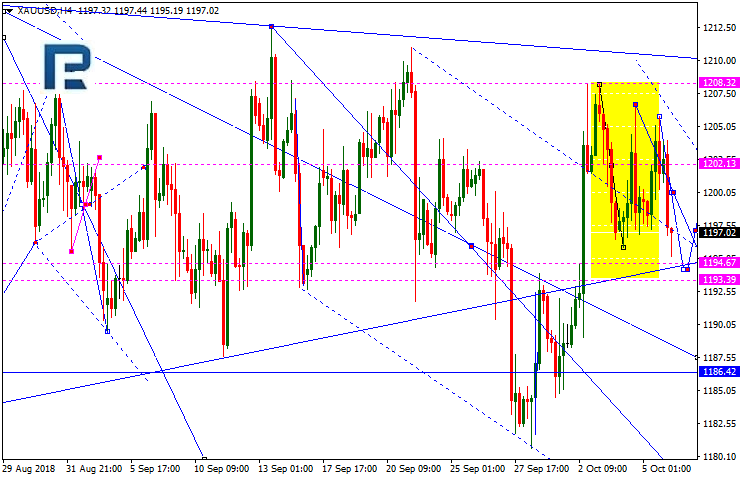
XAUUSD, “Gold vs US Dollar”
Gold is moving downwards with the target at 1194.00. After that, the instrument may grow to reach 1202.00 and then start a new descending wave towards the short-term target at 1187.00.
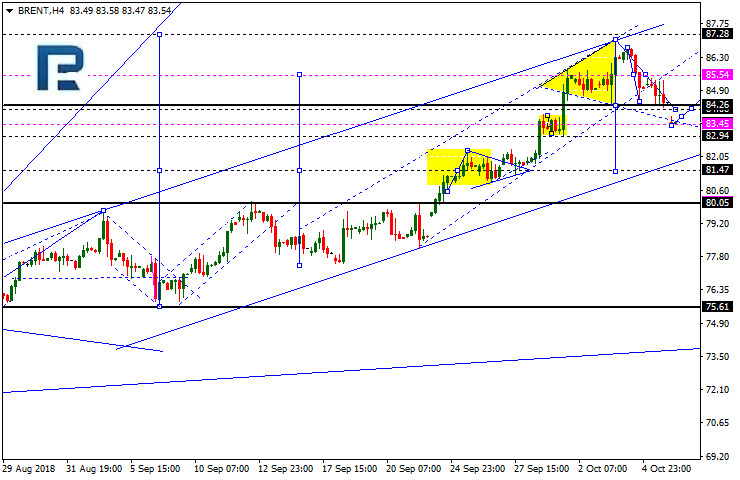
BRENT
Brent has completed the first descending impulse. Today, the pair may grow towards 85.55 and then fall with the short-term target at 82.92.
Attention! Forecasts presented in this section only reflect the author’s private opinion and should not be considered as guidance for trading. RoboForex LP bears no responsibility for trading results based on trading recommendations described in these analytical reviews.
On Friday, there was a variety of trends on the EUR/USD currency pair. Mixed data on the US labor market for September were published. Thus, the number of people employed in the nonfarm sector slowed down to 134K, while investors expected a value of 185K. The growth of average hourly wages met market expectations and counted to 0.3% (m/m). Meanwhile, the unemployment rate fell from 3.9% to 3.7%. At the moment, the key support and resistance levels are: 1.14800 and 1.15200, respectively. Positions should be opened from these marks.
The news feed on the economy of the Eurozone and the US is calm.
The price has fixed below 50 MA and 200 MA, which indicates the power of sellers.
The MACD histogram has moved into the negative zone, which signals the bearish sentiment.
The Stochastic Oscillator is in the oversold zone, the %K line is crossing the %D line. There are no accurate signals.
Trading recommendations
Support levels: 1.14800, 1.14400
Resistance levels: 1.15200, 1.15600, 1.16000
If the price fixes above the resistance level of 1.15200, the EUR/USD quotes are expected to grow. The movement is tending to 1.15600-1.16000.
An alternative may be a further decrease in the EUR/USD currency pair to the level of 1.14400-1.14200.
The GBP/USD currency pair
Technical indicators of the currency pair:
Prev Open: 1.30190
Open: 1.31169
% chg. over the last day: +0.79
Day’s range: 1.30677 – 1.30843
52 wk range: 1.2361 – 1.4345
On Friday, aggressive purchases were observed on the GBP/USD currency pair. The British pound strengthened against the US dollar after statements by the EU’s chief negotiator, Michel Barnier, that they were ready to offer the UK a “unique” deal that was better and more beneficial than the previous one. At the moment, quotes are declining. The key support and resistance levels are: 1.30500 and 1.31000, respectively. Positions should be opened from these marks.
Today, the news feed on the UK economy is calm.
Indicators do not send accurate signals: 50 MA has crossed 200 MA.
The MACD histogram is in the positive zone, but below the signal line, which gives a weak signal to buy GBP/USD.
The Stochastic Oscillator is in the oversold zone, the %K line is crossing the %D line. There are no accurate signals.
Trading recommendations
Support levels: 1.30500, 1.30000, 1.29600
Resistance levels: 1.31000, 1.31400, 1.31800
If the price fixes below the “mirror” support of 1.30500, it is necessary to consider sales of GBP/USD. The movement is tending to the round level of 1.30000.
An alternative may be the growth of the GBP/USD currency pair to the level of 1.31000-1.31300.
The USD/CAD currency pair
Technical indicators of the currency pair:
Prev Open: 1.29207
Open: 1.29441
% chg. over the last day: +0.09
Day’s range: 1.29905 – 1.29910
52 wk range: 1.2059 – 1.3795
The USD/CAD currency pair continues to show positive dynamics. During Friday’s and today’s trading, the growth of quotes have counted to more than 80 points. At the moment, the trading instrument is testing the round level of 1.30000. The key support is the 1.29600 mark. Positions should be opened from these marks. The USD/CAD currency pair has the potential for further growth.
The news feed on the economy of Canada is calm.
The price has fixed above 50 MA and 200 MA, which indicates the power of buyers.
The MACD histogram is in the positive zone, above the signal line, which gives a strong signal to buy USD/CAD.
The Stochastic Oscillator is in the overbought zone, the %K line is crossing the %D line. There are no accurate signals.
Trading recommendations
Support levels: 1.29600, 1.29150, 1.28700
Resistance levels: 1.30000, 1.30400, 1.30800
If the price fixes above the resistance level of 1.30000, further growth of the USD/CAD currency pair is expected. The movement is tending to 1.30400-1.30600.
Alternative option. If the price fixes below 1.29600, it is necessary to consider sales of USD/CAD. The movement is tending to 1.29200-1.29000.
The USD/JPY currency pair
Technical indicators of the currency pair:
Prev Open: 113.868
Open: 113.780
% chg. over the last day: -0.18
Day’s range: 113.703– 113.746
52 wk range: 104.56 – 114.74
There is a variety of trends on the USD/JPY currency pair. Investors expect additional drivers. At the moment, the trading instrument is moving in flat. Local support and resistance levels are: 113.600 and 113.900, respectively. Positions should be opened from these marks. In the near future, technical correction of the USD/JPY quotes after a prolonged rally is not excluded.
The news feed on the economy of Japan is quite calm.
Indicators do not give accurate signals. Price has crossed 200 MA.
The MACD histogram is in the negative zone and continues to decline, which indicates the bearish sentiment.
Stochastic Oscillator is in the oversold zone, the %K line is below the %D line, which gives a weak signal to sell USD/JPY.
Trading recommendations
Support levels: 113.600, 113.300, 113.000
Resistance levels: 113.900, 114.200, 114.500
If the price fixes below the support level of 113.600, the USD/JPY currency pair is expected to decline. The movement is tending to 113.300-113.000.
An alternative may be the growth of the USD/JPY quotes to the level of 114.000-114.200.
At the end of last week, the US dollar weakened slightly against the basket of major currencies. On Friday, mixed data on the US labor market for September were published. Thus, the number of people employed in the nonfarm sector slowed down to 134K, while investors expected a value of 185K. The growth of average hourly wages met market expectations and counted to 0.3% (m/m). Meanwhile, the unemployment rate fell from 3.9% to 3.7%. The US dollar index (#DX) closed in the negative zone (-0.10%). In general, the demand for the US currency is still high.
The British pound strengthened against the US dollar after statements by the EU’s chief negotiator, Michel Barnier, that they were ready to offer the UK a “unique” deal that was better and more beneficial than the previous one. However, it is not yet known whether Theresa May agrees to the new conditions.
The “black gold” prices have been declining. At the moment, futures for the WTI crude oil are testing a mark of $73.75 per barrel.
Market Indicators
On Friday, aggressive sales were observed in the US stock market: #SPY (-0.56%), #DIA (-0.72%), #QQQ (-1.22%).
At the moment, the 10-year US government bonds yield is at the level of 3.23-3.24%.
The news feed on 2018.10.08:
Today, the publication of important economic news is not expected.
Almost all major currencies showed a decline last week. The biggest decline against the US dollar was shown by the New Zealand dollar (-2.70%) and the Australian dollar (-2.41%). The following currencies recorded smaller declines: the Swiss franc (-1.01%), the euro (-0.72%), the Canadian dollar (-0.24%), and the Japanese yen (-0.02%). Only the British pound (+0.64%) rose in price. At the end of Friday, the main pairs showed mixed dynamics.
Fig 1. USD weekly dynamics.
On Friday, all eyes were on the US jobs report. The unemployment numbers for September turned out to be below market expectations, however, the figures for the two previous months were revised upwards. In addition, the unemployment rate fell to 3.7% and reached a 48-year low, which pleased Donald Trump. The growth rate of salaries coincided with market expectations.
In September, 134 thousand new jobs were created in the US non-farm sector, against the forecast of 185 thousand. The figure for August was revised from 201 thousand to 270 thousand, and in July from 147 thousand to 165 thousand. The total revision for the two months amounted to +87 thousand. And 134 thousand + 87 thousand gives us 221 thousand. This comes in at over 185 thousand.
The unemployment rate fell to 3.7% from 3.9% (previous forecast: 3.8%). The number of working-age population remained at the level of 62.7%. Hourly earnings rose by 0.3% m/m against the forecast of 0.3% and a previous value of 0.3% (revised from 0.4%).
The euro responded to the report by rising to 1.1550. The price, having held above 1.1500 for about an hour and a half, returned back to 1.498. Market participants chose not to pay attention to the lowering of the main indicator to 134 thousand, and still expect further rate hikes.
Day’s news (GMT+3):
9:00 Germany: industrial production s.s.a. w.d.a. (YoY) (Aug).
11:30 Eurozone: Sentix investor confidence (Oct).
24hr Japan: Health-Sports Day.
24hr Canada: Thanksgiving Day.
Fig 2. EURUSD hourly chart
Current situation:
After the publication of the session trend did not work, the price went up from the 45th degree by 45 degrees. The price is on the lb balance line. According to the price model from 1.1463 to the last bar, there is only one route – to update the minimum. Considering that today there is a pretty bleak news cycle, with trading in Canada and Japan closed today, and the line of the rising channel passing though the 45th degree, I would venture to suggest that on Monday the price will continue to trade inside this channel. If the price goes down from the ascending channel, then you should keep the level of 1.1470 as a target.
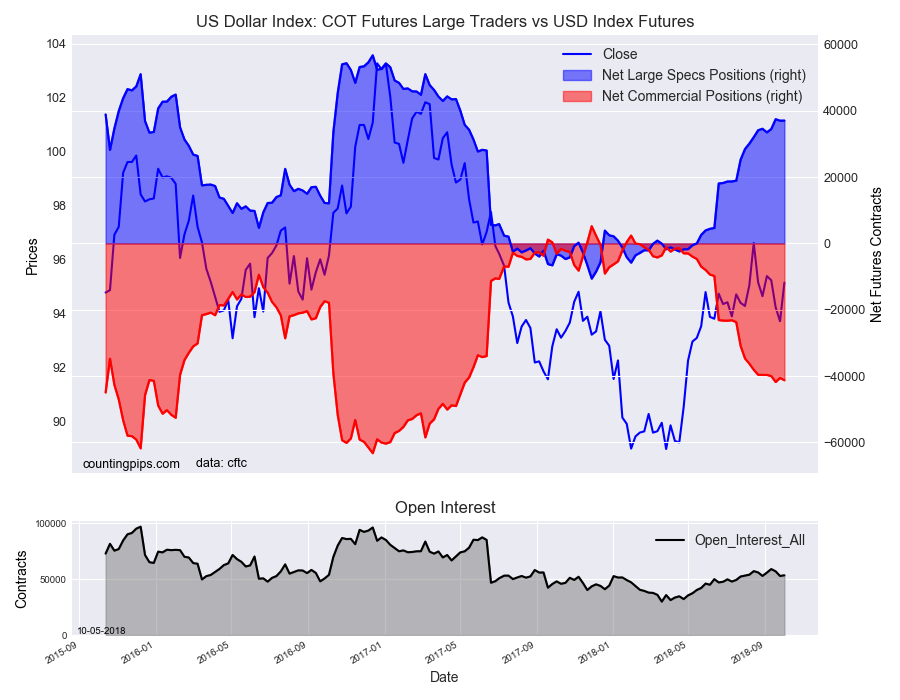
US Dollar Index bets gain for 22nd out of the past 24 weeks
The latest data for the weekly Commitment of Traders (COT) report, released by the Commodity Futures Trading Commission (CFTC) on Friday, showed that large traders and speculators slightly added to their bullish bets for the US Dollar Index while sharply betting against the euro and the Japanese yen this week. See full article
The non-commercial contracts of WTI crude futures totaled a net position of 548,909 contracts, according to data from this week. This was a slide of -11,176 contracts from the previous weekly total. See full article
The large speculator contracts of gold futures totaled a net position of -21,822 contracts. This was a weekly decline of -4,174 contracts from the previous week. See full article
The large speculator contracts of 10-year treasury note futures totaled a net position of -740,192 contracts. This was a weekly increase of 16,124 contracts from the previous week. See full article
The large speculator contracts of S&P500 Mini futures totaled a net position of 228,035 contracts. This was a rise of 30,119 contracts from the reported data of the previous week. See full article
The non-commercial contracts of silver futures totaled a net position of -17,498 contracts, according to data from this week. This was a weekly gain of 5,757 contracts from the previous totals. See full article
The large speculator contracts of copper futures totaled a net position of 11,975 contracts. This was a weekly boost of 871 contracts from the data of the previous week. See full article
The Commitment of Traders report data is published in raw form every Friday by the Commodity Futures Trading Commission (CFTC) and shows the futures positions of market participants as of the previous Tuesday (data is reported 3 days behind).
US Dollar Index Non-Commercial Speculator Positions:
The latest data for the weekly Commitment of Traders (COT) report, released by the Commodity Futures Trading Commission (CFTC) on Friday, showed that large traders and speculators slightly added to their bullish bets for the US Dollar Index while sharply betting against the euro and the Japanese yen this week.
The non-commercial futures contracts of US Dollar Index futures, traded by large speculators and hedge funds, totaled a net position of 37,036 contracts in the data reported through Tuesday October 2nd. This was a weekly increase of 27 contracts from the previous week which had a total of 37,009 net contracts.
US Dollar Index speculators slightly edged their bets higher this week and have now increased their bets for twenty-two out of the past twenty-four weeks. The current standing is above the +37,000 net contract level for a third straight week and above the +30,000 contract level for a ninth straight week.
Aggregate US Dollar Position goes higher this week
US Dollar net speculator positions rose to $26.68 billion this week
An aggregate measure of the US dollar position – the total of US dollar contracts against the combined contracts of the euro, British pound, Japanese yen, Australian dollar, Canadian dollar and the Swiss franc – rose to an overall US dollar net position totaling $26.68 billion as of Tuesday October 2nd, according to the latest data from the CFTC and dollar amount calculations by Reuters. This was a weekly rise of $3.51 billion from the $23.17 billion total position that was registered the previous week, according to the Reuters calculation.
The aggregate dollar position has now risen for three straight weeks and by a total of $7.52 billion over that span. The current level is at the highest standing since December 13th of 2016 when the aggregate totaled $28.01 billion.
Individual Currencies Data this week:
In the individual currency contracts data, we saw three substantial changes (+ or – 10,000 contracts) in the speculators category.
Euro speculators pushed their net position back into bearish territory this week as bets fell by -10,797 contracts. This is the first bearish standing for the euro since the end of August.
Japanese yen speculators boosted their bearish bets for the fifth straight week and by over -20,000 bets for the second straight week. The current standing for the yen has now fallen to the most bearish level since February 13th of this year when the net position totaled -115,509 contracts
Mexican peso bullish bets continued their upward trajectory and rose by over +20,000 contracts this week – the third straight week of at least +10,000 contract gains. The current net position overall has increased for four straight weeks and is at the highest bullish level since May 8th
The major currencies that improved this week were the British pound sterling (7,738 weekly change in contracts), US Dollar Index (27 contracts), Swiss franc (2,681 contracts), Canadian dollar (1,048 contracts), Australian dollar (343 contracts), New Zealand dollar (1,239 contracts) and the Mexican peso (22,431 contracts).
The currencies whose speculative bets declined this week were the euro (-10,797 weekly change in contracts) and the Japanese yen (-29,327 contracts).
See the table and individual currency charts below.
Table of Weekly Commercial Traders and Speculators Levels & Changes:
Currency
Net Commercials
Comms Weekly Chg
Net Speculators
Specs Weekly Chg
EuroFx
-9,500
27,230
-7,101
-10,797
GBP
78,665
-9,762
-59,340
7,738
JPY
136,000
22,843
-114,046
-29,327
CHF
23,096
1,573
-13,402
2,681
CAD
10,287
-6,244
-18,484
1,048
AUD
90,247
-3,264
-71,718
343
NZD
35,295
-231
-30,596
1,239
MXN
-77,247
-21,611
73,829
22,431
This latest COT data is through Tuesday and shows a quick view of how large speculators or non-commercials (for-profit traders) as well as the commercial traders (hedgers & traders for business purposes) were positioned in the futures markets. All currency positions are in direct relation to the US dollar where, for example, a bet for the euro is a bet that the euro will rise versus the dollar while a bet against the euro will be a bet that the dollar will gain versus the euro.
Weekly Charts: Large Trader Weekly Positions vs Price
EuroFX:
British Pound Sterling:
Japanese Yen:
Swiss Franc:
Canadian Dollar:
Australian Dollar:
New Zealand Dollar:
Mexican Peso:
*COT Report: The weekly commitment of traders report summarizes the total trader positions for open contracts in the futures trading markets. The CFTC categorizes trader positions according to commercial hedgers (traders who use futures contracts for hedging as part of the business), non-commercials (large traders who speculate to realize trading profits) and nonreportable traders (usually small traders/speculators). Find CFTC criteria here: (http://www.cftc.gov/MarketReports/CommitmentsofTraders/ExplanatoryNotes/index.htm).
The Commitment of Traders report is published every Friday by the Commodity Futures Trading Commission (CFTC) and shows futures positions data that was reported as of the previous Tuesday (3 days behind).
Each currency contract is a quote for that currency directly against the U.S. dollar, a net short amount of contracts means that more speculators are betting that currency to fall against the dollar and a net long position expect that currency to rise versus the dollar.
(The charts overlay the forex closing price of each Tuesday when COT trader positions are reported for each corresponding spot currency pair.) See more information and explanation on the weekly COT report from the CFTC website.
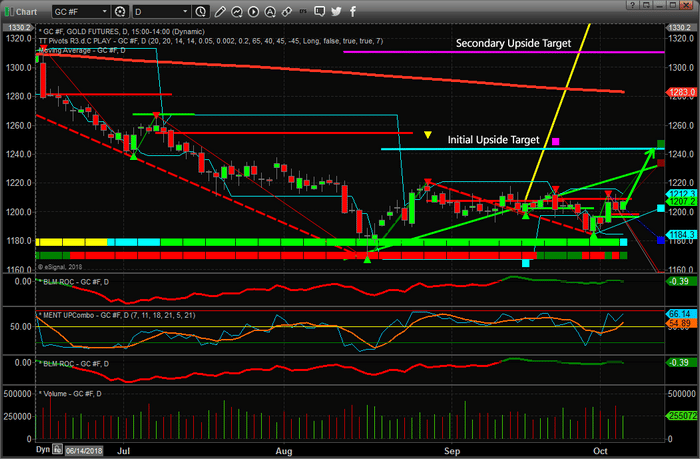
Our modeling systems are suggesting that Gold and Silver will begin a new upside rally very quickly. We wrote about how our modeling systems are suggesting this upside move could be a tremendous opportunity for investors over 2 weeks ago. Our initial target is near the $1245 level and our second target is near the $1309 level. Recent lows help to confirm this upside projection as the most recent low prices created a price rotation that supports further upside price action. What is needed right now is a push above $1220 before we begin to see the real acceleration higher.
The Daily Gold chart, below, shows our Fibonacci modeling system suggesting that $1235 to $1250 are the upside target ranges. Near these levels, we should expect some price rotation before another leg higher begins. Currently, support near $1180 is the floor in Gold.
If you are a fan of the shiny metals and want to know what we believe is likely to happen over the next 8+ months, then please take a moment to join the Wealth Building Newsletter to learn how we can help you find and execute better trades. We provide even more detailed research and predictive price modeling for our subscribers and we believe this bottom setting up in Gold may be the last time you see $1200 prices for a while. Check out www.TheTechnicalTraders.com today.
As we can see in the H4 chart, after reaching the retracement of 50.0%, BTCUSD has started consolidating in the form of the Triangle pattern. If the instrument breaks this pattern to the upside, the price may grow to reach the retracements of 61.8% and 76.0% at 6911.00 and 7093.00 respectively; if to the downside – trade downwards to test the low at 6102.20.
In the H1 chart, the pair is trading between the support and resistance levels at 6411.10 and 6755.65 respectively.
ETHUSD, “Ethereum vs. US Dollar”
As we can see in the H4 chart, after reaching the retracement of 23.6%, ETHUSD started consolidating in the form of the Triangle pattern and has already reached the retracement of 50.0%. If the instrument breaks this pattern to the downside, the price may continue falling towards the next downside targets, which may be the retracements of 61.8% and 76.0% at 200.45 and 187.75 respectively; if to the upside – trade upwards to break the high at 254.14 and then the retracement of 38.2% at 300.00.
In the H1 chart, the pair is trading between the resistance and support levels at 233.70 and 210.60 respectively.
Attention! Forecasts presented in this section only reflect the author’s private opinion and should not be considered as guidance for trading. RoboForex LP bears no responsibility for trading results based on trading recommendations described in these analytical reviews.