Author Archive for InvestMacro – Page 348

How Long Will the Market Keep Its Momentum?

By Amram Margalit – Leverate

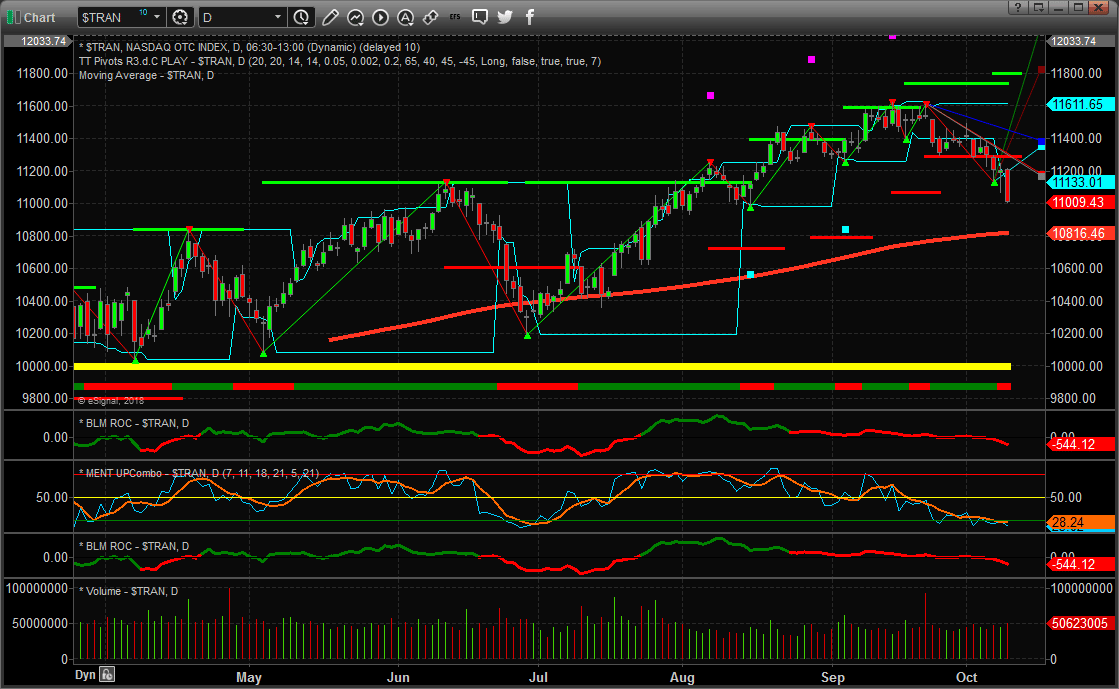
On Thursday, September 20th 2018, the S&P 500 Index hit a new record high, and as soon as it did, the naysayers crawled out of the woodwork. “It’s too high…it can only go down from here!”. So, whither goest this runaway stock market train?

Any technical trader who earned their living buying and selling any financial commodity in the 1980s would probably recall the name J. Peter Steidlmayer. Steidlmayer’s claim to fame was inventing a statistical trading technique called Market Profile, which enabled financial market traders to identify market strength and direction building up over time. This technique used half-hour time packets that were mapped onto a bar chart indicating whether a market was moving or consolidating, and it was very popular at the time.

One of Steidlmayer’s other pearls of wisdom was that when markets made new highs—you bought! Just think about it. Someone out there has bought something at a price where it has never traded before. What should that be telling you? And, of course, the inverse applies to markets making new lows—don’t fall into the trap of thinking, “It can only go up from here”. New lows mean: Sell it!

While such contra-intuitive reactions may seem to be psychologically, and fundamentally ill advised, the facts speak for themselves. Markets reach new highs not because there are more buyers than sellers, but because of the “aggressiveness” of the bulls outpacing the waning commitment of the bears.

Of course, market direction can change at any time, and no trader should be so bold, or arrogant, to suggest that a trend will continue forever. But, the trend is always your friend, and while you’re on the right side of it, you should stay with it. It’s a bit like surfing. You find a wave, jump on your board, and you ride! You have no idea how long the run will last, but you stay with it for as long as you can. And you certainly don’t jump off just because you think it’s been going on for too long.

It’s almost laughable how houses like the great Morgan Stanley or CSFB should come out with predictions of market direction months into the future. Yes, they have their fingers on the pulse when it comes to market data, but they cannot predict the future of the potential financial, social, or political upheaval to come. They just can’t, and history proves this to be the case. Who could have predicted the Arab Spring? Or the rise of Donald Trump? Or the visit of North Korea’s Kim Jong-un to the White House?

Fundamental and technical analysts jump on the bandwagon when markets reach extreme highs or lows, and the best advice is just to ignore them. As long as you are performing your own analysis, preferably following chart patterns and simple computerized statistical analysis, you will call the market correctly at least five times out of ten. And, providing you are following sound money management principles, such as cutting your losses short, then you will make money in the long run.

About the Author:

Amram Margalit is a professional writer who has worked in a wide range of settings, including technology companies, nonprofits, and the entertainment industry. Within these positions, Amram has provided quality content and advertising services and is currently the Content Manager at Leverate.


Transportation Breakdown Hinting to Global to Economic Weakness?

By TheTechnicalTraders.com

Our research team highlighted the recent breakdown in the Transportation Index ($TRAN) as a very strong sign that the global economy and US economy may be starting to show early signs of weakness.

The Transportation Index typically leads the markets by about 3 to 6 months (on average).  When we see a big breakdown in the Transportation index, as we’ve seen recently, it immediately raises red flags that one or more component of the global markets may be crashing.  At this point in the Seasonal Cycle, one could expect the Transportation Index to rotate lower a bit.  Our concern is that global economic factors may be driving China and other markets into much deeper corrections – which could cause the US and other world markets to correct a bit further.

The recent price rotation is shown near the right side of this Daily Transportation Index clearly shows the recent downtrend and the current breakdown in price.  This price breakdown cleared recent support near 11,290 and is currently resting near another support level near 10,980.  Any further breakdown of the Transportation Index below the 10,980 level would suggest we could be looking at a very deep -10% to -15% price move.

Our research team will continue to monitor the Transportation Index, and all the other major US and Foreign markets, for additional signs of strength or weakness in the future.  Right now, be prepared for what may become further price weakness in the US Indices as this breakdown in the Transportation Index suggests.  Visit TheTechnicalTraders.com to learn more about our services for skilled traders and to see how we can help you navigate these markets.

Chris Vermeulen


Japanese Candlesticks Analysis 09.10.2018 (USDCAD, AUDUSD)

Article By RoboForex.com

USDCAD, “US Dollar vs Canadian Dollar”

As we can see in the H4 chart, USDCAD is still moving upwards and forming Doji, Harami, and Engulfing reversal patterns during slight pullbacks. Judging by the previous movements, right now it may be assumed that the instrument may complete this pullback and then start a new ascending movement.

USDCAD
Risk Warning: the result of previous trading operations do not guarantee the same results in the future


AUDUSD, “Australian Dollar vs US Dollar”

As we can see in the H4 chart, AUDUSD is still falling and forming Hammer, Inverted Hammer, and Engulfing reversal patterns. Right now, the pair is being corrected again. Judging by the previous movements, it may be assumed that the instrument may complete the correction and then continue moving inside the downtrend.

AUDUSD
Risk Warning: the result of previous trading operations do not guarantee the same results in the future

Article By RoboForex.com

Attention!
Forecasts presented in this section only reflect the author’s private opinion and should not be considered as guidance for trading. RoboForex LP bears no responsibility for trading results based on trading recommendations described in these analytical reviews.

Ichimoku Cloud Analysis 09.10.2018 (AUDUSD, NZDUSD, USDCAD)

Article By RoboForex.com

AUDUSD, “Australian Dollar vs US Dollar”

AUDUSD is trading at 0.7081; the instrument is moving below Ichimoku Cloud, thus indicating a descending tendency. The markets could indicate that the price may test Tenkan-Sen and Kijun-Sen at 0.7110 and then resume moving downwards to reach 0.6970. Another signal to confirm further descending movement is the price’s rebounding from the resistance level. However, the scenario that Implies further decline may be cancelled if the price breaks the upside border of the cloud and fixes above 0.7185. In this case, the pair may continue growing towards 0.7245.

AUDUSD
Risk Warning: the result of previous trading operations do not guarantee the same results in the future


NZDUSD, “New Zealand Dollar vs US Dollar”

NZDUSD is trading at 0.6447; the instrument is moving below Ichimoku Cloud, thus indicating a descending tendency. The markets could indicate that the price may test Tenkan-Sen and Kijun-Sen at 0.6455 and then resume moving downwards to reach 0.6350. Another signal to confirm further descending movement is the price’s rebounding from the channel’s upside border. However, the scenario that Implies further decline may be cancelled if the price breaks the upside border of the cloud and fixes above 0.6565. In this case, the pair may continue growing towards 0.6665.

NZDUSD
Risk Warning: the result of previous trading operations do not guarantee the same results in the future


USDCAD, “US Dollar vs Canadian Dollar”

USDCAD is trading at 1.2959; the instrument is moving above Ichimoku Cloud, thus indicating an ascending tendency. The markets could indicate that the price may test the upside border of the cloud at 1.2935 and then continue moving upwards to reach 1.3095. However, the scenario that implies further growth may be cancelled if the price breaks the downside border of the cloud and fixes below 1.2855. In this case, the pair may continue falling towards 1.2765. After breaking the channel’s upside border and fixing above 1.2995, the price may continue moving upwards.

USDCAD
Risk Warning: the result of previous trading operations do not guarantee the same results in the future

Article By RoboForex.com

Attention!
Forecasts presented in this section only reflect the author’s private opinion and should not be considered as guidance for trading. RoboForex LP bears no responsibility for trading results based on trading recommendations described in these analytical reviews.

The Analytical Overview of the Main Currency Pairs on 2018.10.09

Analytics by JustForex

The EUR/USD currency pair

Technical indicators of the currency pair:
  • Prev Open: 1.15225
  • Open: 1.14853
  • % chg. over the last day: -0.26
  • Day’s range: 1.14653 – 1.15027
  • 52 wk range: 1.0571 – 1.2557

Yesterday, the bearish sentiment prevailed on the EUR/USD currency pair. Tensions about the fiscal policy of Italy have again escalated. Additional pressure on the euro is put by weak statistics on the volume of industrial production in Germany. At the moment, the EUR/USD quotes are consolidating in the range of 1.14600-1.15000. The trading instrument is tending to further decline. Positions must be opened from the key levels.

Today, the news feed in the eurozone and the US is calm. The publication of important economic reports is not planned.

EUR/USD

Indicators point to the power of sellers: the price has fixed below 50 MA and 200 MA.

The MACD histogram is in the negative zone and continues to decline, which signals the bearish sentiment.

Stochastic Oscillator is in the neutral zone, the %K line is below the %D line, which also sends a signal to sell EUR/USD.

Trading recommendations
  • Support levels: 1.14600, 1.14000
  • Resistance levels: 1.15000, 1.15300, 1.15850

If the price fixes below the support level of 1.14600, a further decline in the EUR/USD currency pair is expected. The movement is tending to 1.14200-1.14000.

An alternative could be the growth of the EUR/USD quotes to the level of 1.15300-1.15500.

The GBP/USD currency pair

Technical indicators of the currency pair:
  • Prev Open: 1.31196
  • Open: 1.30789
  • % chg. over the last day: -0.26
  • Day’s range: 1.30730 – 1.31059
  • 52 wk range: 1.2361 – 1.4345

Since the beginning of this week, trading on the GBP/USD currency pair is very active. However, a unidirectional trend is not observed. At the moment, the key support and resistance levels are 1.30600 and 1.31000, respectively. Investors are awaiting new information regarding the Brexit process. We recommend opening positions from the key levels.

The news feed on the UK economy is calm.

GBP/USD

Indicators do not send accurate signals: the price has crossed 50 MA and 200 MA.

The MACD histogram is in the positive zone, but below the signal line, which gives a weak signal to buy GBP/USD.

Stochastic Oscillator is in the neutral zone, the %K line is below the %D line, which indicates the bearish sentiment.

Trading recommendations
  • Support levels: 1.30600, 1.30150, 1.29600
  • Resistance levels: 1.31000, 1.31300, 1.31750

If the price fixes above the round level of 1.31000, the GBP/USD quotes are expected to grow. The movement is tending to 1.31300-1.31500.

Alternative option. If the price fixes below 1.30600, we recommend looking for entry points to the market to open short positions. The movement is tending to 1.30150-1.30000.

The USD/CAD currency pair

Technical indicators of the currency pair:
  • Prev Open: 1.29441
  • Open: 1.29476
  • % chg. over the last day: +0.07
  • Day’s range: 1.29905 – 1.29730
  • 52 wk range: 1.2059 – 1.3795

Yesterday, the USD/CAD currency pair moved away from monthly highs. At the moment, the technical pattern is ambiguous. Financial market participants expect additional drivers. The USD/CAD quotes are consolidating in the range of 1.29500-1.29800. We recommend opening positions from these marks.

The news feed on the economy of Canada:
  • – The volume new home construction at 15:15 (GMT+3:00).
USD/CAD

Indicators do not send accurate signals: the price is testing 50 MA.

The MACD histogram is near the 0 mark.

Stochastic Oscillator is in the neutral zone, the %K line is above the %D line, which gives a signal to buy USD/CAD.

Trading recommendations
  • Support levels: 1.29500, 1.29150, 1.28700
  • Resistance levels: 1.29800, 1.30100, 1.30450

If the price fixes below the support level of 1.29500, the USD/CAD currency pair is expected to decline. The movement is tending to 1.29150-1.29000.

Alternative option. If the price fixes above 1.29800, you need to consider buying USD/CAD. The target level for profit taking is 1.30100-1.30400.

The USD/JPY currency pair

Technical indicators of the currency pair:
  • Prev Open: 113.789
  • Open: 113.149
  • % chg. over the last day: -0.52
  • Day’s range: 112.931 – 113.372
  • 52 wk range: 104.56 – 114.74

Yesterday sales prevailed on the USD/JPY currency pair. The trading instrument updated local lows. At the moment, the technical pattern is ambiguous. The USD/JPY quotes are testing a “mirror” resistance of 113.350. The round level of 113.000 is a key support. We recommend paying attention to the yield of US government bonds. Positions must be opened from the key levels.

Today, the news feed on the Japanese economy is calm.

USD/JPY

The price has fixed below 50 MA and 200 MA, which indicates the power of sellers.

The MACD histogram is in the negative zone, but above the signal line, which gives a weak signal to sell USD/JPY.

Stochastic Oscillator is in the neutral zone, the %K line is above the %D line, which indicates the bullish sentiment.

Trading recommendations
  • Support levels: 113.000, 112.600
  • Resistance levels: 113.350, 113.600, 113.900

If the price fixes above the resistance level of 113.350, it is necessary to consider buying USD/JPY. The movement is tending to 113.600-113.900.

An alternative would be reduction of the USD/JPY currency pair to 112.800-112.600.

Analytics by JustForex

Oil Price Rally Boosts Electric Car Sales

By OilPrice.com

Tesla’s competition is about to get more crowded next year with many legacy automakers and luxury brands launching a record number of battery electric vehicles and plug-in hybrids.

All EV makers will have one common element that could help lift demand for battery vehicles—rising oil prices leading to fuel prices at four-year highs, which could turn consumers towards EVs.

To be sure, charging infrastructure and range are still key concerns in consumers’ minds regarding EVs, but utilities and major oil firms such as Shell and BP are already looking to expand the charging infrastructure, especially in Europe.

Battery pack prices have been dropping constantly this decade and are expected to continue to fall. In terms of cost comparison, some estimates point to battery pack costs becoming competitive with the internal combustion engine (ICE) cars by 2027.

Rallying oil prices, with Brent Crude topping $85 a barrel this week, come just as the number of global offerings of EVs next year is expected to rise by 20 percent to 216 models, research by Bloomberg NEF shows.

“The higher the price of oil the more tailwind we’re going to have behind electric cars,” Bloomberg quoted Carlos Ghosn, chairman of Renault and Nissan Motor, as saying at the Paris Motor Show this week.

Next year, Nissan will launch the sale of a longer-range model of its best-selling EV Leaf.

German carmakers are also jumping into the EV competition.

Mercedes-Benz unveiled last month its first all-electric model Mercedes-Benz EQC, which will be launched on the market in 2019. BMW is teasing the premiere of a new concept EV, BMW Vision iNEXT. Audi has started mass production of the Audi e-tron, the brand’s first all-electric SUV, and deliveries are scheduled to begin in the spring of 2019.

Ultra-luxury brands will also be offering electric vehicles. Aston Martin is building Rapide E with a target range of over 200 miles and projected top speed of 155 mph, with customer deliveries set for Q4 2019. Porsche is working on its first purely electric series, Taycan, and plans to invest more than US$6.9 billion (6 billion euro) in electromobility by 2022, doubling its initially planned expenditure.

While almost every carmaker out there is unveiling or planning EV models, gasoline prices are up and even after the end of the U.S. driving season, the national gas price average as of October 1 was $2.88 – a pump price not seen since mid-July.

“The last quarter of the year has kicked off with gas prices that feel more like summer than fall,” AAA spokesperson Jeanette Casselano said.

“This time of year, motorists are accustomed to seeing prices drop steadily, but due to continued global supply and demand concerns as well as very expensive summertime crude oil prices, motorists are not seeing relief at the pump.”

High fuel prices could be part of consumers’ motivation to buy more EVs.

Global cumulative EV sales are already 4 million, according to Bloomberg NEF, which notes that the time for reaching each of the million sales has been rapidly shrinking. The first million in sales, reached in Q4 2015, took around 60 months to achieve; the second million came in 17 months; the third million took 10 months; and the fourth million needed just six months. Bloomberg NEF expects the next million EVs to take just over 6 months and the five-millionth EV to be sold in March next year.

The EV share of the global car fleet is still miniscule, considering that the world’s stock of cars is 1.2 billion units. But battery costs and range are less and less the stumbling blocks in EV adoption, according to Wood Mackenzie. Battery is one third of the cost of an EV today. Yet, costs have already declined by 80 percent this decade and will fall further. Battery pack prices will drop below US$200/kWh this year and then fall by around 10 percent each year, WoodMac said in July.

“The critical threshold is US$100/kWh – that’s when EVs will compete on commercial terms with ICE vehicles. We think we’ll get there by 2027,” WoodMac says.

EVs will displace around 5 million bpd to 6 million bpd of oil demand by 2040—some 5 percent of total oil demand, the consultancy has estimated.

ICE cars are not going anywhere in the next decade or two, but the higher the price of oil, the more competition they’ll have from EVs and the more incentives consumers will get to pick an EV for their next new car.

Link to original article: https://oilprice.com/Energy/Energy-General/Oil-Price-Rally-Boosts-Electric-Car-Sales.html

By Tsvetana Paraskova for Oilprice.com


The News Feed Is Calm. American Currency Is in the Positive Zone

by JustForex

Yesterday, the US currency strengthened against a basket of major currencies. The US dollar index (#DX) closed in the positive zone (+0.14%). Demand for the US currency is still high. Meanwhile, the news feed is fairly calm. Financial market participants expect additional drivers.

The euro has been declining due to the resumed concerns about the budget of Italy. Conflict arose between the European Union and Rome regarding the project of budget deficit of Italy for the next three years, which exceeds the specified EU limits. However, Italy noted it intended to adhere to its plans to increase budget spending.

The British pound weakened against the US currency due to uncertainty about Brexit. The EU and the UK can not reach an agreement after the country’s exit from the Union. The European Union intends to offer the UK to inspect goods “anywhere”.

The “black gold” prices show positive dynamics. At the moment, futures for the WTI crude oil are testing a mark of $74.85 per barrel.

Market Indicators

Yesterday, there was a variety of trends in the US stock market: #SPY (0.00%), #DIA (+0.19%), #QQQ (-0.61%).

At the moment, the 10-year US government bonds yield is at the level of 3.24-3.25%.

The news feed on 2018.10.09:

Today, the publication of important economic news is not expected.

by JustForex

EURUSD: euro hovering around the balance line

By Gabriel Ojimadu, Alpari

Previous:

On Monday the 8th of October, trading on the euro closed down against the dollar. The dollar made gains against most of the majors, although most of these gains were erased during the US session. With a bare economic calendar and holidays in the US and Canada, there wasn’t much to trade on. The US stock market was open, but the securities market was closed.

Aside from the dollar’s rise, the euro also felt the pressure from Italy’s budget crisis. Italian bond yields surged, which led to an increased spread between Italian and German bonds. Markets now await the European Commission’s verdict on the Italian budget.

Day’s news (GMT+3):

  • 09:00 Germany: trade balance (Aug).
  • 15:15 Canada: housing starts (Sep).

Fig 1. EURUSD hourly chart.

Current situation:

My expectations of a flat on Monday were unfounded. As the US and Canada took a day off, Italy’s budget took centre stage. What happened in the end? We got a drop to 1.1460 followed by a bounce to 1.1490.

The pair is currently trading at 1.1496. The rate has returned to the lb line. When this happens, it means that the situation is 50/50.

What can we expect from markets this Tuesday?

So, the pair has risen above 1.1484 (low from 5th of October). This means that we can take a closer look at the possibility of a double base (1.1463 and 1.1460). In order for this model to fully form, the bulls need to break the resistance, which was acting as a support yesterday. The quicker the rate returns to the 67thdegree (1.1540), the higher the probability of rising to 1.1590. Yesterday’s candlestick has a long tail; a factor that favours the bulls.

The euro crosses provide a mixed picture. So, if the dollar goes on the attack, a euro selloff will most likely begin from around 1.1505 – 1.1514. If we draw a channel from 1.1463, 1.1460, and 1.1550 levels, then the pair is currently trading in the middle of this.

The trend is bearish, so it’s safer to short the euro than it is to buy it. Seeing the double base makes one reluctant to do so, however. Personally, I think it’s a safe bet to enter a short position somewhere between 1.1540 and 1.1550. With this pricing model, I doubt we’ll be revisiting 1.1460.

RoboForex to Add 16 New Crypto Instruments to R Trader

Limassol, Cyprus, 08, October 2018 – RoboForex, an international broker, is announcing an expansion of the list of cryptocurrency instruments, which are available for trading through R Trader multi-asset platform. Sixteen new trading instruments have been added to the list. In total, 26 crypto instruments are available for trading on the platform at the moment.

RoboForex continues expanding the list of cryptocurrency pairs available to its clients and adding new instruments:

BCHBTC – 0.00000001 – Bitcoin Cash/Bitcoin

BTGBTC – 0.00000001 – Bitcoin Gold/Bitcoin

BTGUSD – 0.01 – Bitcoin Gold/USD

EOSBTC – 0.00000001 – EOS/Bitcoin

ETCBTC – 0.00000001 – Ethereum Classic/Bitcoin

ETCUSD – 0.001 – Ethereum Classic/USD

GNTUSD – 0.00001 – Golem/USD

IOTABTC – 0.00000001 – IOTA/Bitcoin

IOTAUSD – 0.0001 – IOTA/USD

NEOBTC – 0.00000001 – NEO/Bitcoin

NEOUSD – 0.00001 – NEO/USD

OMGBTC – 0.00000001 – OmiseGO/Bitcoin

OMGUSD – 0.00001 – OmiseGO/USD

QTUMUSD – 0.00001 – QTUM/USD

XMRBTC – 0.00000001 – Monero/Bitcoin

XMRUSD – 0.00001 – Monero/USD


Trading conditions for the cryptocurrencies that are available in R Trader terminal are the following: trading 24/7, leverage up to 1:50, minimum order size – 0.001, maximum order – 1,000, commission from 0.01 USD.

Kiryl Kirychenka, the Head of R Trader project, comments: “New instruments provide our clients with much more opportunities and make the cryptocurrency market more available for trading. Until recently, one could trade of a large set of different cryptocurrencies only at stock exchanges, but now traders have new options. If we’re talking about convenience of products and services, trading conditions and security, brokers’ offers are competitive to crypto exchanges, but in many aspects they are even better.


About RoboForex

RoboForex is a company, which delivers brokerage services on a world-wide basis. The company provides traders, who work on financial markets, with access to its proprietary trading platforms. RoboForex Ltd has the brokerage license IFSC/60/271/TS/17. More detailed information about the Company’s products and activities can be found on the official website at www.roboforex.com.


The USD Is Breaking Forward

EURUSD continues retreating. The major currency pair slowed down its decline a little bit last Friday due to rather complicated statistics from the USA, but resumed trading downwards on Monday morning.

So, the USA reported on the labor market in September. The numbers were quite mixed, but there was an objective reason for this: it looks like September slowly becomes a traditional “hurricane month” in the USA, when manufacturing sector or the consumption suffers. Or both.

Last month, the Non-Farm Employment Change in the USA was 134K against the expected reading of 185K. The report says that the tertiary industry was hurt by hurricanes most of all: the employment in restaurants and cafes, hotels, and shops. At the same time, the employment in the manufacturing sector improved. It seems like the bad weather prevented people from going out and making use of the service industry. Remember that the ADP report showed 230K and that’s a terrific number, which was way much better than market expectations.

The Unemployment Rate in the USA decreased from 3.7% in August to 3.9% in September.

The Average Hourly Earnings, the indicator which has recently become speculative due to its volatility, added 0.3% m/m in September, the same as the month before. On YoY, the indicator expanded only by 2.8% after adding 2.9% in August.

Investors weren’t too positive in their response to the numbers: the USD was corrected against the Euro and retreated a bit, but on Monday morning the American currency resumed its attack.

The H1 chart of EURUSD shows that after rebounding from the current channel’s resistance line the pair started a new descending impulse. The closest downside target is the support lien and 1.1410. However, the price may reach this level only after breaking the fractal at 1.1463. At the same time, one should exclude a possibility of a new correctional uptrend, which may start if the instrument breaks the resistance line at 1.1530. The short-term target of this correction may be the resistance level at 1.1630.

Author: Dmitriy Gurkovskiy, Chief Analyst at RoboForex


Disclaimer

Any predictions contained herein are based on the authors’ particular opinion. This analysis shall not be treated as trading advice. RoboForex shall not be held liable for the results of the trades arising from relying upon trading recommendations and reviews contained herein.