EURUSD has rebounded from 1.1616 and is still trading downwards. Today, the pair may fall to reach 1.1520 and then grow towards 1.1574. After that, the instrument may resume trading inside the downtrend with the short-term target at 1.1433.
GBPUSD, “Great Britain Pound vs US Dollar”
GBPUSD has completed the correctional structure and right now is trading downwards. Possibly, today the price may reach 1.3050 and then trade upwards to reach 1.3150. Later, the market may resume trading inside the downtrend with the short-term target at 1.2900.
USDCHF, “US Dollar vs Swiss Franc”
USDCHF is moving upwards; it has broken 0.9905 and may continue growing with the short-term target at 0.9970. In fact, the instrument continues forming the ascending wave towards 0.9990.
USDJPY, “US Dollar vs Japanese Yen”
USDJPY has reached the first upside target. Possibly, today the price may form another consolidation range around 112.18. The instrument may be corrected towards 111.95 and then start another growth with the short-term target at 112.75.
AUDUSD, “Australian Dollar vs US Dollar”
AUDUSD is still consolidating around 0.7122. If later the instrument breaks this range to the upside, the price may grow to reach 0.7196; if to the downside – resume trading inside the downtrend with the target at 0.7000.
USDRUB, “US Dollar vs Russian Ruble”
USDRUB is trading downwards. Possibly, the pair may continue forming the third wave towards 64.10 without any correctional structures. After that, the instrument may start another growth with the target at 65.58 and then resume falling to reach 63.40.
XAUUSD, “Gold vs US Dollar”
Gold is forming the third correctional structure. Today, the pair may reach 1216.15 and then start another growth towards 1224.15. Later, the market may start a new correction to reach 1215.30. The first target is at 1205.80.
BRENT
Brent is consolidating around 82.22. According to the main scenario, the price may fall with the short-term target at 78.60. Later, the market may grow to return to 82.22 once again and then start another decline towards the first target at 77.37.
Attention! Forecasts presented in this section only reflect the author’s private opinion and should not be considered as guidance for trading. RoboForex LP bears no responsibility for trading results based on trading recommendations described in these analytical reviews.
Since the beginning of the current week, the EUR/USD currency pair has been in a sideways trend. Unidirectional trend is not observed. The euro is under pressure after the publication of the ZEW economic sentiment index in Germany, which counted to -24.7 in October instead of -12.3. At the moment, the local support and resistance levels are: 1.15500 and 1.15850, respectively. We recommend opening positions from these marks. Financial market participants expect the publication of the FOMC meeting minutes, which may indicate a further Fed’s key interest rate raising.
Economic calendar on 17.10.2018:
– Consumer price index in the Eurozone at 12:00 (GMT+3:00);
– Statistics on the real estate market in the United States at 15:30 (GMT+3:00);
– Publication of the FOMC meeting minutes at 21:00 (GMT+3:00).
The price has fixed between 50 MA and 200 MA, which are strong dynamic support and resistance levels.
The MACD histogram is in the negative zone and below the signal line, which gives a signal to sell EUR/USD.
Stochastic Oscillator is in the neutral zone, the %K line is above the %D line, which indicates the bullish sentiment.
Trading recommendations
Support levels: 1.15500, 1.15200, 1.14900
Resistance levels: 1.15850, 1.16200
If the price fixes above the resistance level of 1.15850, the EUR/USD quotes are expected to grow. The movement is tending to 1.16200-1.16400.
An alternative may be a decrease in the EUR/USD currency pair to the level of 1.15200-1.14900.
The GBP/USD currency pair
Technical indicators of the currency pair:
Prev Open: 1.31509
Open: 1.31783
% chg. over the last day: +0.27
Day’s range: 1.31532 – 1.31897
52 wk range: 1.2361 – 1.4345
There is a variety of trends on the GBP/USD currency pair after the publication of ambiguous reports on the UK labor market. Thus, average earnings taking into account bonuses increased by 2.7% in August instead of 2.6%. However, the number of jobless claims rose to 18.5K in August, while experts expected 4.5K. The key support and resistance levels are: 1.31400 and 1.31900, respectively. Investors expect new information regarding the Brexit process. Positions should be opened from the key levels.
Economic calendar on 17.10.2018:
– Consumer price index in the UK at 11:30 (GMT+3:00).
Indicators do not send accurate signals: the price has crossed 50 MA and 200 MA.
The MACD histogram is near the 0 mark. There are no signals at the moment.
Stochastic Oscillator is in the neutral zone, the %K line is crossing the %D line. There are no signals.
Trading recommendations
Support levels: 1.31400, 1.31000, 1.30600
Resistance levels: 1.31900, 1.32300, 1.32600
If the price fixes above the resistance level of 1.31900, the GBP/USD quotes are expected to rise. The movement is tending to 1.32300-1.32600.
An alternative may be the decrease in the GBP/USD currency pair to 1.31000-1.30600.
The USD/CAD currency pair
Technical indicators of the currency pair:
Prev Open: 1.29915
Open: 1.29331
% chg. over the last day: -0.43
Day’s range: 1.29533 – 1.29546
52 wk range: 1.2059 – 1.3795
The USD/CAD currency pair has been declining. At the moment, quotes are consolidating. Financial markets participants took a wait-and-see attitude before publication of the FOMC meeting minutes. Local support and resistance levels are: 1.29400 and 1.29650, respectively. Positions should be opened from these marks. The USD/CAD currency pair has the potential for further correction.
The news feed on the economy of Canada is calm.
Indicators point to the power of sellers: the price is being traded below 50 MA and 200 MA.
The MACD histogram is in the negative zone, but above the signal line, which gives a weak signal to sell USD/CAD.
Stochastic Oscillator is in the neutral zone, the %K line is below the %D line, which indicates the bearish sentiment.
Trading recommendations
Support levels: 1.29400, 1.29150, 1.28800
Resistance levels: 1.29650, 1.30000, 1.30300
If the price fixes below the support of 1.29400, it is necessary to look for entry points to the market to open short positions. The target movement level is 1.29150-1.28800.
Alternative option. If the price fixes above the resistance level of 1.29650, the USD/CAD quotes growth is expected. The movement is tending to 1.30000-1.30300.
The USD/JPY currency pair
Technical indicators of the currency pair:
Prev Open: 111.767
Open: 112.258
% chg. over the last day: -0.33
Day’s range: 112.154 – 112.235
52 wk range: 104.56 – 114.74
Yesterday, the bullish sentiment was observed on the USD/JPY currency pair. The growth of quotes exceeded 50 points. At the moment, the trading instrument is consolidating. Local support and resistance levels are: 112.000 and 112.400, respectively. Positions should be opened from these marks. Trading instrument is tending to recover.
Publication of important economic reports from Japan is not planned.
Indicators do not send accurate signals: the USD/JPY quotes have fixed between 50 MA and 200 MA.
The MACD histogram is in the positive zone, but below the signal line, which gives a weak signal to buy USD/CAD.
Stochastic Oscillator is in the neutral zone, the %K line is crossing the %D line. There are no accurate signals.
Trading recommendations
Support levels: 112.000, 111.650
Resistance levels: 112.400, 112.750, 113.000
If the price fixes above the resistance level of 112.400, further growth of the USD/JPY quotes is expected. The movement is tending to 112.750-113.000.
Alternative option. If the price fixes below the round level of 112.000, we recommend looking for entry points to the market to open short positions. The target movement level is 111.700-111.500.
Yesterday, the US dollar strengthened slightly against a basket of major currencies. The dollar index (#DX) keeps the current levels (+0.03%). In August, job openings exceeded again the number of unemployed in the United States, which signals the stability of the labor market. The indicator counted to 7.136M compared to market expectations of 6.945M. Today, investors have taken a wait-and-see attitude before publication of the FOMC meeting minutes. We recommend paying attention to the comments by the Fed representatives.
The British pound moved in different directions due to the publication of ambiguous reports on the UK labor market. Thus, average earnings taking into account bonuses increased by 2.7% in August instead of 2.6%. However, the number of jobless claims rose to 18.5K in August, while experts expected 4.5K. Investors expect the current information regarding the Brexit process. The euro weakened against the US dollar after the publication of the ZEW economic sentiment index in Germany, which counted to -24.7 in October instead of -12.3.
Oil quotes show positive dynamics. At the moment, futures for the WTI crude oil are testing a mark of $72.15 per barrel. At 17:30 (GMT+3:00) the US crude oil inventories will be published.
Market Indicators
Major US stock indices have recovered some losses: #SPY (+2.19%), #DIA (+2.21%), #QQQ (+2.91%).
At the moment, the 10-year US government bonds yield is at the level of 3.16-3.17%.
Economic calendar on 17.10.2018:
– Consumer price index in the UK at 11:30 (GMT+3:00); – Consumer price index in the Eurozone at 12:00 (GMT+3:00); – Statistics on the real estate market in the United States at 15:30 (GMT+3:00); – Publication of the FOMC meeting minutes at 21:00 (GMT+3:00).
As fast as the downside breakout occurred, the upside recovery appears to be taking place as Q3 Earnings begin to hit the news wires. This past weekend, the news cycles and market experts all seemed to have opinions about where the US equities market was headed after last week’s price collapse. We’ve read everything from warnings of a $20 trillion dollar collapse to seeing Bloomberg’s SMART INDEX chart showing equity valuations are near historic market bottoms. It seems everyone wanted to get out and share their opinions – I guess we are no different.
The facts still remain the same, until the global market dynamics change and the US equities markets break the defined price channels that have been well established, we do not see any reason to consider a 6~8% correction life-threatening. In the total scope of the price range, this move represents less than a 25% price correction from price rotation points (as you’ll see on the longer term NQ chart below). Yes, eventually, some critical market event might cause the US equity markets to change direction, but until then stay safe and roll in and out of trades with skill.
Our research team, at Technical Traders Ltd., has continued to stay on top of this move by predicting the downside move over 3 weeks before it happened and by calling the bottom near 2700 on the ES. Recently, we posted two articles regarding the Q3 earnings expectations and the longer term price channels that are defining this current move. We suggest you visit www.TheTechnicalTraders.com to read our most recent research posts.
The recent upside price swing in the US Equities markets should not have been a surprise if you had been following our analysis and research. These types of price rotation are actually very healthy for the price and allows the price to establish support, wash out a few weaker positions and allows skilled traders to position themselves for future success.
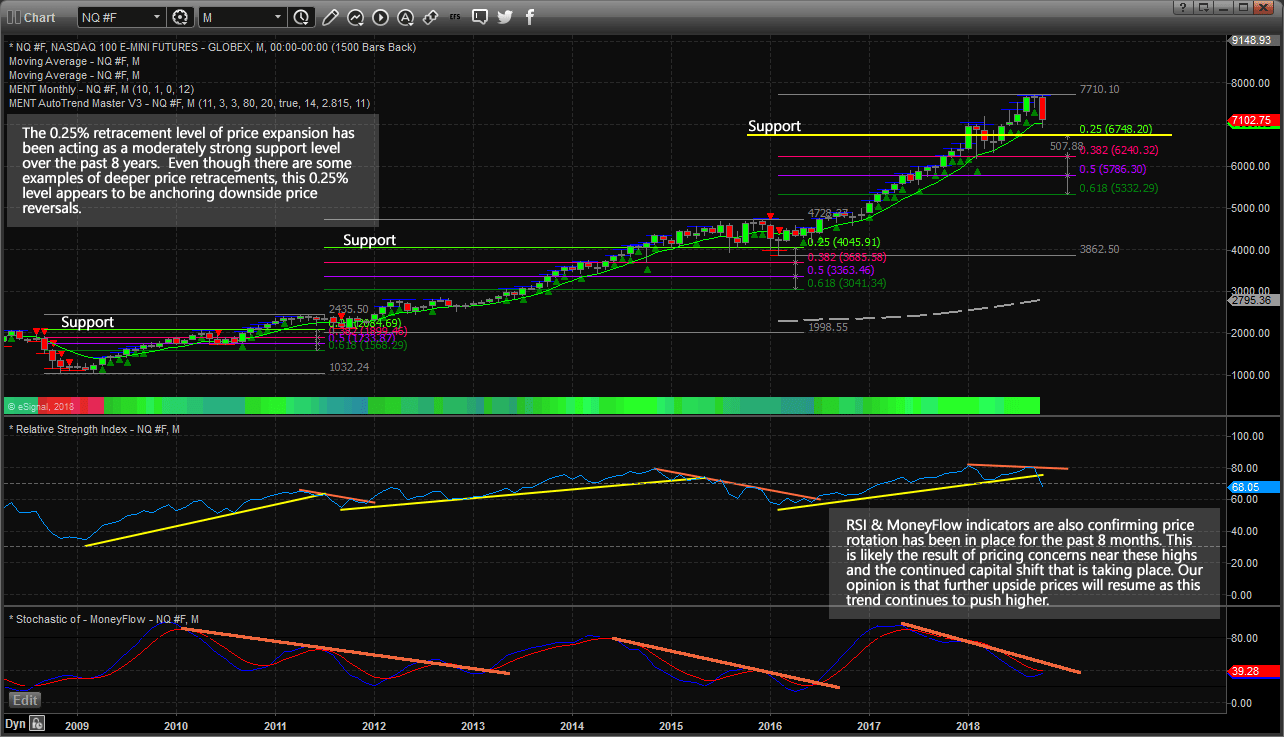
This Monthly NQ chart shows you what our research team has identified as a price pattern going back 8+ years. Since the 2009-10 bottom in the markets, price rotation has been limited to about 0.25% total retracements for each upward price range. This is interesting in the sense that rotation is occurring in price, but it has historically been somewhat limited to within the 0.25% range. This also suggests that as price continues to climb and expand, the 0.25% retracement range is also expanding.
Still, until we see a deeper price retracement that clearly breaches support channels and confirms a downside move, we don’t believe any real danger exists to the downside. We have advised our members appropriately to watch for this move and protect their open long positions as this downside setup was identified by our team over 4 weeks ago. Now, we are advising our members to take advantage of strategic opportunities in selected symbols because of what our predictive modeling systems are suggesting.
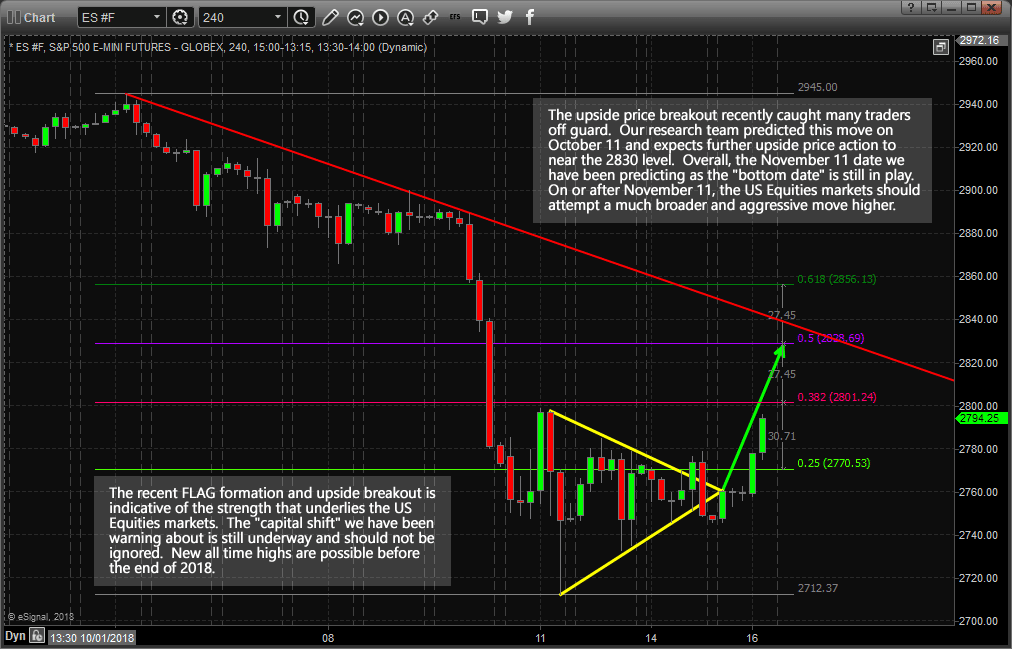
This 240 minute ES chart shows the recent upside breakout of the FLAG/Pennant formation near the support levels (2733~2744). These levels were identified by our research team shortly after the bottom had formed and allowed us to understand that as long as price stayed above these levels, an upside price breakout was the strongest possibility. The “washout” price rotation near the apex of the FLAG formation was expected as well. Our team believes the upside price move is just starting and that price will move to near 2830 before stalling and potentially retracing back to near 2785. Remember, our research shows that a true price bottom will not form in the US markets will somewhere near November 8~12. Somewhere near these dates, the US Equities market should form a very solid price bottom and begin to really accelerate to the upside throughout the end of 2018.
We’ve already positioned our subscribers to effectively profit from the future moves we expect in the markets. Our predictive modeling systems are showing us what is the highest probability outcomes and our job is to keep our subscribers well informed and ahead of these moves. We urge you to spend a bit of time reviewing our most recent research posts to better understand the current market environment: visit www.TheTechnicalTraders.com/FreeMarketResearch/ to access all of our public research posts. The Christmas rally should be setting up very quickly and this Q3 earnings season is likely to present some very good trading opportunities. Get ready for 2019 by following our research and staying ahead of these market moves instead of following along after the moves have taken place.
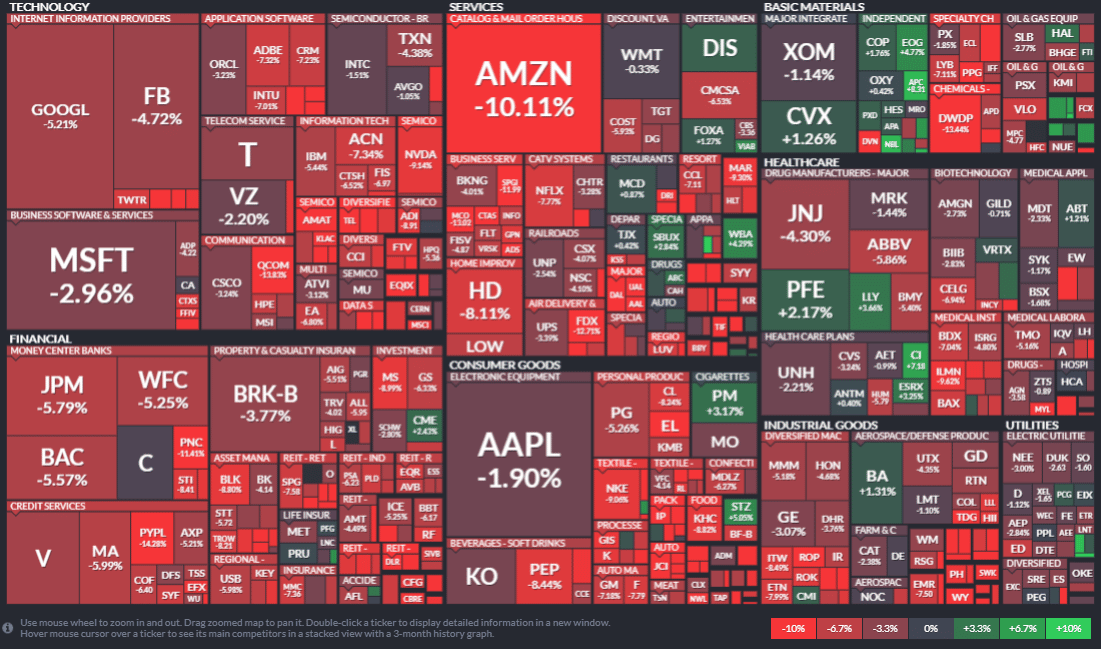
There has been quite a bit of chatter about the FANG stocks recently. In fact, the entire Technology Sector has taken a beating over the past 30+ days. Our research team, at Technical Traders Ltd., believes the Technology sector is setting up for a 15%+ price rebound from these recent lows and we want to alert our followers to be prepared for this move.
Let’s start by taking a look at a 1 Month S&P Heat Map showing just how distressed certain sectors are in terms of price valuations. The Brighter Red highlighted symbols represent a price decrease of at least -6.7% to well above -10% over the past 30 days. It is pretty easy to see the entire Technology, Technology Services, Financial, and Consumer Goods sectors are all under some pricing pressure. What interests us is we call the “capital shift” that has been taking place over the past 4+ years.
We have authored research posts suggesting that a global capital shift has been taking place on the back of multiple global QE attempts to support the global economies. The premise of our theory is that capital is constantly seeking the safest locations to be deployed with the highest potential for returns. Prior to the US Fed raising interest rates over the past 14+ months, the US Real Estate market was a perfect example of this shift in capital. Additionally, over the past 3+ years, the US Technology sector has been another great example of this shift in capital. As the Emerging Market boob cycle went bust, capital went in search of better targets. As the Oil market went bust, resulting in currency pricing pressures, capital continued to search out the best, most stable, investments and growth opportunities. Our opinion is most of that capital found its way into the US stock market (into technology, biotech, finance, and healthcare).
We believe this capital shift is now under pressure across the globe to identify and execute for longer-term returns and we believe the recent price rotation in the US Equities markets may give this capital further incentive to redeploy into the US Equities market.
Capital MUST find suitable locations for growth, protection, and healthy longer-term returns. One can’t simply keep moving billions of dollars of capital around to various investments every few weeks. Currency concerns are constantly a worry for global investors. Placing your capital into the wrong investment could result in a net loss because currency valuations may destroy your trading profits if you are not cautious. Global concerns regarding the Arab nations, oil production, Asia/China trade/economic issues and the never-ending European Union issues really only leave one location on the planet that is somewhat immune from extended risk – the US Equities market.
Our research team believes this recent price rotation will turn into an excellent buying opportunity for select sectors over the next 60+ days. The trick to being successful with this move is the proper timing of the trades. If you really want to know when is the best time to pull the trigger, then you really want to follow our research and consider joining our other member/subscribers because we provide them with much more detail than is included in these public posts. Still, we believe the charts are screaming at us to consider the longer term “capital shift” that is taking place and to understand the true nature of price – it always seeks out new highs or new lows and capital is always seeking the best returns in the safest environment (away from extreme risk).
Take a look at these charts.
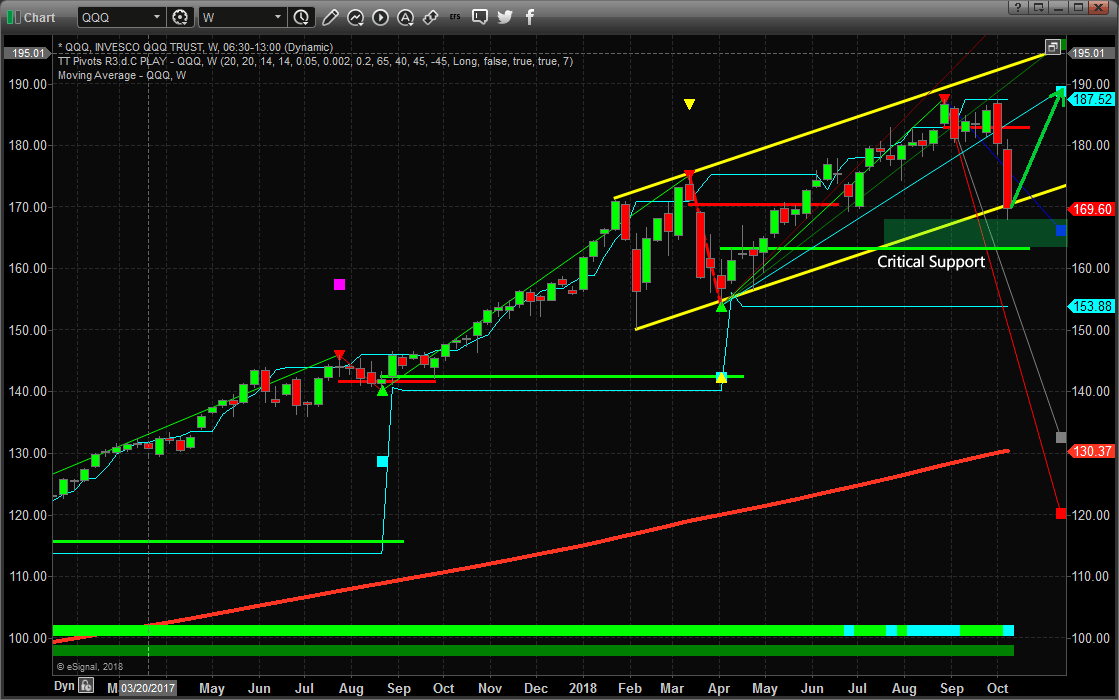
First, the Weekly QQQ. The price channel is clear. The Support level is clear. The lows of February 2018 are the critical price levels that we want to be concerned with. The current price rotation falls to just below the lower YELLOW price channel and stalls. As long as our critical support level is not breached, the QQQ should set up an extended, yet volatile, price bottom before the end of this year and begin to rally back up toward the $190 price level.
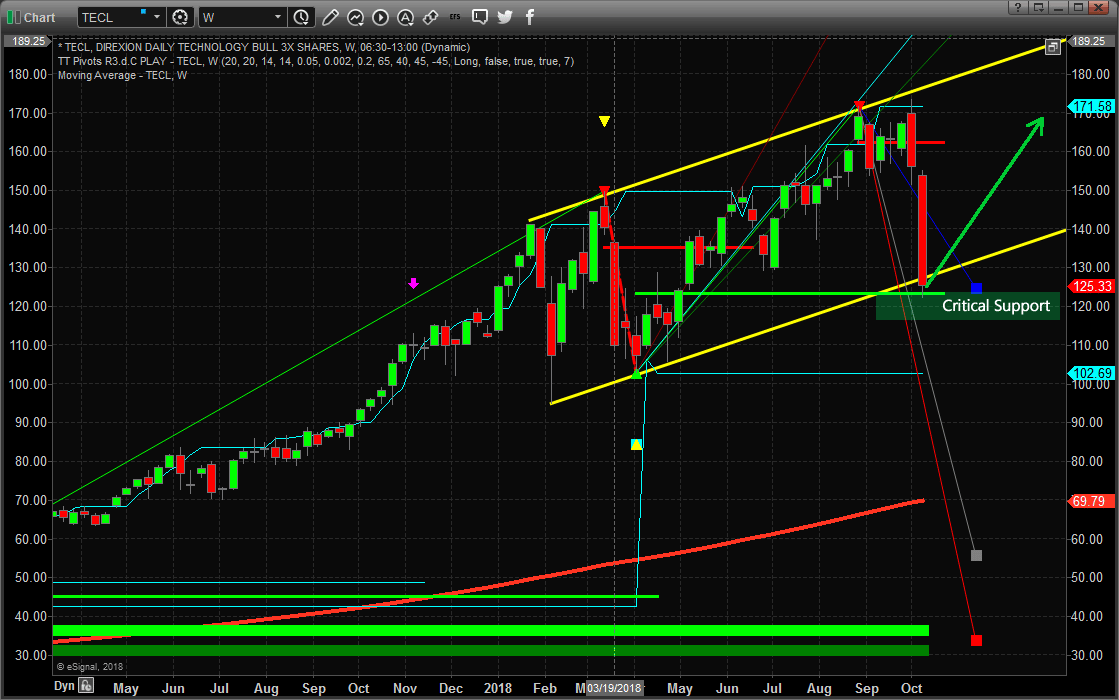
This Weekly TECL chart shows a similar picture to the QQQ chart. The price channels are clear. The Support level is clear. The lows of February 2018 are still acting as “deeper price lows” that indicate we should consider these levels critical to see any major price reversal to the downside. Our critical support level is just below recent price lows, thus we should be expecting the price to stall near this level and the upside price target near $172 is close to $50 away. As long as this support holds and the price continues to hammer out a bottom near or below the $130 level, this rotation could play out for a very nice 20~30% upside price move.
We are not urging our followers to BUY anything just yet. Certainly, be aware of the potential for an upside move as this price bottom plays out over time. Use your own skills to find and execute proper trades or visit www.TheTechnicalTraders.com to learn our team of professionals can assist you.
Our proprietary price modeling systems will tell us exactly when and how to enter these trades and we want our followers to understand the type of rotation that we believe is currently playing out in the markets. We believe this recent move to the downside was the result of very mild volatility prior to this move, computerized trading models setting large sell orders near the 2715 price level on the S&P in preparation for just this type of move. Once the price reacted to the US Fed, general price rotation and selling pressure and fell below 2715, the sell programs kicked in and drove the price down to levels near support. So far, prices have not attempted to move much lower and that is a very good sign for the current trend channels and upside price trend. Watch how this plays out and get ready for some great trades over the next 6+ months.
Please take a moment to visit TheTechnicalTraders.com to see how we can help you find and execute better trades. Our team of researchers and technical traders follow these markets every day to try to find and understand the dynamics at play globally. Take a minute to read how we predicted this downward market move 3+ weeks before it happened with our predictive modeling systems. If you don’t think it is possible to know what the markets are going to do weeks in advance, then take a minute to review our work and see for yourself how we predicted this move to the 2700 level in the S&P. Now, get ready for some great trades that will be setting up over the next 4+ months. Q3 and Q4 of 2018 are going to set up some really big opportunities for skilled traders.
On Tuesday, AUDUSD is moving downwards influenced by the active USD and the Monetary Policy Meeting Minutes published by the RBA.
The Australian Dollar started today’s trading session by falling against the USD. The current quote for the instrument is 0.7122.
The Monetary Policy Meeting Minutes published by the RBA today says that the AUD rate decline that started earlier is good for the country’s domestic economy. It is quite interesting, because the regulator doesn’t mention the importance of the Aussie rate at every meeting, unlike it did in the past.
According to the RBA, the next revision of the key rate is likely to be upwards, but surely not in the nearest future. At the same time, the regulator is still pretty sure (as it was in the past) that keeping the rate intact for long period of time provides additional stability and confidence to the country’s economy.
Another thing the RBA mentioned was low mortgage rates at the moment.
In addition to that, the RBA’s attention was focused on uncertainty with consumption, which is connected to slight reduction of wage growth and decline of housing prices. The employment is feeling good after the labor market skyrocketed in August. However, it was said that an average income amount was still not enough for the regulator to feel safe.
Attention! Forecasts presented in this section only reflect the author’s private opinion and should not be considered as guidance for trading. RoboForex LP bears no responsibility for trading results based on trading recommendations described in these analytical reviews.
As we can see in the H4 chart, XAUUSD is testing the resistance level and forming Hanging Man and Shooting Star reversal patterns. Judging by the previous movements, it may be assumed that the price may complete the pullback and then continue its ascending movement.
NZDUSD, “New Zealand vs. US Dollar”
As we can see in the H4 chart, NZDUSD is still growing. Right now, the price is forming another correction from the resistance level with Doji and Harami reversal patterns. Judging by the previous movements, it may be assumed that the instrument may complete the correction and then start a new growth.
Attention! Forecasts presented in this section only reflect the author’s private opinion and should not be considered as guidance for trading. RoboForex LP bears no responsibility for trading results based on trading recommendations described in these analytical reviews.
Yesterday, the bullish sentiment was observed on the EUR/USD currency pair. The US dollar was under pressure due to weak retail sales data. At the moment, the EUR/USD quotes are consolidating. The key support and resistance levels are: 1.15700 and 1.16000, respectively. Trading instrument has the potential for further growth. We recommend opening positions from the key levels.
Economic calendar on 16.10.2018:
– German ZEW economic sentiment index at 12:00 (GMT+3:00);
– JOLTS job openings in the United States at 17:00 (GMT+3:00).
The price has fixed above 50 MA and 200 MA, which indicates the power of buyers.
The MACD histogram is near the 0 mark.
Stochastic Oscillator is in the neutral zone, the %K line is above the %D line, which indicates the bullish sentiment.
Trading recommendations
Support levels: 1.15700, 1.15400, 1.15000
Resistance levels: 1.16000, 1.16400
If the price fixes above the round level of 1.16000, a further increase of the EUR/USD quotes is expected. The movement is tending to 1.16400-1.16600.
An alternative may be a decrease in the EUR/USD currency pair to the level of 1.15400-1.15000.
The GBP/USD currency pair
Technical indicators of the currency pair:
Prev Open: 1.30805
Open: 1.31509
% chg. over the last day: +0.39
Day’s range: 1.31543 – 1.31972
52 wk range: 1.2361 – 1.4345
The British pound is still under pressure after it became known that the UK and the EU could not reach an agreement on Brexit. At the moment, the GBP/USD currency pair has recovered most of the losses. Key support and resistance levels are: 1.31500 and 1.32000, respectively. Investors expect new information regarding the Brexit process. Positions should be opened from the key levels.
Economic calendar on 16.10.2018:
– Report on the labor market in the UK at 11:30 (GMT+3:00).
The price has fixed above 50 MA and 200 MA, which indicates the power of buyers.
The MACD histogram is near the 0 mark. There are no signals at the moment.
Stochastic oscillator is in the neutral zone, the %K line is above the %D line, which indicates the bullish sentiment.
Trading recommendations
Support levels: 1.31500, 1.31100, 1.30700
Resistance levels: 1.32000, 1.32400
If the price fixed above the resistance level of 1.32000, the further growth of the GBP/USD quotes is expected. The movement is tending to 1.32400-1.32600.
An alternative may be the decrease of the GBP/USD currency pair to the level of 1.31100-1.30700.
The USD/CAD currency pair
Technical indicators of the currency pair:
Prev Open: 1.30147
Open: 1.29915
% chg. over the last day: -0.22
Day’s range: 1.29805 – 1.29969
52 wk range: 1.2059 – 1.3795
Yesterday, aggressive sales were observed on the USD/CAD currency pair. Trading instrument has updated local lows. At the moment, quotes are consolidating. The technical pattern is ambiguous. Local support and resistance levels are: 1.29700 and 1.30000, respectively. Positions should be opened from these marks. The USD/CAD currency pair has the potential for further correction.
The news feed on the economy of Canada is calm.
Indicators do not send accurate signals: the price is located between 50 MA and 200 MA.
The MACD histogram is in the negative zone, but above the signal line, which gives a weak signal to sell USD/CAD.
Stochastic Oscillator is in the neutral zone, the %K line is below the %D line, which indicates the bearish sentiment.
Trading recommendations
Support levels: 1.29700, 1.29400
Resistance levels: 1.30000, 1.30400, 1.30650
If the price fixes below the support of 1.29700, it is necessary to look for entry points to the market to open short positions. The target movement level is 1.29400-1.29200.
Alternative option. If the price fixes above the round level of 1.30000, the growth of the USD/CAD quotes is expected. The movement is tending to 1.30400-1.30600.
The USD/JPY currency pair
Technical indicators of the currency pair:
Prev Open: 112.131
Open: 111.767
% chg. over the last day: -0.33
Day’s range: 112.089 – 112.129
52 wk range: 104.56 – 114.74
Since the beginning of this week, trades on the USD/JPY currency pair have been rather active. At the same time, a unidirectional trend is not observed. At the moment, the local support and resistance levels are: 111.900 and 112.250, respectively. Positions should be opened from these marks. Trading instrument is tending to recover.
Publication of important economic reports from Japan is not planned.
Indicators do not send accurate signals: the USD/JPY quotes have fixed between 50 MA and 200 MA.
The MACD histogram has moved into the positive zone, which indicates the bullish sentiment.
The Stochastic Oscillator is near the overbought zone, the %K line is crossing the %D line. There are no accurate signals.
Trading recommendations
Support levels: 111.900, 111.600
Resistance levels: 112.250, 112.600, 113.000
If the price fixes above the resistance level of 112.250, the USD/JPY quotes growth is expected. The movement is tending to 112.600-112.800.
Alternative option. If the price fixes below 111.900, we recommend looking for entry points to the market to open short positions. The target movement level is 111.600-111.400.
During yesterday’s trading session, the US dollar weakened slightly against a basket of major currencies. The US dollar index (#DX) closed in the negative zone (-0.15%). Investors’ sentiment worsened after the collapse of the US stock market and the escalation of the trade war. The US dollar was under pressure due to weak economic data published yesterday. The core retail sales index fell to -0.1% in September, while experts expected 0.4%. The volume of retail sales rose by 0.1% and was worse than the expected value of +0.7%.
The British pound was under pressure after it became known that the UK and the EU could not reach an agreement on Brexit. Ireland-UK border is still an open issue. On Thursday, an important Brexit summit of EU leaders will begin, which is likely to give a solution on controversial issues.
Oil quotes are moderately declining. At the moment, futures for the WTI crude oil are testing a mark of $71.60 per barrel.
Market Indicators
Major US stock indices continue to show negative dynamics: #SPY (-0.56%), #DIA (-0.38%), #QQQ (-1.21%).
The 10-year US government bonds yield moved away from seven-year highs. At the moment, the indicator is at the level of 3.16-3.17%.
Economic calendar on 16.10.2018:
– Report on the labor market in the UK at 11:30 (GMT+3:00); – German ZEW economic sentiment index at 12:00 (GMT+3:00); – JOLTS job openings in the United States at 17:00 (GMT+3:00).
On Monday, the 15th of October, trading on the euro closed up. The euro won back all the losses suffered on Friday. The euro retreated from a low of 1.1535, but I do not understand what lead to buyers recovering Friday’s losses. The US government bond yields were ranging. We’re left thinking that with the remaining problems for the euro, its strengthening was caused by the general weakening of the dollar on an empty calendar.
Monday worked against Friday. I ignored the reverse, as in our analysis the market relied on it opening with a decline on the pound and the euro from the failed Brexit talks over the weekend.
Yesterday, British Prime Minister Theresa May said that serious progress had been made in the Brexit negotiations. Bloomberg, citing an unnamed EU diplomat, said key issues remain unresolved.
A double top was formed on the hourly time frame. The first confirmation was received during the Asian session – the breakout of the trend line. According to this, the target is at 1.1500. I did not make a forecast today as I think it might not work out. The pound isn’t weakening. If the market in the European session ignored geopolitical factors, the price could easily go above 1.1600. A return to 1.1600 will indicate that the market is ready to break the resistance.
Now all eyes are on the situation in Italy, where the government should submit a draft budget for 2019 to the EU. On Wednesday, the US Fed will publish the minutes. The technical picture indicates that the euro will dip to 1.1540, and the latest news from the UK indicates it will strengthen. The price is on the lb balance line. The pair on the hourly period is on the balance point, and the price is ready to deviate from it. If there is a breakout at 1.1610, then buyers will move to 1.1685.