Last week and this Monday, we’ve have many potential headliners for financial markets. Which should be the main one? Decline on stocks? Rise on gold? Or maybe it should be today’s surge on bitcoin? It’s hard to tell, but in this piece, we will focus on the cryptocurrency.
Bitcoin is a savage; the coin tried to erase the whole monthly drop in one day! BTC received a boost after defending the support at 5,900 USD (yellow) (from a technical point of view). No surprise here as this is the ultimate long-term level, which is crucial for the situation on this instrument. A breakout would be lethal, so the bulls are trying to protect it at all costs. Does that bring us a buy signal? Not yet. We are still beneath the lower line of the descending triangle pattern (blue) and the horizontal resistance at 6,800 USD (orange).
As long as we remain below these, there is no buy signal yet. Only the price closing the day above them will be an invitation to buy. The second half of the European session brought us a drop, which could potentially be very dangerous. A long wick on the daily candlestick is never good, especially when it touches the ultimate resistance.
As US trade war damage is spreading, markets reflect an elusive calm before a potential storm. While Chinese prospects and reforms prevail amid challenging conditions, IMF’s global outlook remains too optimistic for 2018-19.
According to new data, China’s exports rose by 14.5% year-on-year in September, which is an acceleration from the previous month. However, growth in imports declined to 14.3%.
What about China-US trade? Chinese exports to the US increased 14.0% on year-to-year basis; the most since February. But as Chinese imports from the US dropped 1.2% year-to-year, that pushed China’s exports to US to a new record high. In turn,
That’s why China’s trade surplus with the US rose to a new record high.
Damage is spreading
Chinese retaliation is already causing red lights to blink in U.S. companies. Ford is a case in point. A month ago, the car maker bragged to President Trump it won’t make China-built car in the US. Now it faces an awakening.
While Ford’s sales remain relatively good at home, the US is no longer a growth market unlike China. Yet, Ford’s sales in China tumbled 43% compared with 2017. Moreover, its wholesale shipments also fell 26% in the second quarter, thus wiping out profit from its joint ventures with Chinese automakers. So Ford had to cut its full-year guidance on increasing concerns about its businesses in China (and Europe which Trump has also targeted in the tariff wars).
The robust performance of Chinese exports is likely to cool in the fourth quarter when more costly U.S. tariffs begin to bite and the momentum of the global economy will weaken; possibly more than currently expected.
The fluctuations of market expectations tell the story.
Elusive calm before a potential storm
What we are witnessing is the elusive calm before the impending storm – if Trump’s trade wars cannot be contained.
In the Chinese markets, which are dominated by volatile retail investors, have been uneasy since the first trade war signals in early year. In the US markets, which are dominated by steadier institutional investors, the negative reaction has been more recent and disruptive. But both signal the obvious: there are no winners in trade wars (Figure).
Figure Sino-US Markets amid Trump Tariffs
Despite Trump tariffs and bilateral uncertainty with the US, China’s exports have been growing robustly all year. These are mainly short-term gains, however. Companies have been front-loading trade to get ahead of the expected tariff increases, but that will wane if the US-Sino ties continue deteriorate.
Nevertheless, as concerns are mounting in the US, Trump continues to under-estimate the resilience of the Chinese economy.
When the People’s Bank of China (PBOC) recently cut banks’ reserve requirements, analysts saw the cut as an affirmation of Chinese government’s commitment to support the domestic economy. In the new, more challenging status quo, monetary accommodation is likely to continue, along with further fiscal easing.
Triple prospects
In the short-term, China is responding and adjusting to US tariff wars. In 2018, growth forecast is 6.5% to 6.6%, thanks to the strong first half of the year. Moderation in the second half will reflect US tariff wars and slower demand growth.
For now, solid service sector growth, supported by monetary and fiscal support, has kept the economy on track. Inflation is moderating and current account surplus could narrow more than expected. Trump tariffs will hurt export growth and thus the growth of manufacturing investment. Moreover, the White House’s sharpened tone suggests US trade hawks seek to instigate capital outflows from China.
In the medium-term, China is deleveraging, while reducing poverty and pollution, to sustain higher-quality growth. A year ago, shadow banking still peaked at more than 15% year-on-year; now its growth has plunged. While substandard loans and actual bank losses have been relatively low, “special mention” loans – a category slightly above nonperforming loans – remain substantial, though they have been declining.
In the long-term, Chinese economy is rebalancing as the sources of growth are shifting from investment and exports to consumption and innovation. On the supply side, the economy continues to move away from industry and toward services. On the demand side, consumption is increasingly fueling growth. Meanwhile, global innovation hubs are expanding from Shenzhen to Shanghai and Beijing.
Derailing the global recovery
Trump’s trade offensives complicate and defer Chinese reforms, but the direction of these reforms prevails. Ironically, over time US tariffs will accelerate China’s long-term rebalancing. This will be challenging in the near-term, but could make Chinese economy more resilient in the long-term.
The International Monetary Fund (IMF) has now cut its forecast on global economic growth to 3.7% percent for 2018-19, citing rising trade protection. But that is still too optimistic. It downplays the full impact of the effective US tariffs, the retaliations impact, the inclusion of new potential tariff targets and subsequent collateral damage.
What is needed is a united front of advanced, emerging and developing economies for global trade. Otherwise, the alternative will be the kind of global depression that was barely avoided in 2008.
Time is running out.
About the Author:
Dan Steinbock is the founder of Difference Group and has served at the India, China and America Institute (US), Shanghai Institute for International Studies (China) and the EU Center (Singapore). For more, see http://www.differencegroup.net/
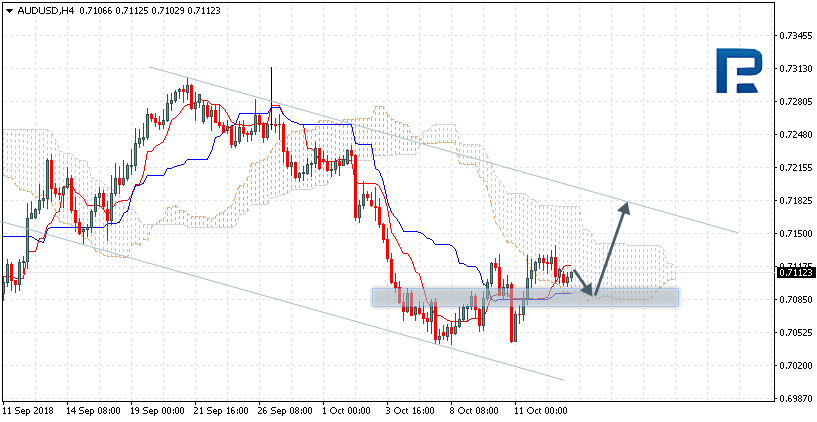
AUDUSD is trading at 0.7123; the instrument is moving inside Ichimoku Cloud, thus indicating a sideways tendency. The markets could indicate that the price may test the downside border of the cloud at 0.7090 and then resume moving upwards to reach 0.7185. Another signal to confirm further ascending movement is the price’s rebounding from the support level. However, the scenario that Implies further growth may be cancelled if the price breaks the downside border of the cloud and fixes below 0.7070. In this case, the pair may continue falling towards 0.7005. After breaking the cloud’s upside border and fixing above 0.7155, the price may continue moving upwards.
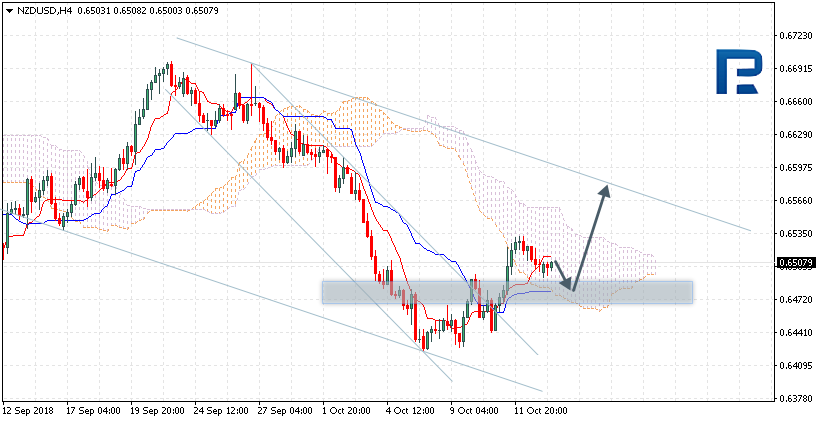
NZDUSD, “New Zealand Dollar vs US Dollar”
NZDUSD is trading at 0.6507; the instrument is inside below Ichimoku Cloud, thus indicating a sideways tendency. The markets could indicate that the price may test the downside border of the cloud at 0.6495 and then resume moving upwards to reach 0.6565. Another signal to confirm further ascending movement is the price’s rebounding from the support level. However, the scenario that Implies further growth may be cancelled if the price breaks the downside border of the cloud and fixes below 0.6455. In this case, the pair may continue falling towards 0.6400. After breaking the cloud’s upside border and fixing above 0.6545, the price may continue moving upwards.
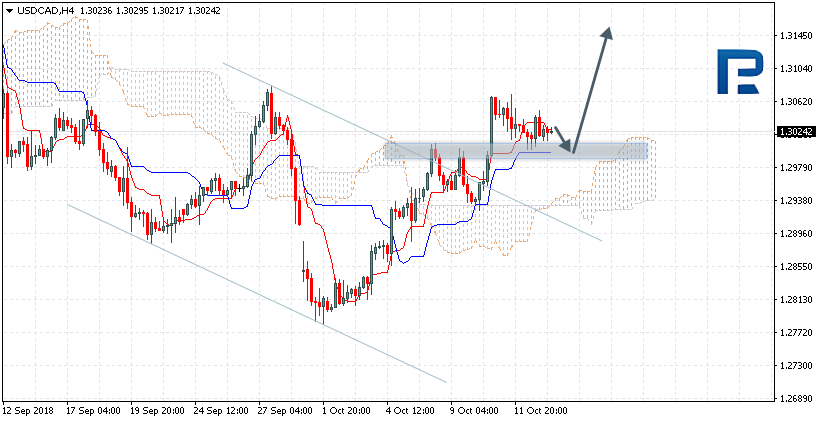
USDCAD, “US Dollar vs Canadian Dollar”
USDCAD is trading at 1.3024; the instrument is moving above Ichimoku Cloud, thus indicating an ascending tendency. The markets could indicate that the price may test Tenkan-Sen and Kijun-Sen at 1.3005 and then continue moving upwards to reach 1.3145. Another signal to confirm further ascending movement is the price’s rebounding from the support level. However, the scenario that implies further growth may be cancelled if the price breaks the downside border of the cloud and fixes below 1.2895. In this case, the pair may continue falling towards 1.2795. After breaking the resistance area and fixing above 1.3075, the price may continue moving upwards.
Attention! Forecasts presented in this section only reflect the author’s private opinion and should not be considered as guidance for trading. RoboForex LP bears no responsibility for trading results based on trading recommendations described in these analytical reviews.
EURUSD is trading downwards to reach 1.1528. Later, the market may grow towards 1.1568, thus forming a new consolidation range. If later the instrument breaks this range to the upside, the price may grow with the target at 1.1649; if to the downside – resume trading inside the downtrend towards 1.1383.
GBPUSD, “Great Britain Pound vs US Dollar”
GBPUSD has broken the consolidation range downwards. Possibly, today the price may reach 1.3060 and then grow towards 1.3158, thus forming a new consolidation range. If later the instrument breaks this range to the upside, the price may trade upwards with the target at 1.3255; if to the downside – resume trading inside the downtrend towards 1.2950.
USDCHF, “US Dollar vs Swiss Franc”
USDCHF is forming the fourth correctional structure. Today, the pair may reach the first target at 0.9833 and then resume growing towards 0.9880.
USDJPY, “US Dollar vs Japanese Yen”
USDJPY is still consolidating around 112.18. According to the main scenario, the pair may break the range upwards and reach the target at 113.10. After that, the instrument may resume falling with the first target at 111.70.
AUDUSD, “Australian Dollar vs US Dollar”
AUDUSD is still consolidating. Possibly, today the price may fall towards 0.7090. If later the instrument breaks this range to the upside, the price may grow to reach 0.7220; if to the downside – resume trading inside the downtrend with the target at 0.7000.
USDRUB, “US Dollar vs Russian Ruble”
USDRUB is consolidating around 66.26. If later the instrument breaks this range to the upside, the price may grow with the short-term target at 67.70; if to the downside – continue the correction towards 65.60.
XAUUSD, “Gold vs US Dollar”
Gold is moving upwards; it has formed the reversal pattern at 1205.80, broken it upwards, and may continue growing with the short-term target at 1130.50. After that, the instrument may resume falling to reach 1205.80 and then start another growth towards 1250.00.
BRENT
Brent is forming the third descending wave; it has completed another consolidation range around 82.22 and broken it downwards. Possibly, the pair may return to test 82.22 from below and then resume falling with the short-term target at 79.11. Later, the market may be corrected to reach 82.22 once again and then start another decline towards the first target at 77.37.
Attention! Forecasts presented in this section only reflect the author’s private opinion and should not be considered as guidance for trading. RoboForex LP bears no responsibility for trading results based on trading recommendations described in these analytical reviews.
There has been quite a bit of information and opinion in the news recently regarding the recent downside price action in the US Equities markets. We’ve seen everything from “The sky is falling” to “The markets will rally into the end of the year”. If you’ve been following our research and analysis, you already know what we believe will be the likely outcome and if not – keep reading.
There are a number of key components of the global economy that are of interest currently; US Treasuries, Precious Metals, Emerging Markets, the European Union, Trade Issues and Capital Shifts.
When one considers the scope of the entire global market environment in terms of these individual issues, a fairly clear picture of what is really happening begins to take shape. Here is our summarized opinion of the current state of the global markets.
Capital is shifting (again) as the US Technology and high return sectors come under pressure. What happens, typically, in this type of environment is that capital moves away from risk (into cash or other suitable investments) as these sectors continue to weaken. Capital will return to these sectors once the risk factor diminishes or abates. Once the S&P fell below the 2915 level, a number of Sell Programs generated extensive downside pressure on the markets – in a way, creating a “wash-out low” price rotation fairly early in this move. Investors and capital will return into these sectors over time as they find support and wash out the extended volatility that is currently at play in the markets.
This capital shift is not unique to just the US markets though, there are other factors involved as well. News that Asian investors have been pulling out of the US Real Estate markets at a record pace, as well as the US Fed actions raising rates recently, has put additional pressure on the valuation/pricing levels in the US equities market. This is likely the reason why Gold and Silver rocketed higher last week. This pricing pressure, even though it was known prior to this downside price move, was not much of a concern for investors because the US stock market indexes didn’t show worry or concern for this issue. There was no real issue with downside pricing concerns. Once the S&P broke that 2915 level and the sell programs kicked in, this became a real issue for many.
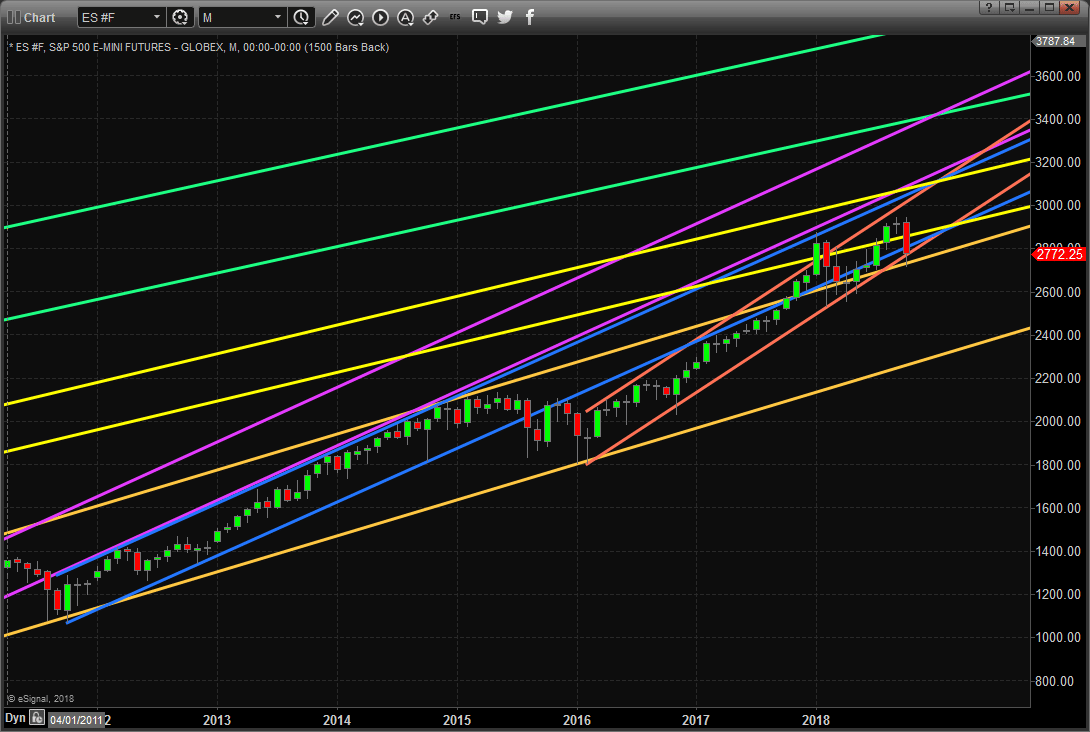
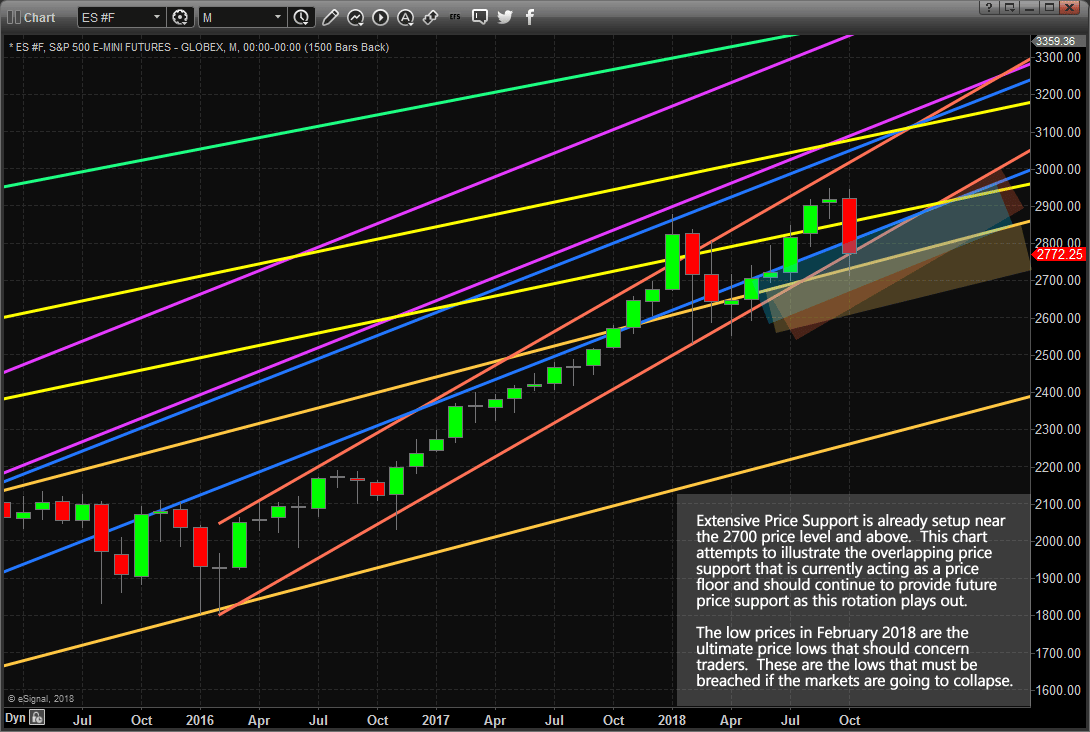
Yet, the longer-term perspective of this market has not changed much since early 2016. Take a look at this chart that highlights the pricing channels established in the S&P of the past 20 years. Each of these paired price channels originates at a low price point and reflect price range, slope and volatility as the progress further to the right. Notice how the original (GREEN) and most recent low-price range (GOLD) reflect a broader price range where volatility was higher and the slope is slightly lower than the shorter-term price channels. These reflect broader price support channels and help us to understand the core slope levels of price advance.
The shorter-term price channels (YELLOW, MAGENTA, BLUE & ORANGE) illustrate the “impulse channels” that are a result of localized or consensus advances. In other words, these types of advances are the result of some impetus event like Quantitative Easing, policy changes, US Election results or any combination of social & economic improvement factors. Price is always attempting to rotate as it attempts to establish new highs and lows.
We try to stress one key Fibonacci Price Theory component to all of our followers:
“Price MUST always attempt to seek out and establish new price highs or new price lows”
This one premise of Fibonacci Price Theory is so important to understand in the greater context of price movement. On a Daily chart, the recent downward price swing may look frightening, but on this Monthly chart, it falls right in line with the ORANGE price channels (which happen to be the most recent and most aggressively upward sloping price channels over the past 20+ years). Additionally, the price has advanced above the Upper GOLD price channel range and back into the BLUE price channel range in late 2017 and early 2018. At this point, price appears to be accelerating quite well and these new support levels (BLUE, ORANGE, and GOLD) are critical to understanding the basics of Fibonacci Price Theory.
So, as you listen to the talking heads on TV and in the news cycles, please understand that true price theory teaches us that “until price breaks recent critical lower or higher price levels, the market price will always attempt to rotate in an effort to seek out and establish new price highs or new price lows”.
This rotation is very healthy for the markets, overall, and this price rotation may, eventually, prove to be a retest of price support before a further advance. Our research team believes the low established near 2712 will likely continue to operate as critical price support as this price rotation continues to extend. Our research team also believe a new price advance phase will become established shortly after November 8~12. Our predictive modeling systems suggest a new price upswing will begin to take place after these November dates.
We urge all of our followers to visit our website, www.TheTechnicalTraders.com, to learn how our dedicated team of researchers and technical traders can assist you in finding and executing better trades, stay ahead of these markets move and properly prepare for the opportunities created by these swings in price. Additionally, take a minute to review some of our past research posts, www.TheTechnicalTraders.com/FreeMarketResearch/, to see how we predicted this downside price rotation over 3 weeks before it happened. It pays to have a dedicated team helping you understand and profit from these market price swings.
At the end of last week, major currencies showed an increase, with the exception of the Canadian dollar. The largest increase against the US dollar was shown by the Japanese yen (+1.33%). The New Zealand dollar went up by 1.09%, the Australian dollar – by 0.87%, the euro – by 0.23%, the British pound – by 0.31% and the Swiss franc – by 0.04%. The Canadian dollar fell 0.62%.
On Friday, the euro fell from 1.1610 to 1.1535. Its fall was facilitated by the overall strengthening of the US dollar, as well as an increase in the yield of US government bonds. Also, major currency pairs tugged on the Canadian dollar against a decline in oil prices and the pound.
News on Brexit, namely, reports that PM May would not agree to Britain’s permanent membership in the customs union, also put pressure on GBP.
Day’s news (GMT+3):
10:15 Switzerland: producer and import prices (MoM) (Sep).
15:30 US: retail sales (MoM) (Sep), NY Empire State Manufacturing Index (Oct).
17:30 Canada: Bank of Canada Business Outlook Survey.
Fig 1. EURUSD hourly chart.
Current situation:
Our expectations on Friday were completely justified. After the breakout of the trend line, the price quickly return to the balance line and the 45th degree. On Monday, trading opened lower on the euro. The British pound was an outsider, as negotiations between Great Britain and the EU on Brexit came to a halt.
At the time of writing, the euro sits at 1.1567. The price is below the balance line. On the 17th and 18th of October a meeting of EU leaders is set to take place during which the Italy’s budget will be discussed. Today is the last day for EU member states to submit a draft budget for 2019 to the EC. Increased attention will be placed on Italy. If the Italian government refuses to compromise, the euro will again be under pressure.
The IMF representative said that Italy should respect the EU budget rules and create reserves in anticipation of slower economic growth.
On Wednesday, the US Fed will publish the minutes of the September meeting on monetary policy, following which the regulator raised the rate for the third time this year. According to the forecast, I am waiting for the drop to 1.1476 by the opening of the European session on Tuesday. Today, my target is 1.1505/10.
The lithium ride was a great one. Cobalt, too. All they needed was their Elon Musk moment, which came in the form of the Nevada battery gigafactory. The next Elon Musk moment won’t be about lithium at all—or even cobalt. It will be for an element that takes everything electric to its revolutionary finish line: Vanadium.
The one moment that will change everything … and that moment may be near.
Vanadium is lithium on steroids—wildly bigger and the only way forward from here. We may have already reached the peak of our electric revolution through batteries with lithium.
We need bigger batteries, preferably the size of a football field—or 20.
That’s vanadium—Element 23. The answer to our issue of scale.
“It’s no longer a technological maybe,” says Matt Rhoades, president and CEO of United Battery Metals, a Colorado vanadium explorer sitting on one of the few known sources of the next big battery metal in the entire United States.
Rhoades should know … his company is behind the discovery that hopes to put America definitively on the vanadium map. UBM’s Wray Mesa Project in Colorado has a mineral resource base estimate indicating resource of around 2.7 million pounds of vanadium—not to mention all the uranium they already know is there for additional upside.
“Vanadium is here, and lithium is scared because the $13-billion energy storage market has already found its new poster boy,” Rhoades told Oilprice.com.
The Moment of Truth
Indeed, Rhoades is an expert at timing.
The worldwide battle for vanadium is ramping up …
The Chinese have already had their Elon Musk moment …
The U.S. has none …
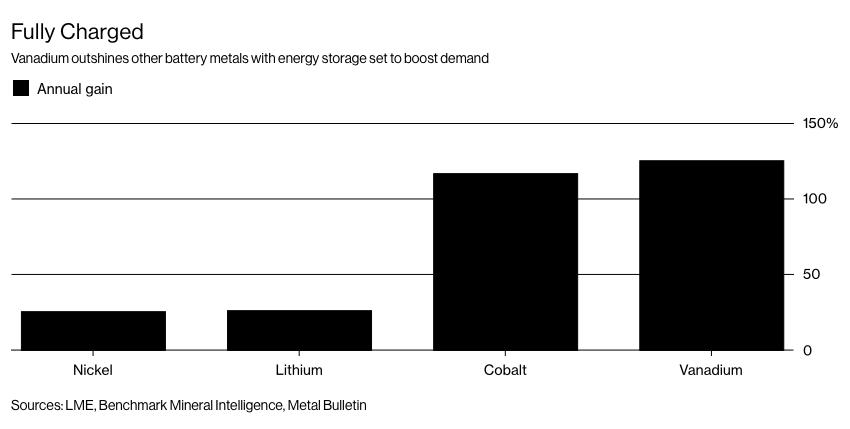
And vanadium was the best-performing battery metal last year, beating out even lithium and cobalt.
The truth is that it’s been a long road for vanadium to not only break into the energy storage market, but to actually become the future of the energy storage market.
The next ‘moment’ will be when someone in the U.S.—always one step behind the Chinese—announces plans for an American vanadium battery gigafactory. Anyone who hasn’t gotten in before that moment will be nursing their lithium hangover.
China is already building the world’s largest vanadium flow battery (VFB) gigafactory in Dalian, with the massively powerful (200MW/800MWh) batteries to be manufactured by Rongke Power.
And this year is the kicker. In just the past month, ferro vanadium prices have soared 33%. A month ago, ferro vanadium prices were at $79 per kilogram. Now we’re looking at $105 per kilogram.
Vanadium pentoxide flake is following the same speedy upward mobility:
And it’s vanadium pentoxide that is the main ingredient in vanadium redox flow batteries used for grid energy storage.
For a junior minor like UBM with a market cap of just over $10 million—that potential 2.7 million pounds of vanadium begins to sound like strategy at its best and brightest.
Why Vanadium Changes Everything
But let’s back up a bit …
If you were just getting the hang of lithium and cobalt in the battery mix, vanadium might sound complicated—but it’s not.
It’s as simple as size. This is where we get to scale up because when it comes to energy storage, bigger is better. In fact, bigger is the only way forward in this game.
This is possible because vanadium flow batteries store their energy in tanks. The fluid (electrolyte) that transfers charges inside a battery flows from one tank through the system and back again, making a closed circuit. They can charge and discharge simultaneously.
We’re talking tanks that can be as big as you want them: an aquarium, a shipping container or even an Olympic swimming pool—as big as your imagination can take you.
For renewable energy it is a game-changer. VRBs will forever change the capacity of wind and solar energy, making it limitless and cheap.
Vanadium is superior to lithium in every way. Not only does it have eternal life (unlike lithium), it’s not explosive, flammable or toxic.
Not only can it be scaled up cheaply, but it’s actually cheaper to scale it up, making it the antithesis of lithium.
Put in another way: It’s tough to scale up a lithium-ion system. If you double the size, you double the cost. Not so with vanadium: All you have to do is make the tank bigger, and the bigger the scale the lower the cost.
And that scaling up is already happening. Vanadium batteries are already providing complete energy storage system for $500 per kilowatt hour. In less than a year, that is expected to be down to $300. By 2020, we could be looking at $150/kilowatt hour.
A lithium-ion battery gigafactory couldn’t come close to this fast-paced cost reduction.
Vanadium: Finally, America Gets A Piece of the Pie
Even though this is the biggest energy story right now, vanadium isn’t just a bet on batteries—that’s why Mining.com calls it “the metal we can’t do without and don’t produce”.
Just as UBM’s new vanadium discovery is also an original uranium resource, vanadium can also be used in nuclear energy. By 2025, analysts estimate that 85 percent of all vehicles will incorporate vanadium alloy to reduce their weight and increase fuel efficiency.
Still, strategic as it is, America has fallen behind, and now that the global race for vanadium is on in the battery game, that will hurt.
In China, vanadium is already becoming the alternative to lithium. The next big moment will be this:
“If a vanadium battery producer steps forward with bold plans to produce vanadium flow at mass scale, giving the industry its Elon Musk or lithium ion moment, the potential for the technology to be the second most deployed ESS battery in the world is there,” says Simon Moores of Benchmark Mineral Intelligence, a battery materials research and price discovery provider out of London.
Rhoades certainly agrees and UBM is in that wonderful position of potentially becoming the only American source for the key rare earth metal that will power our scaled-up “liquid electricity” breakthrough.
“The vanadium flow battery scale-up for massive energy storage makes the electric vehicle push look like child’s play,” he said. “Lithium was a teaser. Vanadium is where it all gets huge.”
We watched lithium take center stage, but that may be just the prologue. Vanadium could be the conclusion.
Other companies in the booming commodity space you should keep an eye on:
Tesla Motors Inc. (NASDAQ:TSLA): No large cap company has dazzled over the past couple of years like Tesla, which overtook giant GM this year in market cap—a major, unexpected feat. Tesla is the future, and its stock price agrees.
Tesla’s electric cars will eventually be more profitable than traditional cars, and easier to produce. Costs will keep coming down, especially now that Tesla’s has launched its battery gigafactory in Nevada, and when it gets battery (and lithium) prices down.
It is entirely feasible that Tesla will be selling over 2 million cars annually in less 6-7 years from now, despite recent management issues.
General Motors (NYSE:GM) is a household name. GM was born at the turn of the 20th century and has been a leading innovator in the automotive industry ever since. Even though it’s been surpassed in market cap by Tesla (of all companies), it is still the furthest ahead of the Big 3 car makers from Detroit in terms of EVs and self-driving cars.
Recently, GM acquired Cruise Automation—a self-driving car company, and it seems determined to forge ahead even faster to play catch-up with the future. Additionally, GM is a leader in the booming electric vehicle market. As countries across the world begin to pass regulations on combustion engines, GM stands to gain significantly as an early adopter in the EV game.
Cameco Corporation (NYSE:CCJ) Cameco is one of the largest global producers and sellers of uranium and nuclear fuel. Its operating uranium properties include the McArthur River/Key Lake, Cigar Lake, and Rabbit Lake properties located in Saskatchewan, Canada; the Inkai property situated in Kazakhstan; the Smith Ranch-Highland property located in Wyoming, the United States; and the Crow Butte property situated in Nebraska.
While many analysts see low uranium prices as a problem for miners, the OPEC like move from world uranium leader Kazakhstan to bump prices has benefited Cameco and its peers significantly.
FMC Corp. (NYSE:FMC) founded in 1883, FMC has been around the block and back. FMC has a long history stretching between many different industries, but within all of them, FMC has remained a leader in innovation.
FMC’s involvement in the lithium industry is particularly notable. The company is one of the top three in lithium and associated technologies. And recently, the company announced that it will be launching a new company, Livent, which aims to raise $100 million in an initial public offering to establish its place as a dominant lithium supplier.
Ballard Power Systems (NASDAQ:BLPD) Ballard develops and produces hydrogen fuel cell products for markets such as heavy-duty motive, portable power, material handling and transportation. In addition to its production and development of fuel cell products, Ballard also holds over 2,000 patents/applications.
At the end of August, Ballard announced a huge divestment agreement, releasing non-core assets to Revision Military Ltd., for up to $16 million in cash to provide a hefty boost to its fuel cell business.
By. James Burgess
Forward-Looking Statements
This article contains forward-looking information which is subject to a variety of risks and uncertainties and other factors that could cause actual events or results to differ from those projected in the forward-looking statements. Forward looking statements include that United Battery Metals has a vanadium resource that it can economically mine, and that vanadium will be a key element in future energy storage. UBM may not be able to mine its resource, even if a substantial resource is verified on its property, as a result of lack of lack of funds, lack of permits, labor or equipment, environmental issues may arise to block mining, and there may not be economically viable way to mine the resources there. The type of vanadium on UBM’s property may not be the right type for maximum energy storage. In energy storage, other technologies may become better, cheaper, more available or simply become the standard in the industry. Vanadium storage batteries may never achieve their hoped for success. Other sources of vanadium may become plentiful and therefore much cheaper than expected.
PAID ADVERTISEMENT. This communication is a paid advertisement and is not a recommendation to buy or sell securities. Oilprice.com, Advanced Media Solutions Ltd, and their owners, managers, employees, and assigns (collectively “the Company”) has been paid by the profiled company or a third party to disseminate this communication. In this case the Company has been paid by United Battery Metals fifty nine thousand two hundred and eighty six US dollars for this article alone as part of a media marketing campaign which also includes other articles. This compensation is a major conflict with our ability to be unbiased. This communication is for entertainment purposes only. Never invest purely based on our communication.
We do not guarantee the timeliness, accuracy, or completeness of the information on our site or in our newsletters. The information in our communications and on our website is believed to be accurate and correct, but has not been independently verified and is not guaranteed to be correct. The information is collected from public sources, such as the profiled company’s website and press releases, but is not researched or verified in any way whatsoever to ensure the publicly available information is correct.
NOT AN INVESTMENT ADVISOR. Oilprice.com is not registered or licensed by any governing body in any jurisdiction to give investing advice or provide investment recommendation. ALWAYS DO YOUR OWN RESEARCH and consult with a licensed investment professional before making an investment. This communication should not be used as a basis for making any investment. Our predictions of what might occur in the energy industry are just predictions, and there is no assurance that our predictions will actually happen.
RISK OF INVESTING. Investing is inherently risky. While a potential for rewards exists, by investing, you are putting yourself at risk. You must be aware of the risks and be willing to accept them in order to invest in any type of security. Don’t trade with money you can’t afford to lose. This is neither a solicitation nor an offer to Buy/Sell securities.
RISK OF BIAS. We often own shares in the companies we feature. For those reasons, please be aware that we are extremely bias in regards to the companies we write about and feature in our newsletter and on our website.
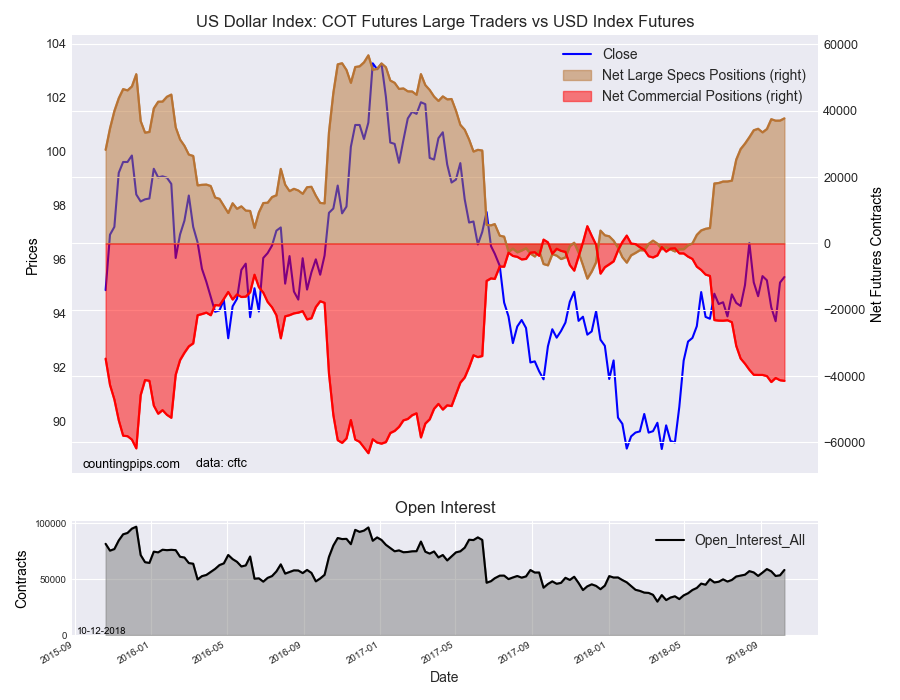
US Dollar Index bets are highest since May 2017, NZD bets go record short
The latest data for the weekly Commitment of Traders (COT) report, released by the Commodity Futures Trading Commission (CFTC) on Friday, showed that large traders and speculators once again raised their bullish bets for the US Dollar Index while betting against many of the major currencies and increasing their bearish positions. See full article
The non-commercial contracts of WTI crude futures totaled a net position of 528,051 contracts, according to data from this week. This was a slide of -20,858 contracts from the previous weekly total. See full article
The large speculator contracts of gold futures totaled a net position of -38,175 contracts. This was a weekly decline of -16,353 contracts from the previous week. See full article
The large speculator contracts of 10-year treasury note futures totaled a net position of -622,422 contracts. This was a weekly increase of 117,770 contracts from the previous week. See full article
The large speculator contracts of S&P500 Mini futures totaled a net position of 255,819 contracts. This was a rise of 27,784 contracts from the reported data of the previous week. See full article
The non-commercial contracts of silver futures totaled a net position of -22,250 contracts, according to data from this week. This was a weekly fall of -4,752 contracts from the previous totals. See full article
The large speculator contracts of copper futures totaled a net position of 8,247 contracts. This was a weekly shortfall of -3,728 contracts from the data of the previous week. See full article
The Commitment of Traders report data is published in raw form every Friday by the Commodity Futures Trading Commission (CFTC) and shows the futures positions of market participants as of the previous Tuesday (data is reported 3 days behind).
US Dollar Index speculator positions are at highest level since May 2nd of 2017
The latest data for the weekly Commitment of Traders (COT) report, released by the Commodity Futures Trading Commission (CFTC) on Friday, showed that large traders and speculators once again raised their bullish bets for the US Dollar Index while betting against many of the major currencies and increasing their bearish positions.
The non-commercial futures contracts of US Dollar Index futures, traded by large speculators and hedge funds, totaled a net position of 37,709 contracts in the data reported through Tuesday October 9th. This was a weekly boost of 673 contracts from the previous week which had a total of 37,036 net contracts.
The speculative position in the USD Index has risen for two straight weeks and for the twenty-third time out of the past twenty-five weeks. The current standing is at the highest bullish level since May 2nd of 2017 when the net position totaled 40,020 contracts.
Individual Currencies Data this week:
In the individual currency contracts data, we did not see any substantial changes (+ or – 10,000 contracts) in the speculators category this week but we did have some notable levels hit by some of the major currencies.
Euro bets dropped rather sharply for a 2nd straight week and are in bearish territory for a second conseuctive week. Euro spec positions have gone from a position of over +100,000 contracts in late May to a total of -16,142 contracts this week.
Japanese yen positions fell for the sixth consecutive week. The yen position is above the -110,000 net contract level for a second straight week and is now at the highest bearish standing since February 13th.
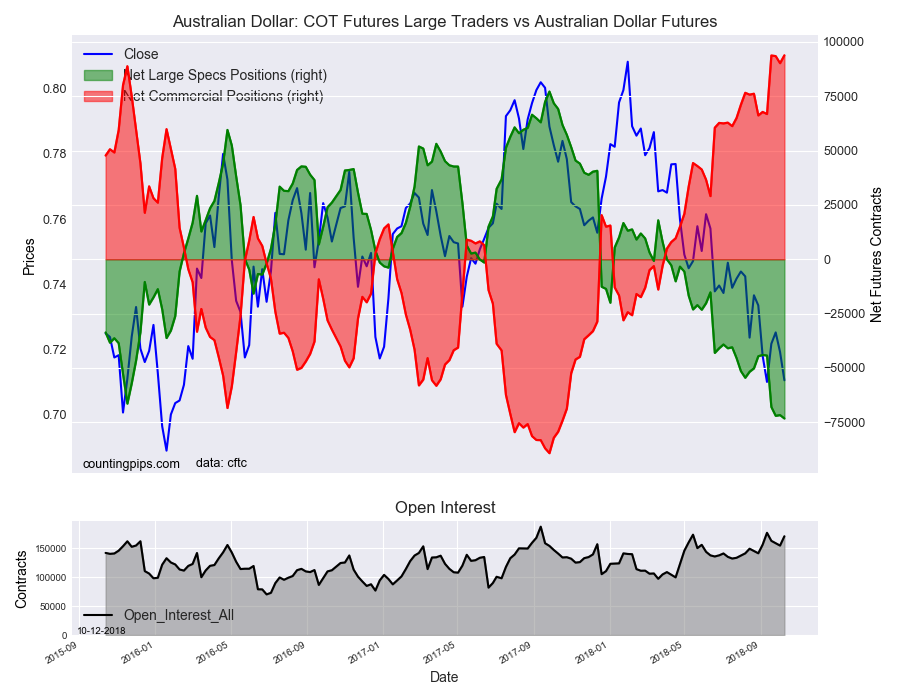
Australian dollar positions declined for the fourth time out of the past five weeks. The current standing for the Aussie spec bets is now at the most bearish level since March 10th of 2015 when the net position equaled -76,851 contracts.
New Zealand “kiwi” dollar speculator bearish bets advanced this week after two weeks of small declines. The rise in bearish positions has now put the current standing at the most bearish level on record (our data going back to 1999) at above -33,000 net contracts.
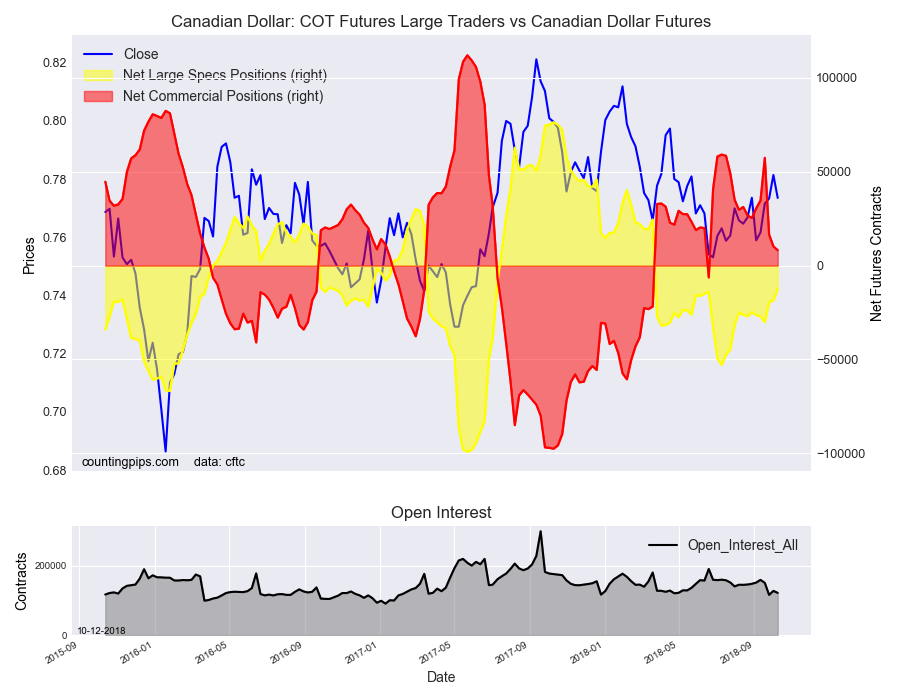
Overall, the currencies that improved this week were the US Dollar Index (673 weekly change in contracts), Swiss franc (599 contracts), Canadian dollar (6,339 contracts) and the Mexican peso (620 contracts).
The currencies whose speculative bets decreased this week were the euro (-9,041 weekly change in contracts), British pound sterling (-1,167 contracts), Japanese yen (-1,155 contracts), Australian dollar (-1,566 contracts), and the New Zealand dollar (-3,224 contracts).
See the table and individual currency charts below.
Table of Weekly Commercial Traders and Speculators Levels & Changes:
Currency
Net Commercials
Comms Weekly Chg
Net Speculators
Specs Weekly Chg
EuroFx
-5,438
4,062
-16,142
-9,041
GBP
76,085
-2,580
-60,507
-1,167
JPY
138,202
2,202
-115,201
-1,155
CHF
27,715
4,619
-12,803
599
CAD
8,203
-2,084
-12,145
6,339
AUD
93,869
3,622
-73,284
-1,566
NZD
38,042
2,747
-33,820
-3,224
MXN
-78,809
-1,562
74,449
620
This latest COT data is through Tuesday and shows a quick view of how large speculators or non-commercials (for-profit traders) as well as the commercial traders (hedgers & traders for business purposes) were positioned in the futures markets. All currency positions are in direct relation to the US dollar where, for example, a bet for the euro is a bet that the euro will rise versus the dollar while a bet against the euro will be a bet that the dollar will gain versus the euro.
Weekly Charts: Large Trader Weekly Positions vs Price
EuroFX:
British Pound Sterling:
Japanese Yen:
Swiss Franc:
Canadian Dollar:
Australian Dollar:
New Zealand Dollar:
Mexican Peso:
*COT Report: The weekly commitment of traders report summarizes the total trader positions for open contracts in the futures trading markets. The CFTC categorizes trader positions according to commercial hedgers (traders who use futures contracts for hedging as part of the business), non-commercials (large traders who speculate to realize trading profits) and nonreportable traders (usually small traders/speculators). Find CFTC criteria here: (http://www.cftc.gov/MarketReports/CommitmentsofTraders/ExplanatoryNotes/index.htm).
The Commitment of Traders report is published every Friday by the Commodity Futures Trading Commission (CFTC) and shows futures positions data that was reported as of the previous Tuesday (3 days behind).
Each currency contract is a quote for that currency directly against the U.S. dollar, a net short amount of contracts means that more speculators are betting that currency to fall against the dollar and a net long position expect that currency to rise versus the dollar.
(The charts overlay the forex closing price of each Tuesday when COT trader positions are reported for each corresponding spot currency pair.) See more information and explanation on the weekly COT report from the CFTC website.
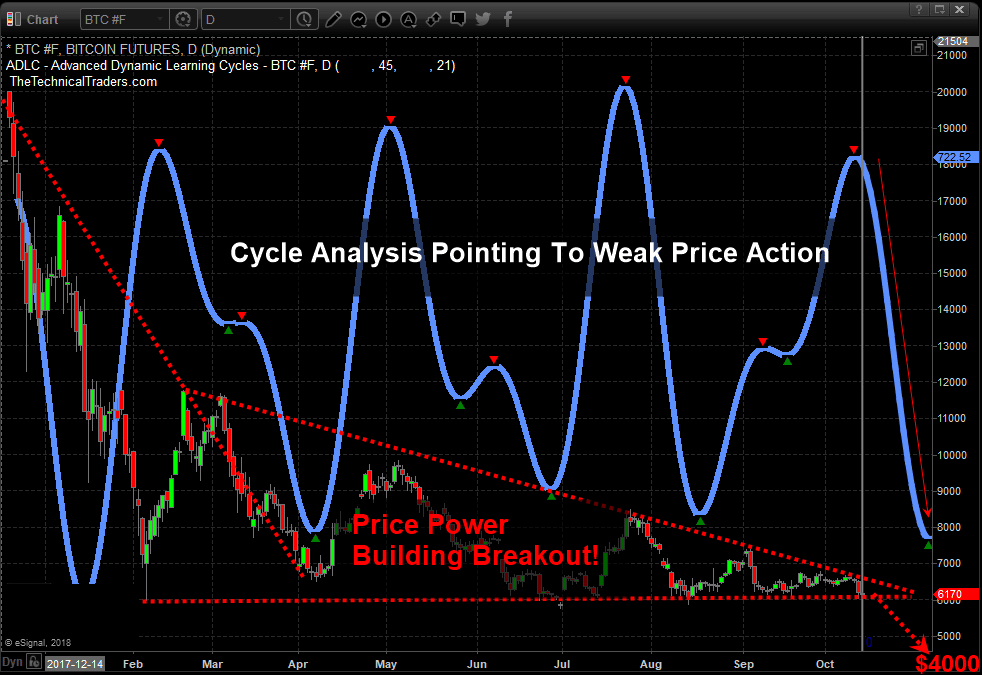
Recent market turmoil across the global stock markets has refocused investors on the concerns of global economics, trade, and geopolitical issues – away from cryptocurrencies. The biggest, Bitcoin, has been under extended pricing pressure recently and our research team believes Bitcoin will breach the $6000 level to the downside fairly quickly as extended global market downtrends continue.
The premise of our analysis is simple, the factors weighing on foreign investors and Bitcoin investors are that currencies are fluctuating wildly, local stock markets are declining and local economies may be contracting. All of this operates as a means for investors to turn to a “protectionism” stance where they attempt to protect capital/cash and attempt to limit downside risks. The fact that Bitcoin has yet to break higher and has continued to fall under further pricing and adoption pressure means those investors that were hungry for the next great rally may be getting tired of waiting for this next move – if it ever happens. Our belief is that any downside pressure in Bitcoin below $5800 will likely push many crypto enthusiasts over the end and prompt them to sell out before prices attempt to move down further.
Our research team believes a deeper downside price rotation is setting up in Bitcoin that will push prices below the $5000 level before the end of this year. The uncertainty of the global equities markets are creating an environment where cryptos have simply lost their appeal. There has been no real substantial upside price move over the past 6+ months and the FLAG formation setting up is a very real warning sign that the eventual breakout move could be very dangerous.
Additionally, when we add our proprietary Advanced Learning Cycle system to the research, which points to much lower price rotation over the next 30+ days, we begin to see the very real possibility that Bitcoin could fall below $5000 very quickly and potentially target $4000 as an ultimate low.
As much as we would like to inform our followers that we believe Bitcoin will rally back to $18k fairly quickly, that is simply not the case. All of our indicators are suggesting that Bitcoin will fall to below $5000, and possibly towards $4000, before any real support is found. If you are a bitcoin believer, be aware that you may have a substantial opportunity to use your skills at this price swing plays out. Looking to buy back in near $4000 is much better than trying to hold for an additional $2000 loss.
Visit TheTechnicalTraders.com to learn more about our research team and resources to help you become a better trader. Be prepared and build your skills to target greater success with our dedicated team. Read some of our other research to see for yourself how well we’ve been calling these recent market moves. Isn’t it time you invested in your future success?