Italian budget woes, US and Italian government bond yields, Brexit, and expectations of further Fed rate hikes have the Forex market on edge.
High volatility on EURUSD persisted throughout the day. The overall strengthening of the US dollar and problems in the EU sent the euro to 1.1449.
The European Commission rejected Italy’s draft budget for 2019. EU leaders said the Brexit transition period could be extended. ECB Head Mario Draghi believes that Brexit’s influence on the economy will be limited. In addition, the dollar continues to receive support from the FOMC minutes published on Wednesday.
Day’s news (GMT+3):
11:00 Eurozone: current account n.s.a. (Aug).
11:30 UK: public sector net borrowing (Sep).
15:30 Canada: CPI (Sep), retail sales (Aug).
17:00 US: existing home sales change (Sep).
19:00 US: FOMC Member Bostic speech.
19:10 UK: BOE’s Governor Carney speech.
20:00 US: Baker Hughes US oil rig count.
Fig 1. EURUSD hourly chart.
Current situation:
The price is bouncing through the Gann levels like a ball down the stairs. It rose from the 112th degree to 1.1527. Buyers could not immediately gain a foothold above 1.1500. In the US session, they returned to 1.1518, but were again thrown back. Then they began to close long positions, which accelerated the fall below 112 degrees, to 1.1449. The fall continued after 11 hours of correction.
The price is falling in the form of a complex wave structure. According to this, the market still has to form a downward impulse to form a double bullish divergence. If sellers demolish 1.14, then we can forget about the one divergence which formed, and prepare for the euro to weaken to 1.1370.
The rise of digital currency has created an abundance of new investment opportunities. If you are considering investing in cryptocurrency, one of your first questions is likely concerning what coin to choose. Of course, you have the option of investing in multiple cryptocurrencies, but are you better off spending your Bitcoin to buy alternative currencies or just keeping it and waiting for the value to spike? There are a lot of pros and cons to consider.
2017 was a great year for cryptocurrencies, and this is true for Bitcoin as well as for altcoins. 2018 started out bumpy. While many cryptocurrencies were able to bounce back fairly quickly, others, such as Ethereum, continue to struggle. Yet, overall, the value of the top ten altcoins is expected to increase again in 2018. It all seems like a wild rollercoaster ride, which is out of anyone’s control, but in fact, this is how the cryptocurrency market works.
For beginners, navigating this volatile crypto space can be challenging as it seems like prices fall and rise randomly, often with little warning or explanation. So, which coin to invest in if you want to be on the safe side?
Bitcoin Is a Safe Bet
Bitcoin is the most established of all digital currencies. The community saw the BTC to USD value rise last year by more than 1,000%. Although Bitcoin has a reputation for being volatile, it has managed to overcome every slump that it has had, proving its resilience time and again.
Despite being the most significant cryptocurrency, Bitcoin remains small when compared to major fiat currencies like euro and dollar. At this point in time, it might still be hard to imagine a world where digital currency replaces fiat, but the global economy is shifting towards it. Wide adoption might not take as long as you might think. If Bitcoin becomes a widely used payment method, investments will really pay off. Of all the cryptocurrencies out there, Bitcoin is probably the one that has the most potential to have mass adoption. If you want to earn some extra cash and want to play it safe, Bitcoin is an attractive option.
Another thing to consider is the state of the market right now. The price of BTC has been relatively stable the past few weeks, even as many altcoins like Ethereum have been on downward spirals. One theory is that people have been turning to Bitcoin considering it as a safety net, which would explain why Bitcoin has avoided the struggles that other altcoins are facing right now. Basically, investors were worried that the crypto market was in trouble, so a lot of people transferred their altcoin investments into Bitcoin. They thought Bitcoin would be more stable, and it became a self-fulfilling prophecy.
There are also political concerns. Recently, instability in Turkey has led many people who reside in the area to invest in cryptocurrency to prevent the devaluation of their fiat money. Bitcoin benefited unevenly from this development. Since Bitcoin is the most well-known and reputable digital coin, it becomes the go-to when people need to make quick and unexpected decisions.
What about Altcoins?
The growth of Bitcoin was all the talk at the end of the 2017, but some altcoins, like XRP, had an even better year. Theoretically, you can earn a much bigger profit by investing in altcoins, but it’s riskier. There are over a thousand alternatives to Bitcoin, so choosing one requires a lot of thought and analysis. It is a good idea to avoid less established coins because they will be less predictable. You want to stick to the top ten, or even top twenty coins. If you invest in an altcoin you’ve never heard of, you also risk falling for a scam.
Diversification is important. Even though XRP had an amazing year, you wouldn’t want to invest all your money into it only. A good idea would be to assess the best-performing altcoins and try to predict which ones will continue to experience growth. Right now, enough of the top-rated altcoins are showing signs of success.
Another important thing to consider is fraud. Various altcoins provide their holders with protection against fraud. Things like hacking and identity theft are so commonplace right now that enabling increased security will help altcoins to continue appealing to new investors.
Conclusion
It is difficult to navigate the risks and potential rewards when it comes to investing in crypto because things change so rapidly. The important thing is to do your research. The more analytical price prediction tools you have at your disposal, the better.
There is no right answer for what to invest in. There is a potential for both profit and loss. While Bitcoin might be a smarter investment right now, it would be reasonable to invest in it along with some altcoins. The cryptocurrency market could look completely different in three months from now. You don’t want to base your decision just on what you can see in front of you. You have to think ahead. The major altcoins have already reshaped the cryptocurrency landscape in recent months and there are lots of changes to expect.
About the Author: Mary Ann Callahan
As an expert on Bitcoin-related topics, I’ve found myself as a Journalist at Cex.io – cryptocurrency exchange. I’m working on articles related to blockchain security, bitcoin purchase guides or bitcoin regulations in different countries.
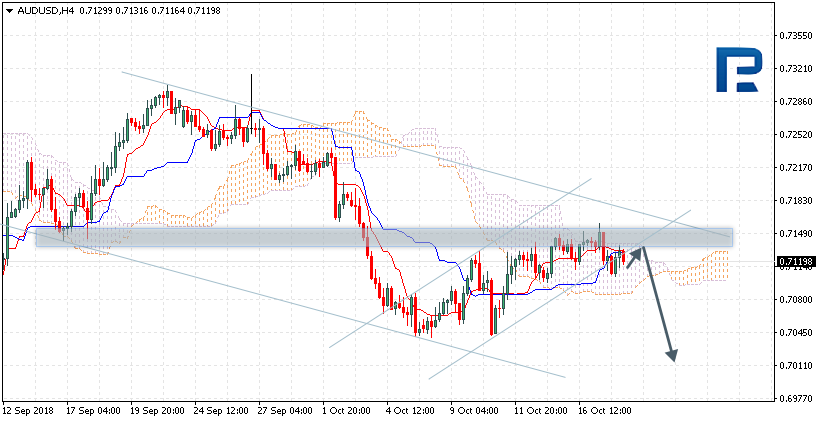
AUDUSD is trading at 0.7119; the instrument is moving inside Ichimoku Cloud, thus indicating a sideways tendency. The markets could indicate that the price may test the upside border of the cloud at 0.7125 and then resume moving downwards to reach 0.7010. However, the scenario that Implies further decline may be cancelled if the price breaks the upside border of the cloud and fixes above 0.7160. In this case, the pair may continue growing towards 0.7250. After breaking the cloud’s downside border and fixing below 0.7075, the price may continue moving downwards.
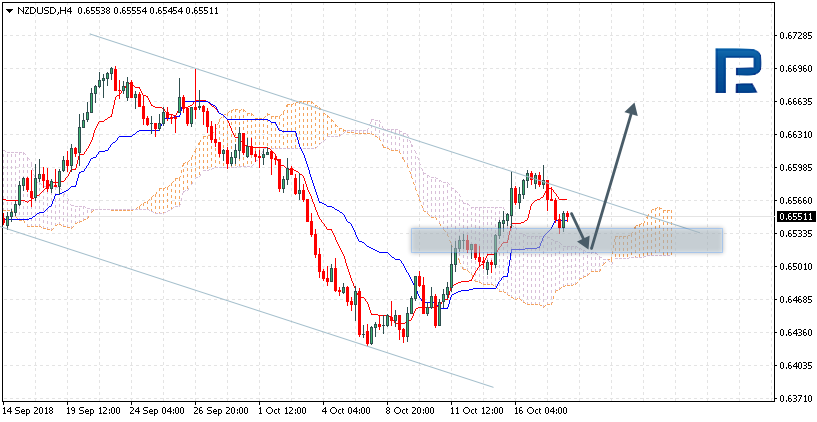
NZDUSD, “New Zealand Dollar vs US Dollar”
NZDUSD is trading at 0.6551; the instrument is moving above Ichimoku Cloud, thus indicating an ascending tendency. The markets could indicate that the price may test the upside border of the cloud at 0.6525 and then resume moving upwards to reach 0.6665. Another signal to confirm further ascending movement is the price’s rebounding from the support level. However, the scenario that Implies further growth may be cancelled if the price breaks the downside border of the cloud and fixes below 0.6485. In this case, the pair may continue falling towards 0.6385.
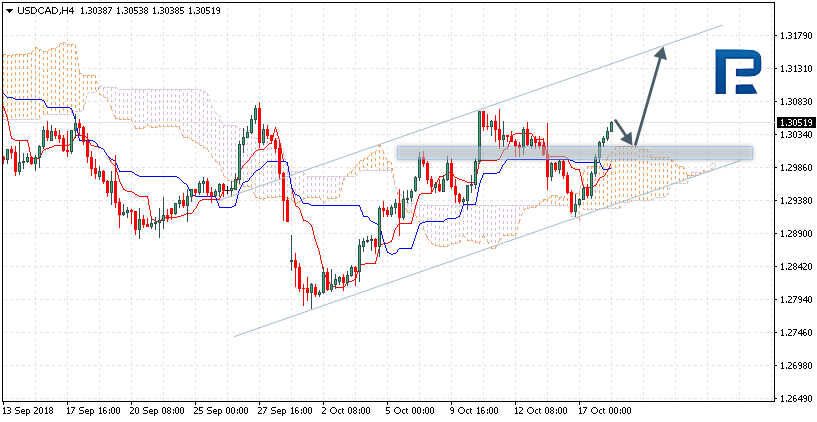
USDCAD, “US Dollar vs Canadian Dollar”
USDCAD is trading at 1.3051; the instrument is moving above Ichimoku Cloud, thus indicating an ascending tendency. The markets could indicate that the price may test the upside border of the cloud at 1.3020 and then continue moving upwards to reach 1.3145. Another signal to confirm further ascending movement is the price’s rebounding from the support level. However, the scenario that implies further growth may be cancelled if the price breaks the downside border of the cloud and fixes below 1.2935. In this case, the pair may continue falling towards 1.2825.
Attention! Forecasts presented in this section only reflect the author’s private opinion and should not be considered as guidance for trading. RoboForex LP bears no responsibility for trading results based on trading recommendations described in these analytical reviews.
On Thursday morning, USDJPY is trading downwards; investors need “safe haven” assets again.
The Japanese yen is getting stronger against the USD on Thursday morning. The current quote for the instrument is 112.50.
Japan published several macroeconomic reports today, which may seem really interesting. The Import added 7.0% y/y in September after expanding by 15.3% y/y the month before. The Export dropped 1.2% y/y after increasing by 6.6% y/y in August and against the expected reading of +1.9% y/y. This is the first time the indicator has fallen since November 2016.
The current decline may indicate the same for the Japanese GDP in the third quarter.
The components of the report show that vehicles export to the USA lost 7.0% y/y. In general, sales from Japan to the USA decreased by 0.2% y/y due to drops in transport equipment, motor vehicles, and scientific and optical instruments.
The USA are still monitoring Japan due to the absence of trade agreement between two countries. Earlier, the USA representatives said that the Japanese market was very important, but not efficient for the American export. The USA still haven’t decided on increasing import duties for Japanese goods, but there is a possible scenario, which implies that the US government might do the same as they did to China.
Attention! Forecasts presented in this section only reflect the author’s private opinion and should not be considered as guidance for trading. RoboForex LP bears no responsibility for trading results based on trading recommendations described in these analytical reviews.
Yesterday, the EUR/USD currency pair was characterized by an aggressive sell-off. The quotes have lowered by more than 80 points. The investors warmed up towards the USD after the FOMC meeting minutes publication. At the moment the local support and resistance levels are 1.14900 and 1.15200 respectively. The positions should be opened from these levels.
The economic news feed on 18.10.2018:
– Philadephia Fed manufacturing index at 15:30 (GMT+3:00)
The price fixed below 50 MA and 200 MA, which shows the sellers’ power.
The MACD histogram is in the negative zone, but above the signal line, which shows a weak signal towards the EUR/USD sale.
The Stochastic Oscillator is in the neutral zone, the %K line is above the %D line, which indicates the bullish sentiment.
Trading recommendations
Support levels: 1.14900, 1.14500
Resistance levels: 1.15200, 1.15500, 1.15800
If the price fixes above the resistance level 1.15200, we can expect the correction of the EUR/USD quotes. The movement tends towards 1.15500-1.15800.
Alternatively, the EUR/USD currency pair can lower towards 1.14500-1.14200.
The GBP/USD currency pair
Technical indicators of the currency pair:
Prev Open: 1.31783
Open: 1.31128
% chg. over the last day: -0.64
Day’s range: 1.31127 – 1.31152
52 wk range: 1.2361 – 1.4345
Yesterday the GBP/USD currency pair has been showing bearish sentiment. The British pound is heavily weakened against the USD after the publication of the weak economical statistics from Great Britain. For example, the consumer price index lowered to 2.4%, while the experts expected 2.6%. At the moment, the local support and resistance levels are 1.30900 and 1.31250 respectively. Positions should be opened from these levels. The trading instrument has a potential for further decline.
Economic news feed on 18.10.2018:
– Retail sales statistics in the UK at 11:30 (GMT+3:00).
The indicators show the sellers’ power: the quotes are being traded below 50 МА and 200 МА.
The MACD histogram is in the negative zone, but above the signal line, which gives a weak signal towards the GBP/USD sell-off.
The Stochastic Oscillator is in the negative zone, the %K line is above the %D line, which indicates the bullish sentiment.
Trading recommendations
Support levels: 1.30900, 1.30600
Resistance levels: 1.31250, 1.31600, 1.32000
If the price fixes above the resistance level of 1.31250, we can expect the further correction of the GBP/USD quotes. The movement tends towards 1.31600-1.31850.
Alternatively, the GBP/USD currency pair can lower towards 1.30600-1.30300.
The USD/CAD currency pair
Technical indicators of the currency pair:
Prev Open: 1.29331
Open: 1.30161
% chg. over the last day: +0.71
Day’s range: 1.30324 – 1.30383
52 wk range: 1.2059 – 1.3795
The USD/CAD currency pair is showing an aggressive buy-out. During the yesterday’s and today’s trading, the quotes have grown by more than 100 points. At the moment, the local support and resistance levels are 1.30250 and 1.30550 respectively. Positions should be opened from these levels. The USD/CAD currency pair has a potential for further growth.
The economic news feed for Canada is calm today.
The indicators show the buyers’ power: the price is being traded above 50 МА and 200 МА.
The MACD histogram is in the positive zone, but below the signal line, which gives a weak signal towards the purchase of USD/CAD.
The Stochastic Oscillator is in the negative zone, the %K line is below the %D line, which indicates the bearish sentiment.
Trading recommendations
Support levels: 1.30250, 1.29900, 1.29500
Resistance levels: 1.30550, 1.30800, 1.31000
If the price fixes above the resistance level 1.30550, we can expect further growth of the USD/CAD quotes. The movement will tend towards 1.30800-1.31000.
Alternatively, the price fixes below the support level of 1.30250, you have to look for the market entry points to open short positions. The price will tend towards 1.29900-1.29700.
The USD/JPY currency pair
Technical indicators of the currency pair:
Prev Open: 112.258
Open: 112.641
% chg. over the last day: -0.33
Day’s range: 112.556 – 112.629
52 wk range: 104.56 – 114.74
Yesterday, the USD/JPY currency pair was showing the bullish sentiment. The growth of the quotes has gone over 50 points. The trading instrument has updated the local maximums. At the moment, the “safe haven” currency is consolidating. The local support and resistance levels are 112.400 and 112.700 respectively. Positions should be opened from these levels.
Today, some ambiguous data about the Japanese trading balance was published during the Asian trading session.
The indicators show the buyers’ power: the USD/JPY quotes fixed above the 50 МА and 200 МА.
The MACD histogram is in the positive zone, but below the signal line, which indicates a small signal towards the purchase of USD/JPY.
The Stochastic Oscillator is in the negative zone, the %K line is above the %D line, which indicates the growth of the quotes.
Trading recommendations
Support levels: 112.400, 112.000, 111.700
Resistance levels: 112.700, 113.000, 113.300
If the price fixes above the resistance level 112.700, further growth of the USD/JPY quotes can be expected. The movement will tend towards 113.000-113.300.
Alternatively, if the price fixes below the mirror support of 112.400, we recommend looking for entry points to the market to open the short positions. The movement will tend towards 112.000-111.700.
Our research team was hard at work over the past few days. Not only were they able to call this downside price swing 3+ weeks in advance, they also called the market bottom within 0.5% of the absolute lows. Now, they have put together a suggested “map” of what to expect in regards to price rotation, support, resistance and the eventual price breakout that we are expecting to happen near or after November 8~12. Today, we are sharing this detailed map with all of our followers.
Our research team, at www.TheTechnicalTraders.com, have honed their skills over the past few decades by studying market correlations, price relationships, advanced price modeling and more. Our objective is to be able to identify price patterns, opportunities, and setups while attempting to accurately predict the future of price so that we can keep our followers and members uniquely aware of future opportunities. As you can imagine, it is not an easy job and we often take heat for some of our research posts.
Today, we are sticking out neck out (again) and attempting to predict the future of the ES price rotation as this deeper rotation continues to play out. Our research team believes it has identified key price levels and dates/times that are relevant to this future price rotation. By no means is this research set in stone in regards to exact dates/times. These are suggestions which we believe to be accurate based on our research and analysis of the markets. Use them as guides to how this price rotation plays out.
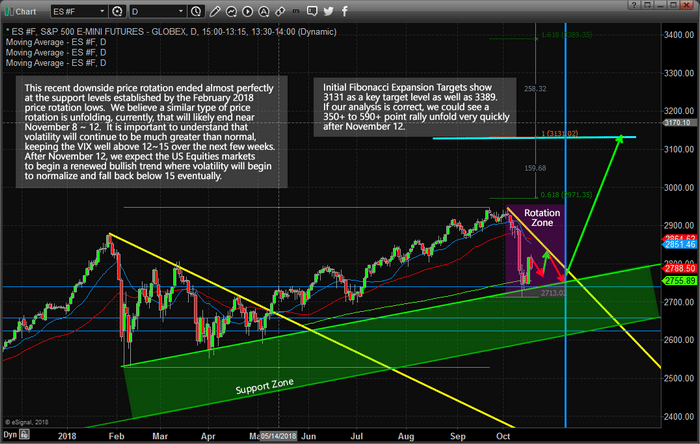
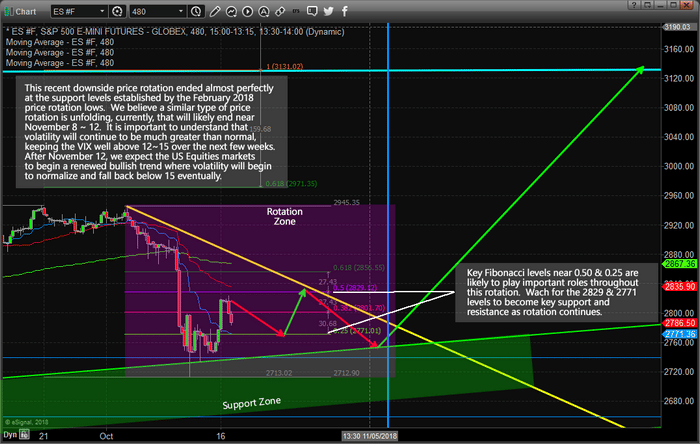
This first chart is a Daily ES chart that shows three very important components of the current market price rotation.
_ The Support Zone below the recent lows is actually very critical to the true understanding of price rotation. As long as this support zone is not completely breached, prices should continue to push higher overall.
_ The Rotation Zone is where we believe the price will continue to consolidate within a fairly tight range before the November 8 ~ 12 bottom sets up. Volatility will continue to be greater than normal throughout this Rotation Zone.
_ The post-November 8 ~12 breakout is likely to attempt to target 3131 initially (a Fibonacci extension target) and we believe this move higher could explode fairly quickly.
Now that we have explained the general sense of our research, let’s dig into the numbers a bit.
Our expectation is that a price peak will occur near early morning trading on October 26 (morning session in NY). We believe this peak will end near 2830 (a Fibonacci 50% retracement level) and we believe an extended basing pattern will precede this price peak. The extended basing pattern, which is expected to end near 2770 (a Fibonacci 25% retracement level) is already starting to form and should last from now until near October 23 or 24. We believe the upside move between the end of the basing pattern and the October 26th peak will be very fast and end fairly quickly – so be prepared.
The October 26 price peak will set up a very important component of our final analysis – the peak-to-peak price channel (highlighted in YELLOW now) and will allow us to determine when and where price volatility predicts the breakout move to occur. Our research team believes another bout of extended basing will occur after the October 26th peak that will likely push just below the 2771 support levels (to near 2750) retesting the Support Zone and presenting a “false low price breakout” pattern that may sucker many longs out of the market (and potentially set up massive short seller pressures in the market). This move may be critical to the eventual upside breakout that we are predicting.
Think of it like this, Fibonacci price theory suggests that price MUST attempt to establish new higher high prices or lower low prices at all times. Failure to accomplish these new price levels results in a consolidating/congesting price trend that typically forms as Pennants or Flags in price. Near the Apex of these pennant/flag formations, false breakouts (or what we call “washout lows or highs”) are common. These are price functions that operate as a “shakeout move” where price searches for direction and where buyers and sellers are stacked on top of one another attempting to ride the next wave. Price MUST attempt to establish a new higher high or lower low – so it must attempt to rally up and break the 2945 level or it must selloff ant attempt to break the 2712 level. We expect extreme volatility near or after the November 8~12 apex setup. Price could fall deep into the Support Zone before reversing higher with a bigger rally that attempts to run well above the 2945 level.
The vertical blue line is the November 8 date where we expect the absolute bottom to form and where we expect the next big price rally to initiate. Near after this date, we expect the price to rotate with greater volatility and attempt an upside breakout move near or after November 12. The key Fibonacci levels at 2771 & 2829 are certain to become key price rotation levels near this November 8 ~ 12 price breakout.
At this point, we have outlined some very detailed and structured price rotation levels that should clearly help you understand what is transpiring within the US Equities markets right now. If you take only one thing away from reading this article, please understand the Support Zone that we’ve highlighted on our charts is super-critical to the ability for the US Equities markets to continue to push higher. If this level is completely breached by lower prices (prices falling all the way below these price channels on the Daily chart, above), then our predictions of price rotation, extended basing and an ultimate upside price breakout are invalid. This Support Zone MUST hold for our analysis to become valid.
This level of research and understanding as related to technical and price analysis is not something one stumbles upon blindly. This takes years of study, practice, research, and understanding to be able to “see into the future” as we do. Sure, anyone that understands basic trend lines and Fibonacci concepts can draw some lines on a chart – but their overall success rate will quickly illustrate their true understanding of the markets. Take a minute to visit Technical Traders Ltd. website and read some of our recent research posts and pay attention to how we accurately predicted a 5~8% price correction 3+ weeks before this recent move happened. Ask yourself, how did we know it was going to happen and how did we know it would stop near 2700? Visit TheTechnicalTraders.comto read all of our recent research posts or read how we predicted this downside price move by clicking here: https://www.thetechnicaltraders.com/predictive-trading-model-suggests-falling-stock-prices-us-elections/
The US dollar strengthened significantly against a basket of major currencies after the publication of the FOMC meeting minutes. The dollar index (#DX) updated the weekly high and closed in the positive zone (+0.63%). Most Fed politicians support a further increase in interest rates. At the moment, more than 80% of financial market participants expect the Central Bank to raise the key interest rate at a meeting in December.
The British pound weakened strongly against the US currency after the publication of weak economic data in the UK. Thus, the consumer price index fell to 2.4% in September, while experts expected 2.6%. The pound is under pressure due to the uncertainty on the issue of Brexit. Meanwhile, the consumer price index in the Eurozone remained unchanged at 2.1% in September.
Today, during the Asian trading session, ambiguous data on the trade balance of Japan have been published. Australia reported that in September, the employment rate slowed down to 5.6K and was worse than the expected value of 15.2K. At the same time, the unemployment rate fell from 5.3% to 5.0%.
Oil quotes are declining amid the increase in crude oil inventories in the United States. At the moment, futures for the WTI crude oil are testing a mark of $69.60 per barrel.
Market Indicators
Major US stock indices show the variety of trends: #SPY (+0.02%), #DIA (-0.37%), #QQQ (+0.04%).
At the moment, the 10-year US government bonds yield is at the level of 3.19-3.20%.
Important economic reports on 18.10.2018:
– Statistics on retail sales in the UK at 11:30 (GMT+3:00); – Philadelphia Fed manufacturing index at 15:30 (GMT+3:00).
On Wednesday, the 17th of October trading on the euro closed down. The euro sank to 1.1496 amid a general strengthening of the dollar and uncertainty surrounding Brexit negotiations and the Italian budget.
Germany is making contingency plans for a no deal on Brexit. This was reported by German Chancellor Angela Merkel. The German publication Spiegel, citing European Commissioner for Budget and Human Resources Gunther Oettinger, reported that the European Commission decided to reject Italy’s draft budget for 2019.
In addition to the problems in Europe, the dollar was supported by the minutes of the Fed meeting. The minutes showed that the regulator will continue to raise interest rates.
17:30 US: EIA natural gas storage change (Oct 12).
19:15 US: Fed’s Quarles speech.
Fig 1. EURUSD hourly chart.
Current situation:
The euro slowed the decline at around the 112th degree. The technical upward correction is overdue, but I think it will start at 1.1460-1.1487. Given that the European Commission rejected Italy’s draft budget, it would be better to buy against the downward movement when we get closer to the 135th degree.
Oettinger said that the Italian budget for 2019 does not comply with the requirements and regulations set by the EU. Rome now needs to amend the budget and submit it to the Commission. Ideally, I see a rebound from 1.1460 with the target of 1.15 (on Thursday) and 1.1525 (on Friday).
Over 300 financial instruments that have been exclusively accessible to Admiral Markets Pro users are now available to all Retail clients with Admiral.MT5 accounts.
The latest additions to Admiral Markets’ range of commodity CFDs now allow Retail traders to take leveraged exposure in the highly volatile markets of copper, cocoa, coffee arabica, coffee robusta, cotton, orange juice, raw sugarand white sugar.
The company has also extended its offer of thematic and diversified investment opportunities for Retail clients. Admiral.MT5 account holders can now access 300+ CFDs on high-volume Exchange-traded Funds (ETFs) from the most prominent ETF families: SPDR, Xtrackers, Vanguard, Lyxor, VanEck and iShares by BlackRock.
These new instruments come with the following benefits:
Commodity CFDs:
Expiration: Never. Engage in long-term strategies and hold open positions for as long as you need. Commission: Zero. Enjoy lower costs of trading with only the spreads and daily financing costs to pay. Leverage: Moderate. A fixed ratio of 1:10 for Retail clients, and leverage up to 1:50 for Admiral Markets Pro clients on agricultural commodity CFDs and up to 1:100 on the Copper CFD. Advantages of trading in ETF CFDs:
Short Selling: Allowed. Access all the tools you need to profit even when market prices are falling. Commissions: Low. Take advantage of low transaction costs, with commission rates from 0.01USD per share, minimum fee of 1USD (US), 0.12%, minimium 5 EUR (EuroZone), 0.07%, minimum 8.0 GBP (UK).* Leverage: Variable. Depending on the liquidity of the underlying ETF, attributable leverage rate options start from 1:2 and are capped at 1:5 for Retail clients, and at 1:20 for Admiral Markets Pro clients.
Trading terms related to your these CFD instruments are available in the Commodities and ETF sections of the Contract Specifications on the Admiral Markets website.
*Commissions above are per one-sided transaction in ETF CFDs denominated in the national currency of the referred country.
About Admiral Markets
Admiral Markets is a leading online Forex and CFD trading provider. In addition to a wide range of financial instruments, Admiral Markets offers free educational materials, including analytics, webinars and seminars.
As we can see in the H4 chart, after being corrected by 76.0%, GBPUSD started a new pullback. The main upside target is the current high at 1.3298. If the price breaks the high, the pair may continue trading towards the post-correctional extension area between the retracements of 138.2% and 161.8% at 1.3440 and 1.3533 respectively. The support level is at 1.2922.
In the H1 chart, after reaching the retracement of 50.0%, the pair started a new correction. If the price breaks the high at 1.3258, it may continue trading upwards. However, in case the pair start a new descending correction, its targets will be the retracements of 61.8% and 76.0% at 1.3052 and 1.3003 respectively.
EURJPY, “Euro vs. Japanese Yen”
As we can see in the H4 chart, after the price reached the retracement of 50.0%, the convergence made EURJPY start a short-term correction, which has already reached the retracement of 23.6%. The next possible targets are the retracements of 38.2%, 50.0%, and 61.8% at 130.64, 131.1, and 131.59 respectively. However, if the pair breaks the low at 129.12, the mid-term downtrend may continue towards the retracements of 50.0% and 61.8% at 129.02 and 128.04 respectively.
The H1 chart shows more detailed structure of the current correction.
Attention! Forecasts presented in this section only reflect the author’s private opinion and should not be considered as guidance for trading. RoboForex LP bears no responsibility for trading results based on trading recommendations described in these analytical reviews.