On Friday, the USD has moved away from the monthly highs. The USD index (#DX) closed in the negative zone (-0.21%). The American currency was under pressure after the publication of the report on existing home sales, which counted to 5.15M instead of the expected 5.30M. Overall, the demand for USD is at a fairly high level
The CAD weakened against the USD after the publication of the weak economic stats. Therefore, the core consumer price index has lowered to 1.5% year-on-year. The core retail sales index fell in September to -0.4%, while experts expected a growth of 0.2%.
The investors’ attention is focused on the Brexit issue. Last week, Great Britain and the EU weren’t able to reach the agreement about the exit of the UK from the union. This weekend was marked by a mass protest in London, demanding a referendum regarding the final agreement on Brexit. There will be a meeting of the Bank of Canada and ECB this trading week. We also recommend you keep an eye on the reports by the FOMC representatives and the US GDP report for the 3 quarter.
The oil quotes are rising. Currently, futures for the WTI crude oil are testing a mark of $69.80 per barrel.
Market Indicators
On Friday, the major US indices were showing a variety of trends: #SPY (-0,05%), #DIA (+0,25%), #QQQ (-0,09%).
Currently, the 10-year US government bonds yield is at the level of 3.19-3.20%.
The news feed on 22.10.2018:
Today the publication of important news is not expected.
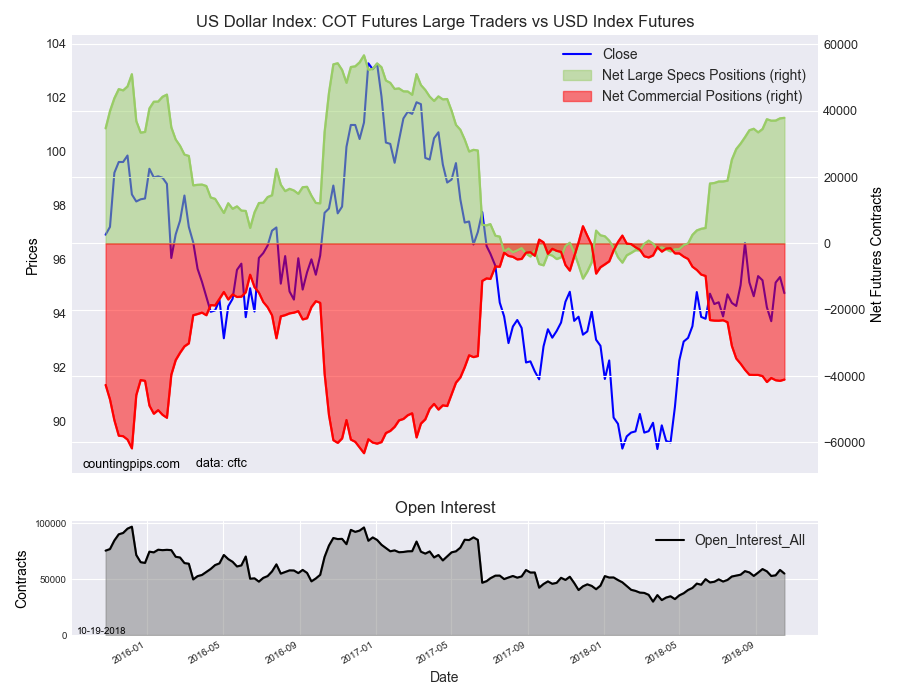
US Dollar Index speculator positions edged higher for 3rd week
The latest data for the weekly Commitment of Traders (COT) report, released by the Commodity Futures Trading Commission (CFTC) on Friday, showed that large traders and speculators continued to increase their bullish bets for the US Dollar Index while sharply betting against the European common currency again this week. See full article
The non-commercial contracts of WTI crude futures totaled a net position of 493,229 contracts, according to data from this week. This was a slide of -34,822 contracts from the previous weekly total. See full article
The large speculator contracts of gold futures totaled a net position of 17,667 contracts. This was a weekly advance of 55,842 contracts from the previous week. See full article
The large speculator contracts of 10-year treasury note futures totaled a net position of -615,970 contracts. This was a weekly increase of 6,452 contracts from the previous week. See full article
The large speculator contracts of S&P500 Mini futures totaled a net position of 226,792 contracts. This was a decrease of -29,027 contracts from the reported data of the previous week. See full article
The non-commercial contracts of silver futures totaled a net position of -14,827 contracts, according to data from this week. This was a weekly gain of 7,423 contracts from the previous totals. See full article
The large speculator contracts of copper futures totaled a net position of 8,918 contracts. This was a weekly boost of 671 contracts from the data of the previous week. See full article
The Commitment of Traders report data is published in raw form every Friday by the Commodity Futures Trading Commission (CFTC) and shows the futures positions of market participants as of the previous Tuesday (data is reported 3 days behind).
US Dollar Index speculator positions edged higher for 3rd week
The latest data for the weekly Commitment of Traders (COT) report, released by the Commodity Futures Trading Commission (CFTC) on Friday, showed that large traders and speculators continued to increase their bullish bets for the US Dollar Index while sharply betting against the European common currency again this week.
The non-commercial futures contracts of US Dollar Index futures, traded by large speculators and hedge funds, totaled a net position of 37,876 contracts in the data reported through Tuesday October 16th. This was a weekly boost of 167 contracts from the previous week which had a total of 37,709 net contracts.
The speculative sentiment has continued it bullishness for the Dollar Index as bullish bets have risen for three straight weeks and for twenty-four weeks out of the past twenty-six.
Aggregate US Dollar Position edges lower this week
US Dollar net speculator positions leveled at $27.64 billion this week
An aggregate measure of the US dollar position – the total of US dollar contracts against the combined contracts of the euro, British pound, Japanese yen, Australian dollar, Canadian dollar and the Swiss franc – slid to an overall US dollar position totaling $27.64 billion as of Tuesday October 16th, according to the latest data from the CFTC and dollar amount calculations by Reuters. This was a weekly decline of $-0.15 billion from the $27.79 billion total position that was registered the previous week, according to the Reuters calculation.
The aggregate dollar position fell for the first time in five weeks but remains above the +$27 billion threshold for a second straight week. The aggregate position has continued to be in a bullish position for eighteen consecutive weeks now dating back to June 19th.
Individual Currencies Data this week:
In the individual currency contracts data, we saw three substantial changes (+ or – 10,000 contracts) in the speculators category this week.
Euro bets dropped sharply this week by over -13,000 contracts and have now fallen for three straight weeks. The euro standing is at the most bearish level since March 7th of 2017 (-41,027 net contracts)
British pound positions jumped this week by over +10,000 contracts and rose for the third week out of the past four. The overall speculative standing remains highly bearish but the GBP position has improved or become less bearish by nearly 30,000 contracts since September 18th
Japanese yen positions rebounded by over +14,000 contracts this week following a dismal showing over the previous six weeks. The JPY position had fallen by a total of -69,160 over those previous six weeks. The current standing remains above -100,000 net contracts for a third week.
New Zealand “kiwi” dollar speculator bearish bets rose again this week (-1,592 weekly change in contracts) for a second straight week. The speculator positions are at a new record high bearish level (data going back to 1999) at above -35,000 net contracts.
Overall, the major currencies that improved this week were the US Dollar Index (167 weekly change in contracts), British pound sterling (10,154 contracts), Japanese yen (14,580 contracts), Canadian dollar (1,126 contracts) and the Australian dollar (1,793 contracts).
The currencies whose speculative bets declined this week were the euro (-13,202 weekly change in contracts), Swiss franc (-3,721 contracts), New Zealand dollar (-1,592 contracts) and the Mexican peso (-5,874 contracts).
See the table and individual currency charts below.
Table of Weekly Commercial Traders and Speculators Levels & Changes:
Currency
Net Commercials
Comms Weekly Chg
Net Speculators
Specs Weekly Chg
EuroFx
11,913
17,351
-29,344
-13,202
GBP
66,401
-9,684
-50,353
10,154
JPY
119,621
-18,581
-100,621
14,580
CHF
30,951
3,236
-16,524
-3,721
CAD
6,874
-1,329
-11,019
1,126
AUD
92,905
-964
-71,491
1,793
NZD
40,201
2,159
-35,412
-1,592
MXN
-72,928
5,881
68,575
-5,874
This latest COT data is through Tuesday and shows a quick view of how large speculators or non-commercials (for-profit traders) as well as the commercial traders (hedgers & traders for business purposes) were positioned in the futures markets. All currency positions are in direct relation to the US dollar where, for example, a bet for the euro is a bet that the euro will rise versus the dollar while a bet against the euro will be a bet that the dollar will gain versus the euro.
Weekly Charts: Large Trader Weekly Positions vs Price
EuroFX:
British Pound Sterling:
Japanese Yen:
Swiss Franc:
Canadian Dollar:
Australian Dollar:
New Zealand Dollar:
Mexican Peso:
*COT Report: The weekly commitment of traders report summarizes the total trader positions for open contracts in the futures trading markets. The CFTC categorizes trader positions according to commercial hedgers (traders who use futures contracts for hedging as part of the business), non-commercials (large traders who speculate to realize trading profits) and nonreportable traders (usually small traders/speculators). Find CFTC criteria here: (http://www.cftc.gov/MarketReports/CommitmentsofTraders/ExplanatoryNotes/index.htm).
The Commitment of Traders report is published every Friday by the Commodity Futures Trading Commission (CFTC) and shows futures positions data that was reported as of the previous Tuesday (3 days behind).
Each currency contract is a quote for that currency directly against the U.S. dollar, a net short amount of contracts means that more speculators are betting that currency to fall against the dollar and a net long position expect that currency to rise versus the dollar.
(The charts overlay the forex closing price of each Tuesday when COT trader positions are reported for each corresponding spot currency pair.) See more information and explanation on the weekly COT report from the CFTC website.
As of October 11 2018, Admiral Markets Pty Ltd. has introduced a negative balance policy to allow clients to trade and analyse the financial markets with confidence.
Being prone to volatility, investors who trade in the Forex and CFD (Contract for Difference) markets can be vulnerable to sudden price changes. When these movements occur in instruments being held in an open trade, this can have a significant impact on the value of those positions and could result in an investor’s account balance falling below zero.
Should this happen, Admiral Markets may exercise its discretion to relieve clients of their repayment obligations by returning the negative balance to zero. This will protect the financial position of eligible clients, and will prevent them from falling into debt due to unsuccessful trades.
This policy follows global trends in consumer protection. In Europe, recent regulatory changes made by the European Securities and Markets Authority (ESMA) require European CFD providers to limit Retail client losses with automated negative balance protection.
Cristian Moreno, CEO of Admiral Markets Pty Ltd.
The CEO of Admiral Markets Pty Ltd., Cristian Moreno, commented, “Although negative balance protection is not an Australian regulatory requirement, we are proud to be leading the way with this initiative. Our new negative balance policy will help give retail clients the peace of mind they need to trade confidently, and is just one of the ways we support our clients’ investment journey.”
Jens Chrzanowski, Co-CEO of Admiral Markets Group AS
Meanwhile, Co-CEO of Admiral Markets Group AS, Jens Chrzanowski, stated, “As a global company, Admiral Markets feels that the success of our clients is paramount. When our clients succeed, we succeed! Negative balance policies help ensure they have the best possible trading experience, and the entire Admiral Markets Group is proud to see the Australian subsidiary taking the initiative to voluntarily add this policy to their offering.”
Admiral Markets Pty Ltd.’s negative balance policy will be provided on a purely discretionary basis for balances ranging from zero to negative AUD100,000. Find all terms and details of the policy here.
About Admiral Markets
Admiral Markets is a leading online Forex and CFD trading provider. In addition to a wide range of financial instruments, Admiral Markets offers free educational materials, including analytics, webinars and seminars.
***
Risk disclosure: Trading in financial markets on margin carries a high level of risk and losses may exceed your initial deposit. Admiral Markets UK Ltd. recommends you seek advice from an independent financial advisor to ensure that you understand the risks involved with Forex, CFDs and margin trading (https://admiralmarkets.com/risk-disclosure).
The art world will help drive up prices of cryptocurrency Ethereum, taking it to $500 by the end of the year, affirms an influential tech expert and business analyst.
The comments from Ian Mcleod, from Thomas Crown Art, the world’s leading art-tech agency that he established with renowned art dealer, Stephen Howes, comes as the world’s second largest cryptocurrency failed to break the $208 and $210 resistance levels against the U.S. dollar.
Mr Mcleod observes: “Ethereum’s price has been in bear territory for a few weeks, with prices declining dramatically.
“But it can be expected there will be a trend reversal between now and the end of the year. Once back in bull territory, there will be a dramatic upswing with considerable gains.
“It would be reasonable to believe that Ethereum will hit $500 by the end of 2018 and go on an overall upward trajectory throughout 2019.”
He continues: “Much of the expected price rises will be fuelled by an increasing number of sectors including real estate, antiques and finance, using Ethereum and its superior blockchain technology.
“The art world is likely to be one of the biggest adopters as blockchain can authenticate artwork. It’s an ideal use-case for distributed ledger technology as it offers the ability to store a permanent, immutable record of artwork at the point of creation which can be used to authenticate registered works by any party.”
He goes on to add: “Not only is Ethereum a fundamentally strong digital asset, its blockchain provides workable, tangible solutions for many sectors, it solves problems, and enhances existing systems.”
Last month, Mr Mcleod told the media: “We can expect Bitcoin to lose 50 per cent of its cryptocurrency market share to Ethereum, its nearest rival, within five years.
“Ethereum is already light years ahead of Bitcoin in everything but price – and this gap will become increasingly apparent as more and more investors jump into crypto. ”
As we can see in the H4 chart, after testing the retracement of 50.0% for the second time, BTCUSD is still being corrected. The target of this ascending impulse may be the retracement of 61.8% at 6905.00. If the instrument breaks the current low at 6091.10, the price may trade to reach the post-correctional extension area between the retracements of 138.2% and 161.8% at 5822.00 and 5656.00 respectively.
In the H1 chart, the pair is being corrected downwards and has already reached the retracement of 61.8%. The next target may be the retracement of 76.0% at 6262.00. The resistance level is the high at 6801.00.
ETHUSD, “Ethereum vs. US Dollar”
As we can see in the H4 chart, after finishing the ascending impulse, ETHUSD started a new pullback to the downside. If the instrument breaks the low at 184.38, the price may continue falling towards the post-correctional extension area between the retracements of 138.2% and 161.8% at 171.00 and 162.80 respectively. The resistance level is at 219.56.
In the H1 chart, the pair is being corrected and heading towards the retracement of 76.0% at 192.80.
Attention! Forecasts presented in this section only reflect the author’s private opinion and should not be considered as guidance for trading. RoboForex LP bears no responsibility for trading results based on trading recommendations described in these analytical reviews.
EURUSD is forming the second part of the descending wave; it has rebounded from 1.1520 and right now is falling towards 1.1444. Today, the pair may test 1.1475 from below and then fall with the short-term target at 1.1444. After that, the instrument may be corrected to return to 1.1520 and then resume trading inside the downtrend to reach 1.1410.
GBPUSD, “Great Britain Pound vs US Dollar”
GBPUSD is forming another descending structure with the short-term target at 1.2992. Later, the market may test 1.3050 from below and then resume trading inside the downtrend to reach the first target at 1.2888.
USDCHF, “US Dollar vs Swiss Franc”
USDCHF is still moving upwards. Today, the pair may reach 0.9982. After that, the instrument may be corrected to return to 0.9910 and then resume trading inside the uptrend to reach 1.0060.
USDJPY, “US Dollar vs Japanese Yen”
USDJPY has broken 112.43 downwards; right now, it is still being corrected. Possibly, today the price may test 112.43 from below and then start another decline to reach 111.79, thus forming another consolidation range. If later the instrument breaks this range to the upside, the price may continue growing to reach 113.10; if to the downside – resume trading inside the downtrend with the target at 110.93.
AUDUSD, “Australian Dollar vs US Dollar”
AUDUSD is trading to expand the range downwards. Today, the pair may reach 0.7077. Later, the market may grow towards 0.7123 and then start another decline with the target at 0.7071.
USDRUB, “US Dollar vs Russian Ruble”
USDRUB is still consolidating below 65.58. Possibly, the pair may grow towards 65.95 and then form a new descending structure to reach 65.10. Later, the market may return to 65.58 to test it from below. If the instrument breaks this range to the downside, the price may resume falling with the short-term target at 64.11; if to the upside – trade upwards towards 67.04.
XAUUSD, “Gold vs US Dollar”
Gold is consolidating around 1226.32. If later the instrument breaks this range to the downside, the price may continue trading downwards to reach 1205.80; if to the upside – start another growth with the target at 1243.77.
BRENT
Brent is still forming the third descending structure towards 78.55. Later, the market may grow to return to 82.22 once again and then start another decline with the first target at 77.37.
Attention! Forecasts presented in this section only reflect the author’s private opinion and should not be considered as guidance for trading. RoboForex LP bears no responsibility for trading results based on trading recommendations described in these analytical reviews.
Yesterday, the bearish sentiment was observed on the EUR/USD currency pair. The US currency was supported by positive economic data. In October, Philadelphia Fed manufacturing index counted to 22.2 and was better than the expected value of 19.7. Fed officials plan to adhere to the current monetary policy tightening. At the moment, the key support and resistance levels are: 1.14300 and 1.14600, respectively. Trading instrument has the potential for further decline. We recommend opening positions from the key levels.
Important economic reports on 19.10.2018:
– Existing home sales in the US at 17:00 (GMT+3:00).
The price has fixed below 50 MA and 200 MA, which indicates the power of sellers.
The MACD histogram is in the negative zone, but above the signal line, which gives a weak signal to sell EUR/USD.
Stochastic Oscillator is in the neutral zone, the %K line is below the %D line, which indicates the bearish sentiment.
Trading recommendations
Support levels: 1.14300, 1.14000
Resistance levels: 1.14600, 1.15000, 1.15400
If the price fixes below the support level of 1.14300, a further fall in the EUR/USD quotes is expected. The movement is tending to 1.14000-1.13750.
An alternative may be the correction of the EUR/USD currency pair to the level of 1.14800-1.15000.
The GBP/USD currency pair
Technical indicators of the currency pair:
Prev Open: 1.31509
Open: 1.30171
% chg. over the last day: -0.74
Day’s range: 1.30122 – 1.30383
52 wk range: 1.2361 – 1.4345
There are aggressive sales on the GBP/USD currency pair. The British pound weakened significantly against the US dollar due to weak retail sales statistics. The key support and resistance levels are: 1.30000 and 1.30400, respectively. Positions should be opened from these marks. Trading instrument has the potential for further decline.
We recommend paying attention to the speech by the Bank of England governor.
The price has fixed below 50 MA and 200 MA, which indicates the power of sellers.
The MACD histogram is in the negative zone, but above the signal line, which gives a weak signal to sell GBP/USD.
Stochastic Oscillator is in the neutral zone, the %K line is crossing the %D line. There are no accurate signals.
Trading recommendations
Support levels: 1.30000, 1.29700
Resistance levels: 1.30400, 1.30800, 1.31200
If the price fixes below the round level of 1.30000, a further decrease in the GBP/USD quotes is expected. The movement is tending to 1.29700-1.29500.
An alternative may be the GBP/USD currency pair growth to the level of 1.30750-1.31000.
The USD/CAD currency pair
Technical indicators of the currency pair:
Prev Open: 1.29915
Open: 1.30833
% chg. over the last day: +0.47
Day’s range: 1.30536 – 1.30666
52 wk range: 1.2059 – 1.3795
The USD/CAD currency pair moved away from monthly highs. At the moment, the technical pattern is ambiguous. Local support and resistance levels are: 1.30400 and 1.30650, respectively. Positions should be opened from these marks. In the near future, correction of the USD/CAD quotes is not excluded after a prolonged growth.
The news feed on 19.10.2018:
– Reports on inflation and retail sales in Canada at 15:30 (GMT+3:00).
Indicators point to the power of buyers: the price is above 50 MA and 200 MA.
The MACD histogram is in the positive zone, but below the signal line, which gives a weak signal to buy USD/CAD.
Stochastic Oscillator is moving out of the oversold zone, the %K line is above the %D line, which indicates the bullish sentiment.
Trading recommendations
Support levels: 1.30400, 1.30100, 1.29800
Resistance levels: 1.30650, 1.30850, 1.31000
If the price fixes below the local support of 1.30400, it is necessary to look for entry points to the market to open short positions. The target movement level is 1.30100-1.29800.
Alternative option. If the price fixes above the resistance of 1.30650, the USD/CAD quotes growth is expected. The movement is tending to the round level of 1.31000.
The USD/JPY currency pair
Technical indicators of the currency pair:
Prev Open: 112.131
Open: 111.767
% chg. over the last day: -0.33
Day’s range: 112.089 – 112.129
52 wk range: 104.56 – 114.74
There is a variety of trends on the USD/JPY currency pair. Investors expect additional drivers. At the moment, local support and resistance levels are: 112.300 and 112.550, respectively. Positions should be opened from these marks. We recommend paying attention to the US government bonds yield.
Publication of important economic reports from Japan is not planned.
Indicators do not send accurate signals: 50 MA is crossing 200 MA.
The MACD histogram is near the 0 mark.
Stochastic Oscillator is in the neutral zone, the %K line is below the %D line, which indicates the bearish sentiment.
Trading recommendations
Support levels: 112.300, 112.000, 111.700
Resistance levels: 112.550, 112.850
If the price fixes above the resistance level of 112.550, the USD/JPY quotes growth is expected. The movement is tending to 113.000-113.250.
Alternative option. If the price fixes below 112.300, we recommend looking for entry points to the market to open short positions. The target movement level is 112.000-111.700.
Demand for the US currency is still high. Yesterday, the US dollar strengthened against a basket of major currencies. The dollar index (#DX) again updated the weekly high and closed in the positive zone (+0.44%). Positive economic reports and the prospects for the Fed interest rates raising support the US currency. In October, Philadelphia Fed manufacturing index counted to 22.2 and was better than the expected value of 19.7. Today, we expect important statistics from Canada and the United States.
The British pound weakened significantly against the US dollar due to weak economic statistics from the UK. The volume of retail sales in the UK fell by 0.8% in September. Experts expected a decline of 0.4%. Yesterday, the Brexit summit of EU leaders was held, during which no agreement was reached on the exit of the United Kingdom from the Union. However, British Prime Minister, Theresa May, is ready to consider the possibility of extending the transition period during which to adhere to the current EU rules.
Today, during the Asian trading session, weak data on the economy of China have been published. Thus, the GDP indicator (y/y) slowed down to 6.5%, while experts expected 6.6%. Industrial output increased by 5.8% in September, which is below market expectations at the level of 6.0%.
Oil quotes have become stable. At the moment, futures for the WTI crude oil are testing a mark of $68.80 per barrel.
Market Indicators
Major US stock indices show negative dynamics: #SPY (-1.44%), #DIA (-1.28%), #QQQ (-2.32%).
At the moment, the 10-year US government bonds yield is at the level of 3.17-3.18%.
Important economic reports on 19.10.2018:
– Reports on inflation and retail sales in Canada at 15:30 (GMT+3:00); – Existing home sales in the US at 17:00 (GMT+3:00).
We also recommend paying attention to the speech by the Bank of England governor Carney.
Why Is the Trump Administration Compounding Palestinian Distress?
By Dan Steinbock
In the quest to change Israel’s very nature, the Netanyahu government is pushing Palestinians to an edge – with the support of the Trump White House.
Recently, a report by the International Monetary Fund (IMF) warned that “deepening rifts between key stakeholders and surging violence in Gaza further imperil prospects for peace.” That should not come as a surprise anymore.
While economic and strategic polarization is steadily deepening between Israel and the Palestinians, the “peace initiatives” of the Trump White House are undermining half a century of American diplomacy and pushing the region closer to an abyss.
In the past, the Netanyahu government has vehemently opposed all parallels with South African apartheid. Unfortunately, new data suggests that under apartheid South African blacks had more to hope for than Palestinians today.
Unsettling parallels
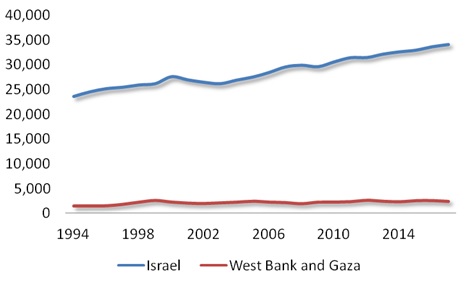
Between 1994 and 2017, Israeli GDP per capita, adjusted to purchasing power parity, increased by 150%; in West Bank and Gaza, the comparable figure was 160%. Yet, the Palestinian starting-point is so low that progress in living standards is largely fiction.
In 1994 – amid the peace talks in Oslo – Palestinian living standards were only 6.4% ($1,526) of the Israeli level ($23,693) (Figure a). At the time, the hope was that peace would bring increasing stability, which would foster prosperity and rapid catch-up growth – until the radical-right assassination of Prime Minister Yitzhak Rabin triggered still another cycle of violence.
Last year, Palestinian living standards were about 7.3% ($2,494) of the Israeli level ($34,135). After more than two decades of new wars and friction, terrorism and restrictions, the catch-up has amounted to less than a percentage point.
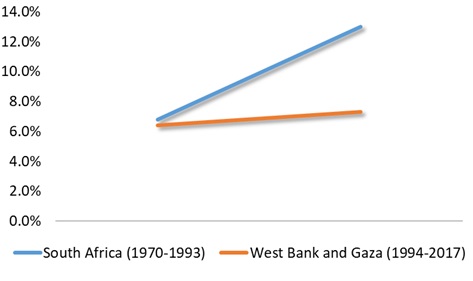
Let’s set aside political debates about the causes and only focus on economic facts; i.e., changes in income polarization. And let’s compare the last two decades of apartheid South Africa with the past two decades between Israel and Palestinians. In the mid-70s, black South Africans’ annual per capita income relative to white levels was about 8.6%; that is, two percent higher relative to the Palestinian level vis-a-vis the Israelis. By the time apartheid came to an end with the formation of a democratic government in 1994, black South Africans’ per capita income relative to the whites had climbed to some 13%. In contrast, the comparable Palestinian level was half of that figure last year (Figure b).
Figure Unsettling Comparisons
GDP Per Capita PPP: Israel Vs West Bank and Gaza (1994-2017)
Living Standards: Palestinians/Israelis and Black/White South Africans
Source: a. World Bank. b. Palestinians/Israelis: World Bank. Black and White South Africans: OECD.
Ironically, South African apartheid was more conducive to economic progress in its last two decades than life in the West Bank and Gaza in the past two decades.
Moreover, the Netanyahu government’s economic policies have also dramatically increased economic polarization in Israel. In the early 1990s, the Gini coefficient, a measure of inequality, was around 35 in Israel, at the level of Portugal and Italy. Closer to 43 today, it is among the highest in OECD countries, and at the level of Nigeria and Zimbabwe. But there may be still worse ahead.
Undermining Israeli Constitution
Protests in Gaza ahead of, and turbulence since Israel’s Independence Day and the relocation of the U.S. embassy to Jerusalem in May, mark the most serious escalation since the 2014 war. With his decision, President Trump departed from the decades-long U.S. executive branch practice not to recognize Israeli sovereignty over any part of Jerusalem.
Meanwhile, a steep decrease in Palestinian Authority and external funding to Gaza since 2017 has worsened already dangerous humanitarian conditions there. According to the World Bank, Gazans’ real per capita incomes have fallen by one-third since 1994, owing largely to the West Bank-Gaza split and to Israel’s and Egypt’s tight controls on goods and people transiting Gaza’s borders.
Instead of seeking to alleviate acute distress in the region, the White House has given de facto support to the new nation-state law, which defines Israel as a Jewish nation-state, despite a significant Arab minority. Unsurprisingly, the new law has been opposed by demonstrations and a high-profile petition by Israeli intellectuals – including Amos Oz, David Grossman, A. B. Yehoshua, Eshkol Nevo, Etgar Keret and Orly Castel-Bloom – who demand the Netanyahu government to abolish it: “The nation-state law, according to which the State of Israel is the national state of the Jews only, expressly permits racial and religious discrimination, nullifies Arabic as an official language alongside Hebrew, does not mention democracy as the foundation of the country and does not mention equality as a basic value.”
In this status quo, Trump’s indiscriminate support for the Netanyahu government effectively nullifies any remaining impression about the U.S. as a “neutral arbiter” in the peace process. What makes the moment even more dangerous is Netanyahu’s inclination to ignore the warnings of Israel’s highest defense authorities, the willingness of the Trump administration to embolden these fatal shifts, and the erosion of any remaining hope on the Palestinian side.
50 years of missed warnings
At the eve of the Yom Kippur War in 1973, when I toured the West Bank and Gaza, what was most striking was the apparent calm on the surface and the lingering tensions behind the official façade. It was this odd mixture of hollow expectations and raw realities that accounted for the nightmares that ensued.
After the Yom Kippur War, the Labor coalition began to expand the boundaries of Jerusalem eastward, which encouraged a group of Messianic settlers to create a foothold in the West Bank, including Ma’ale Adumim by the Gush Emunim which sparked a protest by the “Peace Now” movement. I was there, as was my good friend Amos Oz, the famous Israeli author and one of the leaders of the peace movement. The concern was that if the settlers were permitted to create a substantial de facto presence, it might be legitimized over time with de jure measures, which would undermine Israel’s foundations, polarize the relationship between Israel and the Palestinians, while fostering cycles of terror and conflicts.
Despite a relatively broad popular opposition against the settlements, successive Israeli governments failed to contain them, despite Egyptian President Sadat’s bold peace initiative. Once again, the writing on the wall was ignored and the ‘80s wars in Lebanon ensued, along with the first large-scale Palestinian uprising against Israel in the West Bank and Gaza at the turn of the ‘90s. That’s when the Madrid Conference in 1991 and the subsequent Oslo Accords offered a glimpse of an alternative future scenario – but one that perished after Rabin’s assassination.
Today, half a century has passed from the Six-Day War and the Israeli conquest of the West Bank and Gaza. According to the Peace Index by the Israel Democracy Institute, last July three out of every four Israelis (74%) viewed the chances of Trump’s peace plan being a success as low or very low. According to the most recent survey, 89% of Israeli Jews do not see peace in the horizon. Almost half of Israeli Jews believe the Palestinians should have a state of their own. More think the two-state solution would be impossible to implement. After a generation of increasing bitterness, the share of the skeptics is relatively higher in younger age groups.
The message is fairly clear. Most Israelis believe that President Trump’s initiatives are undermining peace in the region. Most support a two-state plan. But since Washington is not seen as a neutral arbiter, a lasting peace plan is not enforceable.
As the U.S. provides one-third of the annual budget of the UNRWA, the vital relief agency for Palestine refugees since 1948, and has refused to make further contributions, some 5.4 million Palestinian refugees in the West Bank and Gaza, and in Jordan, Lebanon and Syria find themselves in a new situation.
Reportedly, Israel supported only gradual reduction of the UNRWA’s funding and no reductions in Gaza until Netanyahu changed course without consulting his own security officials. Meanwhile, leading Israeli defense authorities have suggested that steep UNRWA cuts could further radicalize Gaza and destabilize the West Bank.
As the IMF data suggests, the status quo is entering an entirely new stage, in which economic agony could result in a failed state before an actual state is formed, while militarization of the crisis and the absence of hope on the Palestinian side could unleash even more desperate waves of terror internationally.
Half a century of policy mistakes should be an adequate warning.
About the Author:
Dan Steinbock is the founder of Difference Group and has served as research director of international business at the India, China and America Institute (US) and a visiting fellow at the Shanghai Institute for International Studies (China) and the EU Center (Singapore). For more, see http://www.differencegroup.net/
The original commentary was published by the prestigious Consortiumnews on October 16, 2018.