The USD strengthened against the basket of the major currencies. The USD index (#DX) updated the weekly maximums and closed in the positive zone (+0.35%). The demand for the USA currency remains high.
The EUR weakened due to the inconsistencies regarding the Italian budget. The local government still intends to approve the proposed 2019 budget project, which exceeds the limits determined by the EU. The European Commission considers these actions a rude violation of the EU financial demands.
The GBP fell against the USD. Steve Baker, a politician in Theresa May’s British Conservative Party, offered a correction in the agreement regarding the UK exit from the US, which in turn blocked the EU’s plan. The Democratic Union Party of Northern Island is ready to review this correction.
The oil quotes are consolidating. At the moment, the WTI futures are testing the 69 USD/barrel mark. A weekly report on the reserves of the crude oil from the American Petroleum Institute will be published at 23:30 (GMT+3:00).
Market Indicators
Yesterday, the major US stock indices were showing a variety of trends: #SPY (-0,45%), #DIA (-0,50%), #QQQ (+0,51%).
The 10-year US government bonds yield is lowering. At the moment, the indicator is at 3.15-3.16%.
The Economic News Feed for 23.10.2018 is calm. We recommend you to keep an eye on the statement by the governor of the Bank of England – Mark Carney – regarding the recent expense scandal.
On Monday, trading on the single currency closed down. As trading got underway in Europe, buyers attempted to gain a foothold above 1.1550 on the back of an increased appetite for risk. Demand for the euro rose against the backdrop of rising Chinese stocks and the EURJPY cross. After hitting a session high, the euro slumped to 1.1456 as fears over Brexit negotiations and the Italian budget gripped the market. Italian 10-year bond yields once again rose above the 3.5% mark.
Yesterday turned out exactly as I expected. We got a correction on the euro from 1.1550 to 1.1456. The drop came to an end at around the 67th degree. The bears tested this level at the opening of the European session. I see markets behaving in a similar way to yesterday, when the euro made a hew high before dropping. The fundamentals haven’t changed, but something tells me that the euro is going to rise from 1.1440 to around 1.1500-1.1508 (high probability of mirroring the growth from 1.1433 to 1.1550). If we see some sharp growth, I won’t rule out a rise to 1.1523.
Today, we have something less popular, but at the same time very technical. We’ve got a pleasant setup for technical traders that respect the lines and dots and do not care too much about fundamentals.
Our hope for this week is AUDCHF, and this is probably the first time that we are writing a piece about this instrument on this portal. The situation here is nice and clean, without any fireworks or unnecessary factors. The price is in a downtrend and most recently made a bullish correction. The upswing stopped at 38.2% Fibonacci, where the price created a double top formation. What is more, the second top of this pattern is made with a shooting star candle pattern. But wait a second! The sell signal is not here yet! There is one thing missing. For the legitimate trigger to open a short position, we need to wait for the breakout of the green horizontal support.
We will have wait. So, we will basically be doing what most professional traders do all day anyway.
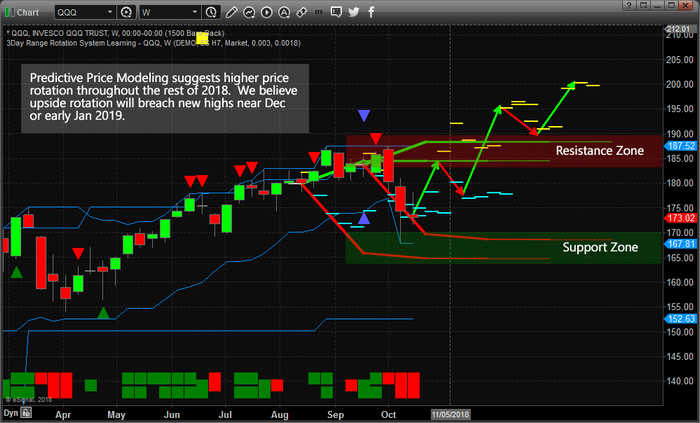
Our proprietary adaptive learning tools, specifically our adaptive predictive price modeling tool, is clearly illustrating higher price rotation over the next few weeks with a strong potential that the US equities markets will break to be all-time highs near Dec 2018 or early 2019.
Our research team has spent more than a decade studying the markets and developing specialized tools to assist us in understanding current and future price activities. This one tool, the Adaptive Dynamic Learning (ADL) Price Modeling system is one of the more dynamic tools we have ever created. We can ask it what it believes is the highest probability future outcome many weeks, months or years in advance. Today, we are sharing with you what we believe will be a strong upside price rotation to close out 2018 and lead into 2019.
This QQQ Weekly chart shows two data points of our ADL price modeling system. The reason we asked for these two points of analysis is that we attempt to identify aligning price analysis when using this tool. In other words, when the analysis aligns well in multiple instances, we believe the outcome to be more sustainable going forward. In this instance, data points originating from August 13 and September 17 clearly highlighted the downside rotation in early October and suggest we could see another 2 to 4 weeks of price rotation near the “Support Zone”. These ADL predictive levels also align well with our suggestion that a November 8 ~ 12 ultimate price bottom will set up. After that, we still believe the markets will enter a rally mode that could present a 10% to 12% upside move well above recent highs – breaking through the Resistance Zone quickly.
The one concern we have regarding this future price prediction is that out modeling systems are showing the Precious Metals are also setting up for a bigger move and that allows us to understand some of the dynamics that are at play in the markets. If the metals begin to move higher while the US Equities markets also move higher, it would indicate a moderately strong “capital shift towards safety and away from risk” is taking place. Thus, the US equities markets and Precious Metals would BOTH be moving higher at the same time. We believe this could be an event that puts additional pressures on the Emerging Markets, Oil, Foreign Currencies and other commodities while the US Dollar continues to maintain overall strength.
We’ll know more in early 2019. Right now, we can tell you that our modeling systems are suggesting “the bottom is in” and that we should be expecting upside price rotation throughout the rest of 2018.
Please take a minute to learn more about what we do and how we can assist you in finding and executing better trades. Visit TheTechnicalTraders.com to learn more about our team, our tools, and our services. Isn’t it time you invested in your future success?
The recent downside price rotation in the US Equities markets has been a blessing for skilled traders. The opportunities for profits are setting up all over the markets – you just have to look for them and understand price theory.
The Small Cap ETF, TNA, is setting up a nearly perfect example of a quick in and out trade for a potential profit of 8% to 15% or more. We understand the fear that many traders may have in the markets right now and we understand the reason why many experienced traders decide to sit on the sidelines while these types of moves play out. Yet, we believe the opportunities that exist while these volatile market moves are playing out are some of the best setups for experienced and skilled traders.
Typically, volatility may only be only 20% or 30% of the current volatility on average trading days. In other words, you might be waiting 3x to 4x (or more) longer for the same types of price swings to occur. If the opportunity presents itself and you have the skills and understanding to dissect the trade, why not take the opportunity for these great, quick moves?
Let’s take a look at the TNA setup
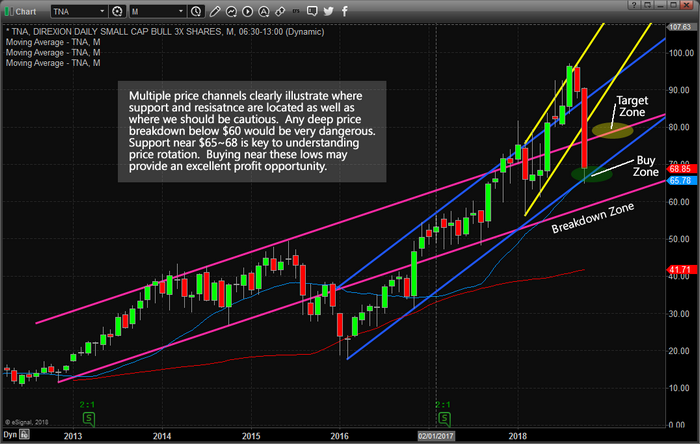
This Monthly TNA chart illustrates the Price Channels that our research team has suggested present the opportunities for this LONG trade setup. Our research team believes the primary BLUE price channel is acting as support for the current price near $65~70. As long as this lower price channel holds, then the potential for an upside price reversal towards $78~80 is rather strong. The MAGENTA target level is price resistance from 2013~2015 and would be an immediate price target for any relief rally from these lows. The Breakdown Zone is where we want to alert our followers to be cautious. If the price does not rally and falls below the Breakdown Zone, this trade is invalid.
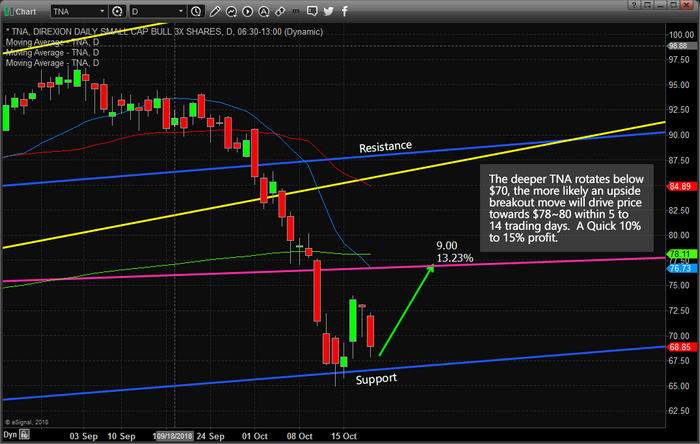
This TNA Daily chart more clearly illustrates the trade setup that is currently setting up. The relief rally on Tuesday, October 15, rallied to near $74 from lows near $65. This type of price rotation establishes a price range and shows us what is capable if the price were to enter a rally mode. Again, the MAGENTA level is our immediate price target for any new long trades near these lows. Our opinion is that any new long entries below $70 are sufficient for most skilled traders and, of course, waiting for deeper price entries could be very advantageous.
Don’t get greedy with this one just yet. We still believe the price will rotate lower after reaching near the target zone and form a major price bottom near November 8~12. Think of this as a scalping trade. Once you have entered your long position, any price level above $75 is sufficient to call this one a “solid winner”.
We continue to deliver superior results to our subscribers and members. We hope you are enjoying our free research articles and are able to gain insight and understanding of our work, research, passions for the markets and willingness to share our knowledge. If you find our work helps your trading, then take a minute to really see what we offer our subscribers by visiting www.TheTechnicalTraders.com. Consider trying our services for a three month period to see how we can help you stay ahead of these moves and find greater profits. If you want to read more about our detailed market research, please visit TheTechnicalTraders.com
As we can see in the H4 chart, after completing the ascending impulse, XAUUSD started a new sideways movement. In case the price breaks the resistance level at 1233.26, the instrument may continue the correction towards the retracement of 38.2% at 1238.30. The main support level is at 1183.22.
In the H1 chart, the pair is forming a short-term descending correction, which has already reached the retracement of 23.6. The next targets are the retracements of 38.2% and 50.0% at 1214.13 and 1208.50 respectively.
USDCHF, “US Dollar vs Swiss Franc”
As we can see in the H4 chart, the divergence made USDCHF start a new correction to the downside. The possible targets are the retracements of 23.6%, 38.2% and 50.0% at 0.9874, 0.9811, and 0.9760 respectively. However, if the price breaks the resistance level at 0.9977, the instrument may continue trading upwards to reach the high at 1.0068.
The H1 chart shows more detailed structure of the current descending correction.
Attention! Forecasts presented in this section only reflect the author’s private opinion and should not be considered as guidance for trading. RoboForex LP bears no responsibility for trading results based on trading recommendations described in these analytical reviews.
The commercial real estate (CRE) industry is comprised of many different types of service providers, including property management, brokerage firms, banks, and other types of lenders. When a CRE transaction takes place, there are various operators involved, requiring extensive sharing of official property documents, and financial information which need to be validated. The requirements for validating all information across all parties slows down the speed of each transaction, which can take weeks and months to complete. Many CRE firms have turned to blockchain to speed up execution times, decrease error and increase transparency in each transaction.
What Is Blockchain?
Blockchain technology is a way to store and transfer information in an encrypted manner by distributing data instead of copying it in a central location. Blockchain does so through a cloud, peer-to-peer network that eliminates the need for a third party, which ultimately reduces transaction fees. A digital ledger is then created and updated with each financial transaction in blocks.
There are plenty of benefits to making transactions and transferring data using blockchain as the technology is not controlled by one central entity, such as a central bank. This means that breaching these blocks is extremely difficult, maintaining the sanctity and transparency of its transactions and data.
Blockchain is the backbone of cryptocurrencies such as Bitcoin, which offer speedy and low-cost ways of sending and receiving money.
Faster Transactions
One of the most exciting ways blockchain is disrupting the CRE world is in the form of smart contracts. The industry currently relies on an inefficient system of old-school verification of property ownership by conducting research to ensure the property belongs to the party who is selling it.
Blockchain can reduce the speed in which the chain of custody regarding CRE properties takes place as a property’s title would be stored on a public ledger. This would remove the need for another central repository, thus reducing transaction, state, city and legal costs. The same principle would apply for leases that would be recorded via blockchain.
More Transparent Deals
Blockchain can also ensure that real estates assets are more liquid and the terms of the agreement are fully understood by both sides as every piece of data regarding a property would be stored publicly. This includes data surrounding former owners, construction done on the property, past maintenance costs and records regarding former inspections.
Having all this information available would give the investor a more comprehensive idea of the property they are investing in. Blockchain essentially ensures that everyone is on the same page and both sides are fully aware of what they’re getting into as every piece of information is out there for anyone to access.
Digital Paper Trail
Another challenge with the CRE industry is the fact that public records can be outdated, unreliable or not available. Following a property’s paper trail can be time-consuming and frustrating as a lot of this information is lost due to poor organizational skills from industry workers and legacy systems that lose data when updated.
With blockchain, every piece of information on a property would be available in the same place rather than in multiple physical and digital domains. Blockchain would also help to eliminate the type of fraud that sometimes exist in the industry as deeds and titles can be counterfeited easily.
Buying Property With Cryptocurrencies
As previously mentioned, Bitcoin is a cryptocurrency that relies on blockchain to complete financial transactions online in a matter of seconds. Some investors and real estate firms have started adding Bitcoin to the industry, including Ivan Pacheco, who bought a two-bedroom condominium in Florida for $275,000 in Bitcoin.
In the residential space, you can buy a condo on the Lower East Side of Manhattan with Bitcoin. Meanwhile, some apartments in New York City are allowing their tenants to pay for rent using Bitcoin. Cryptocurrencies have been historically volatile and they’ve been on the decline since peaking in December 2017, but some investors believe that the future of real estate will be closely tied with Bitcoin and other digital coins.
Nevertheless, blockchain’s role in the CRE industry is becoming more prevalent each day. The technology’s potential to speed up transactions with smart contracts, its ability to add transparency to a deed or title and the fact that it dramatically decreases the chance for fraud suggest that more investors will flocks towards firms that use blockchain for CRE transactions.
EURUSD has completed the descending wave along with the correction. Today, the pair may expand the current range towards 1.1540 and 1.1447, and then return to 1.1505. If later the instrument breaks this range to the downside, the price may resume trading inside the downtrend to reach 1.1350; if to the upside – choose and alternative scenario and continue the correction towards 1.1616.
GBPUSD, “Great Britain Pound vs US Dollar”
GBPUSD has reached the short-term downside target and right now is being corrected. Possibly, today the price may form the fifth correctional structure towards 1.3112. Later, the market may start another decline to reach the first target at 1.2991.
USDCHF, “US Dollar vs Swiss Franc”
USDCHF is still moving upwards. Today, the pair may reach 0.9992. After that, the instrument may be corrected to return to 0.9950 and then resume trading inside the uptrend to reach 1.0040.
USDJPY, “US Dollar vs Japanese Yen”
USDJPY has formed another consolidation range around 112.49. If the instrument breaks this range to the upside, the price may continue the correction with the short-term target at 113.00. Later, the market may fall towards 112.25 and then resume trading upwards to return to 113.10.
AUDUSD, “Australian Dollar vs US Dollar”
AUDUSD is forming the Flag correctional pattern. Today, the pair may fall to reach 0.7080. Later, the market may grow towards the target of the pattern at 0.7160 and then resume trading inside the downtrend to reach 0.7000.
USDRUB, “US Dollar vs Russian Ruble”
USDRUB is still consolidating below 65.55. Possibly, the pair may fall towards 65.18 and then test 65.55 from below. If the instrument breaks this range to the downside, the price may resume falling with the short-term target at 64.10; if to the upside – start a new correction towards 67.04.
XAUUSD, “Gold vs US Dollar”
Gold is consolidating. According to the main scenario, the price may break this range to the downside and continue forming the fourth structure to reach 1200.50. However, if this range is broken to the upside, the instrument may choose and alternative scenario and grow with the target at 1250.50.
BRENT
Brent has reached the short-term downside target; right now, it is growing towards 81.52. After that, the instrument may start another decline with the first target at 77.37.
Attention! Forecasts presented in this section only reflect the author’s private opinion and should not be considered as guidance for trading. RoboForex LP bears no responsibility for trading results based on trading recommendations described in these analytical reviews.
On Friday, the EUR/USD currency pair was showing a bullish sentiment. The USD is under pressure due to the report on existing home sales, which counted to 5.15M in September instead of the expected 5.30. Currently, the key support and resistance levels are 1.15100 and 1.15500 respectively. You should open positions from these levels. The investors are waiting for the ECB meeting on Thursday, October 25.
The economic news feed for the EU and US is calm today.
Indicators do not provide accurate signals: the price is over 200 МА.
The MACD histogram is in the positive zone, higher than the signal line, which gives a weak signal towards a purchase of the EUR/USD.
The Stochastic Oscillator is in the overbought zone, the %K line is higher than the %D line, which gives a weak signal towards a purchase of the EUR/USD.
Trading recommendations
Support levels: 1.15100, 1.14700, 1.4400
Resistance levels: 1.15550, 1.15900, 1.16200
If the price fixes above the support level of 1.15100, EUR/USD is expected to decline. The movement is tending to 1.14700-1.4400.
Alternatively, the EUR/USD currency pair can grow towards 1.15900-1.16200.
The GBP/USD currency pair
Technical indicators of the currency pair:
Prev Open: 1.30171
Open: 1.30660
% chg. over the last day: -0.74
Day’s range: 11.30749 – 1.30860
52 wk range: 1.2361 – 1.4345
The GBP/USD started to recover. At the moment, the key support and resistance levels are 1.30500 and 1.31000 respectively. Positions should be opened from these levels. The investor’s attention is focused on the Brexit issue. A technical correction is not excluded in the near future.
The news feed on the UK economy is calm.
The price fixes between 50 MA and 200 MA, which represent dynamic levels of support and resistance.
The MACD histogram is in the positive zone, higher than the signal line, which gives a strong signal towards a purchase of GBP/USD.
The Stochastic Oscillator is in the neutral zone, the %K line is over the %D line. There are no precise signals.
Trading recommendations
Support levels: 1.30500, 1.30200
Resistance levels: 1.31000, 1.31400, 1.31800
If the price fixes above the support level of 1.30500, the GBP/USD quotes are expected to decline. The movement is tending to 1.30200-1.30000.
Alternatively, the currency pair may grow towards 1.31400-1.31600.
The USD/CAD currency pair
Technical indicators of the currency pair:
Prev Open: 1.30833
Open: 1.30894
% chg. over the last day: +0.10
Day’s range: 1.30828 – 1.30845
52 wk range: 1.2059 – 1.3795
On Friday, the USD/CAD currency pair was showing an aggressive buyout. The Canadian dollar is weakened against the USD after a publication of the weak economic stats. For example, the core consumer price index lowered to 1.5% year-to-year in September. The core retail sales index lowered in September to -0.4%, while the experts predicted the growth up to 0.2%. At the moment, the technical data is highly ambiguous. The local support and resistance levels are 1.30700 and 1.31100 respectively. Positions should be opened from these levels.
The economic news feed for Canada is calm today.
The price is above the 50 МА and 200 МА, which indicates the buyers’ power.
The MACD histogram is in the positive zone, but below the signal line, which gives a weak signal towards a purchase of USD/CAD.
The Stochastic Oscillator is near the oversold zone, the %K line has crossed the %D line. There are no precise signals.
Trading recommendations
Support levels: 1.30700, 1.30300, 1.30000
Resistance levels: 1.31100, 1.31400
If the price fixes below the local support level of 1.30700, it is necessary to look for entry points to the market to open short positions. The movement is tending to 1.30300-1.30000.
Alternatively, if the price fixes above the support level of 1.31100, further growth of the USD/CAD quotes is expected. The movement will tend to 1.31400-1.31600.
The USD/JPY currency pair
Technical indicators of the currency pair:
Prev Open: 111.767
Open: 112.562
% chg. over the last day: +0.32
Day’s range: 112.690 – 112.760
52 wk range: 104.56 – 114.74
The USD/JPY currency pair is showing a variety of trends. The investors are waiting for the additional drivers. At the moment, the local support and resistance levels are 112.500 and 112.800 respectively. Positions should be opened from these levels. We recommend you keep an eye on the US government bonds yield.
The economic news feed for Japan is calm.
The indicators are showing the buyers’ power: the price fixed above the 50 MA and 200 MA.
The MACD histogram is in the positive zone and higher than the signal line, which gives a strong signal towards the purchase of USD/JPY.
The Stochastic Oscillator is in the overbought zone, the %K line is over the %D line. There are no price signals.
Trading recommendations
Support levels: 112.500, 112.300, 112.000
Resistance levels: 112.800, 113.250
If the price fixes above the support level of 112.800, further growth of the USD/JPY quotes is expected. The movement is tending to 113.200-113.400.
Alternatively, if the price fixes below 112.500, we recommend looking for entry points to the market to open short positions. The movement is tending to 112.200-112.000.
Last week, nearly all the majors lost ground against the US dollar. Only commodity currencies made gains; namely the Aussie and Kiwi dollars. The biggest loser against the greenback was the pound (-0.64%). The loonie shed 0.62%, the Swiss franc 0.48%, the euro 0.39%, and the yen lost 0.27%. The Kiwi dollar gained 1.30%, while the Aussie rose by 0.12%.
In the US session, the euro recovered to 1.1535. The single currency was given a boost by comments from European Commissioner Pierre Moscovici, who showed a willingness to hold a constructive dialogue with Italy regarding concerns over their draft budget.
The pound rose on reports that British Prime Minister Theresa May has shown a willingness to compromise on the Irish border issue, which is a key sticking point to reaching an exit deal.
Day’s news (GMT+3):
13:00 Germany: German Buba monthly report.
15:30 Canada: wholesale sales (Aug).
15:30 US: Chicago Fed national activity index (Sep).
Fig 1. EURUSD hourly chart.
Current situation:
The single currency showed mixed dynamics in today’s Asian session. The euro then jumped to 1.1537 as trading got underway in Europe. Buyers have shifted Friday’s high to form a bearish divergence. To see this divergence play out, we need to see the bar on the AO indicator change colour.
Our pair is taking a breather at the resistance. Considering that this divergence is forming on both the AO and CCI indicators, while the economic calendar is virtually empty, I’m expecting to see a downwards correction on the EURUSD pair today. It’s worth keeping an eye on European bonds, especially Italian ones. The higher the bond yields, the higher the risk of bankruptcy among those banks holding Italian debt.
In my forecast, I expect a correction from the 90th degree to the LB balance line. The technicals allow for a rise as far as 1.1587 given that the 90th degree is not a reversal level; however, I don’t see the pair rising any further than 1.1550 today. I’ll be interested to see some downwards movement against Friday’s rally.