As we can see in the H4 chart, XAUUSD is still testing the resistance level and forming Hanging Man and Shooting Star reversal patterns. Judging by the previous movements, it may be assumed that the price may complete the pullback and then continue its ascending movement.
NZDUSD, “New Zealand vs. US Dollar”
As we can see in the H4 chart, NZDUSD is forming another correction with Harami, Inverted Hammer, and Hammer reversal patterns. Judging by the previous movements, it may be assumed that the instrument may complete the correction, break the resistance level, and then continue its growth.
Attention! Forecasts presented in this section only reflect the author’s private opinion and should not be considered as guidance for trading. RoboForex LP bears no responsibility for trading results based on trading recommendations described in these analytical reviews.
EURUSD is moving downwards to reach 1.1400. After that, the instrument may start a new correction to return to 1.1475 and then resume trading inside the downtrend with the short-term target of the third wave at 1.1330.
GBPUSD, “Great Britain Pound vs US Dollar”
GBPUSD is still forming the third descending wave with the short-term target at 1.2900. Later, the market may start a new growth to reach 1.3000 and then resume falling towards 1.2880.
USDCHF, “US Dollar vs Swiss Franc”
USDCHF is still consolidating around 0.9955. Today, the pair may grow to break the upside border at 0.9992 and then continue trading inside the uptrend towards the target at 1.0015. However, if the range is broken to the downside, the instrument may choose and alternative scenario and start a new correction to reach 0.9915 and then resume trading inside upwards to reach the above-mentioned target.
USDJPY, “US Dollar vs Japanese Yen”
USDJPY has almost completed the consolidation range around 112.40. Possibly, today the price may grow to reach 113.10 to finish the correction. After that, the instrument may resume trading inside the downtrend with the target at 110.70.
AUDUSD, “Australian Dollar vs US Dollar”
AUDUSD has formed another consolidation range around 0.7070 and broken it upwards. Possibly, the pair may extend this ascending structure towards 0.7160. Today, the pair may form the first impulse to reach 0.7107 and then start a new correction towards 0.7080. Later, the market may continue growing with the target at 0.7144.
USDRUB, “US Dollar vs Russian Ruble”
USDRUB is still consolidating around 65.55. If the instrument breaks this range to the downside, the price may continue the third wave towards 64.20; if to the upside – start a new correction with the target at 66.50.
XAUUSD, “Gold vs US Dollar”
Gold is no longer consolidating and may continue growing to extend the third wave towards 1265.80. Possibly, today the price may reach 1241.57 and then start a new correction with the target at 1230.20. After that, the instrument may resume trading inside the uptrend towards 1252.20.
BRENT
Brent has completed the descending wave. Today, the pair may start a new correction with the first target at 78.41.
Attention! Forecasts presented in this section only reflect the author’s private opinion and should not be considered as guidance for trading. RoboForex LP bears no responsibility for trading results based on trading recommendations described in these analytical reviews.
The technical pattern on the EUR/USD currency pair is ambiguous. Quotes are moving in a flat. Investors took a wait-and-see attitude before the ECB meeting, which will be held on October 25. At the moment, local support and resistance levels are: 1.14400 and 1.14800, respectively. We recommend opening positions from these marks.
Economic calendar on 24.10.2018:
– The index of economic activity in the manufacturing sector (PMI) of Germany at 10:30 (GMT+3:00);
– New home sales in the US at 17:00 (GMT+3:00);
– Fed’s “Beige Book” at 21:00 (GMT+3:00).
The price has fixed below 50 MA and 200 MA, which indicates the power of sellers.
The MACD histogram has moved to the negative zone, which indicates the bearish sentiment.
Stochastic Oscillator is in the neutral zone, the %K line is below the %D line, which also gives a signal to sell EUR/USD.
Trading recommendations
Support levels: 1.14400, 1.14000
Resistance levels: 1.14800, 1.15100, 1.15500
If the price fixes above the resistance level of 1.14800, the EUR/USD quotes are expected to grow. The movement is tending to 1.15100-1.15500.
An alternative may be the decrease of the EUR/USD currency pair to the round level of 1.14000.
The GBP/USD currency pair
Technical indicators of the currency pair:
Prev Open: 1.29567
Open: 1.29821
% chg. over the last day: +0.14
Day’s range: 1.29448 – 1.29839
52 wk range: 1.2662 – 1.4378
The GBP/USD currency pair is in a sideways trend. Investors expect additional drivers. At the moment, the local support and resistance levels are: 1.29350 and 1.29850, respectively. Positions should be opened from these marks. We recommend following current information regarding the Brexit process.
The news feed on the UK economy is calm.
Indicators point to the power of sellers: the price is being traded below 50 MA and 200 MA.
The MACD histogram has moved to the negative zone, which gives a signal to sell GBP/USD.
Stochastic Oscillator is in the neutral zone, the %K line is below the %D line, which indicates the bearish sentiment.
Trading recommendations
Support levels: 1.29350, 1.29000
Resistance levels: 1.29850, 1.30200, 1.30600
If the price fixes below the support level of 1.29350, the GBP/USD quotes are expected to decline. The movement is tending to 1.29000-1.28800.
An alternative may be the GBP/USD currency pair growth to 1.30200-1.30400.
The USD/CAD currency pair
Technical indicators of the currency pair:
Prev Open: 1.30963
Open: 1.30864
% chg. over the last day: -0.14
Day’s range: 1.30783 – 1.30889
52 wk range: 1.2248 – 1.3387
The technical pattern emerged on the USD/CAD currency pair is ambiguous. Quotes are in a sideways trend. Financial markets participants expect the Bank of Canada interest rate decision. At the moment, the local support and resistance levels are: 1.30700 and 1.31000, respectively. Positions should be opened from these marks.
The news feed on 24.10.2018:
– Bank of Canada interest rate decision at 17:00 (GMT+3:00).
Indicators do not send accurate signals: the price is being traded between 50 MA and 200 MA.
The MACD histogram is in the negative zone, but above the signal line, which gives a weak signal to sell USD/CAD.
Stochastic Oscillator is in the neutral zone, the %K line is above the %D line, which indicates the bullish sentiment.
Trading recommendations
Support levels: 1.30700, 1.30300, 1.30000
Resistance levels: 1.31000, 1.31400
If the price fixes above the round level of 1.31000, the USD/CAD quotes growth is expected. The movement is tending to 1.31400-1.31600.
Alternative option. If the price fixes below the support of 1.30700, it is necessary to look for entry points to the market to open short positions. The target movement level is 1.30300-1.30000.
The USD/JPY currency pair
Technical indicators of the currency pair:
Prev Open: 112.804
Open: 112.604
% chg. over the last day: -0.34
Day’s range: 112.424 – 112.553
52 wk range: 104.56 – 114.74
Yesterday, a variety of trends was observed on the USD/JPY currency pair. At the moment, local support and resistance levels are: 112.400 and 112.650, respectively. Investors expect additional drivers. Positions should be opened from the key levels. We recommend paying attention to the 10-year US government bonds yield.
The news feed on the economy of Japan is calm.
Indicators do not send accurate signals: the USD/JPY quotes have fixed between 50 MA and 200 MA.
The MACD histogram is near the 0 mark.
Stochastic Oscillator is in the neutral zone, the %K line is below the %D line, which indicates a decrease in quotes.
Trading recommendations
Support levels: 112.400, 112.150, 112.000
Resistance levels: 112.900, 113.200
If the price fixes above the resistance level of 112.900, the USD/JPY quotes growth is expected. The movement is tending to 113.200-113.400.
Alternative option. If the price fixes below the support of 112.400, we recommend looking for entry points to the market to open short positions. The target movement level is 112.150-112.000.
On Tuesday the 23rd of October, trading on the euro closed slightly up. Despite the bulls’ efforts to recover their losses, they were held back by the uncertainty surrounding Italy and the UK.
The European Commission has officially requested the Italian government to revise its 2019 budget in accordance with the EU’s fiscal requirements.
Italian Prime Minister Giuseppe Conte has said that the government has no plans to change its budget. Italian 10-year bond yields jumped to 3.60%, rising further to 3.62% in today’s Asian session.
On Tuesday, the pair made it to the 45th degree, but to the one that was at 1.1508 before the pair reached new lows. The situation in Italy won’t allow the euro to make any significant gains against the greenback.
The technical pictures contradict each other on different timeframes. To me, this means that we can expect the EURUSD pair to fluctuate today. Based on the hourly and 4-hour timeframes, I’m going to risk predicting a return to the 45th degree at 1.1495. I’m not ruling out a test of the 1.1440 mark. This will depend on how the situations in Italy and the UK develop. If we get any negative news, expect 1.1440 to be tested. As long as the Italian budget remains unresolved, it’s very risky to open long positions on the euro with the current price formations.
The US dollar has not changed a lot against a basket of major currencies. The US dollar index (#DX) fell slightly and closed in the negative zone (-0.06%). In general, demand for the US currency is still high. Investors took a wait-and-see attitude before the publication of important statistics from the United States and the Central Bank meetings.
Donald Trump again criticized the Fed Chairman Jerome Powell for interest rates raising. The US President believes that high interest rates significantly harm its economic policy. Not for the first time, Trump has criticized the Fed.
The European Commission rejected the budget project of Italy for 2019 and demanded to submit a new modified project as soon as possible. Let us recall that the Italian government recently submitted a project for the next year, according to which the budget deficit counted to 2.4% of GDP, which significantly exceeds the limits set by the EU (0.8% of GDP).
The “black gold” prices are recovering after a sharp fall the day before. At the moment, futures for the WTI crude oil are testing a mark of $66.35 per barrel. At 17:30 (GMT+3:00), a report on the US crude oil inventories will be published.
Market Indicators
Yesterday, the bearish sentiment prevailed on the US stock market: #SPY (-0.51%), #DIA (-0.54%), #QQQ (-0.37%).
The 10-year US government bonds yield has been declining. At the moment, the indicator is at the level of 3.15-3.16%.
The news feed 24.10.2018:
– The index of economic activity in the manufacturing sector (PMI) of Germany at 10:30 (GMT+3:00); – New home sales in the US at 17:00 (GMT+3:00); – Bank of Canada interest rate decision at 17:00 (GMT+3:00); – Fed’s “Beige Book” at 21:00 (GMT+3:00).
We have been following the news cycles for many months regarding the prognosticators that believe “the sky is falling” in the global markets and we find it interesting to see how quickly the bulls turn to bears when the market rotates 4~5% or more. The reality is that in traditional market price rotation, a 3~5% market price rotation is a very healthy component of price advance or price declines.
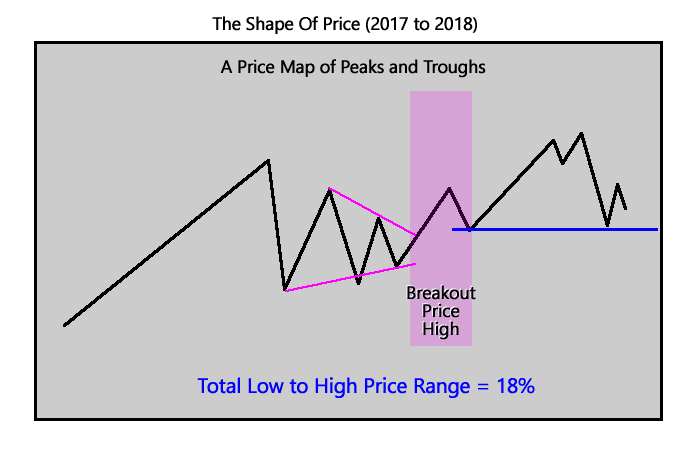
When we consider the price swings within the SPY from early 2017 till now, we are looking at a total of at least 18% total Low to High price swings with a number of large 6~8% price rotations and many 2~4% smaller price rotations. The natural rotation of price, as Fibonacci price theory teaches, is that price will always attempt to establish a new higher high or lower low in the process of extended trends. This means that price is always attempting to find and establish some new price high or low by rotating/trending within existing/past high or low price levels.
This is fairly obvious to see in the chart, above, where the initial downside price rotation in February 2018 established the deeper price low. This low price level was still higher than the previous price low on the left edge of this chart. As you can see, after the February 2018 price low, price continued to rotate in an attempt to establish a new “price high” or “price low” beyond the existing highest and lowest price levels. It failed many time to accomplish this new price high or low and, in doing so, continued to rotate within a narrower price range. Until…
May 2018 price pushed above the most recent price high channels and established a NEW Breakout Price High. This established the price trend as Bullish again and began a normal type of price rotation higher. In the process, it established a number of price lows that we can use as reference points for prior support and for our analysis of Fibonacci Price Theory as it relates to this current price move lower.
Getting to the current price charts and trying to make sense of the Fibonacci Price Theory example, above, is something we all need to pay attention to. Understanding price theory is only one component of the overall analysis process. There are many aspects to technical analysis and one of the most important is to understand how price operate within a global environment – the global economy. Price becomes a variant of many aspects of the global economic environment and is continually related to various external factors of the global economy and the perceptions of traders/investors. Putting it in simple terms, price becomes a factor of “whatever price investors are willing to pay for the safety and security of any type of various investment instruments OR whatever price investors are willing to sell at for the safety and security of exiting any type of various investment instruments”.
Keeping all of this in mind, remember that the US Equity market is, in our opinion, the leading capital market and investment destination on the planet right now. There is no other source as big, as varied, as capable and as liquid as the US Equities and Capital markets.
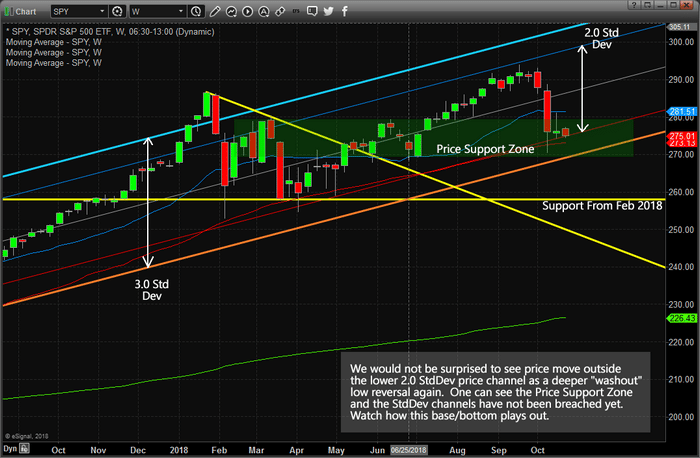
This Weekly SPY chart highlights a few key elements of the current price swings and one key element which is the Standard Deviation channels. Within this chart, we’ve drawn two Standard Deviation Channels that originate on November 8, 2016, and continue through today – a 2.0 StdDev channel and a 3.0 StdDev channel. The purpose of showing you these channel ranges and levels is to more clearly illustrate the type and level of current price rotation that we are seeing in the US Markets. The current price rotation originated near the top of the 2.0 StdDev channel and rotated to near the low of the 2.0 StdDev channel. In relative terms, this is nothing more than a common price rotation that has yet to extend beyond normal rotational channels.
Support from the February 2018 price rotation and what we call the “Price Support Zone” are still intact and active as core elements of current price support. In other words, the price would have to fall below $259.00 before we would be concerned with any massive Fibonacci Price Theory price reversal.
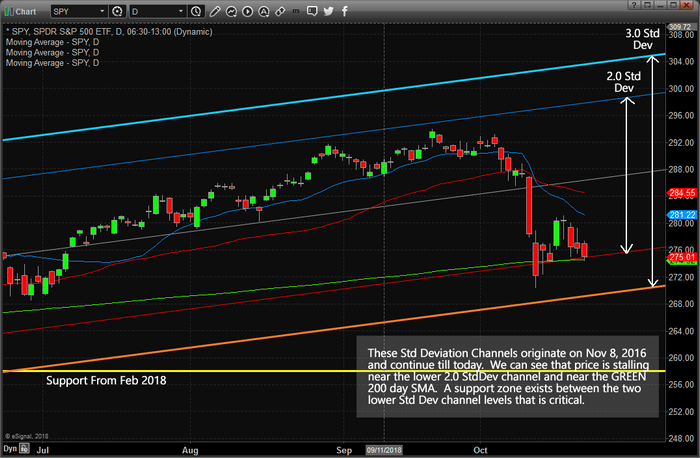
This SPY Daily chart shows the same Standard Deviation channels and the Support from Feb 2018 as key elements of this chart. The importance of this chart is to understand that the current lows, near $270 (or the lower 3.0 StdDev channel) are the low price level that acts as massive support for this potential bottom. Should price break below this level, then the $259 level becomes our next target and we could assume price has entered a short-term bearish mode.
Right now, we believe the bearish price trend will end near this support level and will soon begin an upward price move very similar to what happened after the February 2018 lows were established. Volatility is high right now and the price will rotate to establish new high and low price levels just like we saw on the first chart of this article. Eventually, price will consolidate and break to one side or the other. Our modeling systems suggest the breakout move will be to the upside again.
Playing this move with skill and understanding of price theory and dynamics can allow you to identify and execute incredibly profitable trades throughout this price rotation. Don’t be fooled by the news cycle content. Expect price to rotate within a 3~4% range for the next few weeks while volatility decreases and price range decreases. Near November 8 ~ 12, we expect an ultimate price bottom that will likely be the start of a new Bullish price trend and result in a new Breakout move to the upside. Nothing, so far, is unusual in terms of price rotation. Be smart and take advantage of these price setups while you can.
If you want to learn about what we do and how we help our members find greater success, please visit TheTechnicalTraders.com to learn more. We pride ourselves on being ahead of these market moves and helping our members find and execute trades for greater success. We called this downside market move over 3 weeks before it happened and you can read how we did it by visiting TheTechnicalTraders.com/FreeResearch/. Please take a minute to see if our services and tools can help you create greater success in 2019 and beyond.
In the H4 chart, EURUSD is testing the support level at 1.1432. If the price breaks it, the instrument may continue falling towards the post-correctional extension area between the retracements of 138.2% and 161.8% at 1.1360 and 1.1316 respectively. The resistance level is the high at 1.1621.
As we can see in the H1 chart, EURUSD is finishing the short-term correction and about to start a new impulse to the downside. In the nearest future, the price may continue falling towards the post-correctional extension area between the retracements of 138.2% and 161.8% at 1.1388 and 1.1360 respectively.
USDJPY, “US Dollar vs. Japanese Yen”
As we can see in the H4 chart, USDJPY is completing the short-term correction, which may be followed by a new descending impulse. The next downside targets may be the retracements of 38.2% and 50.0% at 110.77 and 109.58 respectively. The main resistance level is the high at 114.55.
In the H1 chart, the convergence made the pair start a new decline. The possible downside targets are the retracements of 50.0%, 61.8%, and 76.0% at 112.25, 112.10, and 111.93 respectively. The main downside target and the support level are the low at 111.62.
Attention! Forecasts presented in this section only reflect the author’s private opinion and should not be considered as guidance for trading. RoboForex LP bears no responsibility for trading results based on trading recommendations described in these analytical reviews.
Oil prices are down a bit, but are still close to multi-year highs. That should leave the shale industry flush with cash. However, a long list of U.S. shale companies are still struggling to turn a profit.
A new report from the Institute for Energy Economics and Financial Analysis (IEEFA) and the Sightline Institute detail the “alarming volumes of red ink” within the shale industry.
“Even after two and a half years of rising oil prices and growing expectations for improved financial results, a review of 33 publicly traded oil and gas fracking companies shows the companies posting negative free cash flows through June,” the report’s authors write. The 33 small and medium-sized drillers posted a combined $3.9 billion in negative cash flow in the first half of 2018.
The glaring problem with the poor financial results is that 2018 was supposed to be the year that the shale industry finally turned a corner. Earlier this year, the International Energy Agency painted a rosy portrait of U.S. shale, arguing in a report that “higher prices and operational improvements are putting the US shale sector on track to achieve positive free cash flow in 2018 for the first time ever.”
The improved outlook came after years of mounting debt and negative cash flow. The IEA estimates that the U.S. shale industry generated cumulative negative free cash flow of over $200 billion between 2010 and 2014. The oil market downturn that began in 2014 was supposed to have changed profligate spending, pushing out inefficient companies and leaving the sector as a whole much leaner and healthier.
“Current trends suggest that the shale industry as a whole may finally turn a profit in 2018, although downside risks remain,” the IEA wrote in July. “Several companies expect positive free cash flow based on an assumed oil price well below the levels seen so far in 2018 and there are clear indications that bond markets and banks are taking a more positive attitude to the sector, following encouraging financial results for the first quarter.”
But the warning signs have been clear for some time. The Wall Street Journal reported in August that the second quarter was a disappointment. The WSJ analyzed 50 companies, finding that they spent a combined $2 billion more than they generated in the second quarter.
The new report from IEEFA and the Sightline Institute add more detail the industry’s recent performance. Only seven out of the 33 companies analyzed in the report had positive cash flow in the first half of the year, and the whole group burned through a combined $5 billion in cash reserves over that time period.
Even more remarkable is the fact that the negative financials come amidst a production boom. The U.S. continues to break production records week after week, and at over 11 million barrels per day, the U.S. could soon become the world’s largest oil producer. Analysts differ over the trajectory of shale, but they only argue over how fast output will grow.
Yet, even as drillers extract ever greater volumes of oil from the ground, they still are not turning a profit. “To outward appearances, the U.S. oil and gas industry is in the midst of a decade-long boom,” IEEFA and the Sightline Institute write in their report. However, “America’s fracking boom has been a world-class bust.”
The ongoing struggles raises questions about the long-term. If the industry is still not profitable – after a decade of drilling, after major efficiency improvements since 2014, and after a sharp rebound in oil prices – when will it ever be profitable? Is there something fundamentally problematic about the nature of shale drilling, which suffers from steep decline rates over relatively short periods of time and requires constant spending and drilling to maintain?
Third quarter results will start trickling in over the next few days and weeks, which should provide more clues into the shale industry’s health. There is even more pressure on drillers to post profits because the third quarter saw much higher oil prices.
“Until the industry as a whole improves, producing both sustained profits and consistently positive cash flows, careful investors would be wise to view fracking companies as speculative investments,” the authors of the report concluded.
AUDUSD is trading at 0.7059; the instrument is moving below Ichimoku Cloud, thus indicating a descending tendency. The markets could indicate that the price may test the downside border of the cloud at 0.7085 and then resume moving downwards to reach 0.6980. Another signal to confirm further descending movement is the price’s rebounding from the resistance level. However, the scenario that Implies further decline may be cancelled if the price breaks the upside border of the cloud and fixes above 0.7145. In this case, the pair may continue growing towards 0.7250.
NZDUSD, “New Zealand Dollar vs US Dollar”
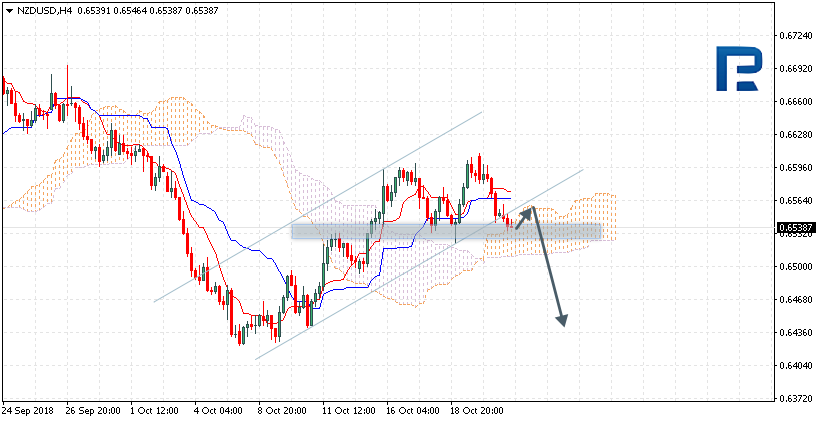
NZDUSD is trading at 0.6538; the instrument is moving inside Ichimoku Cloud, thus indicating a sideways tendency. The markets could indicate that the price may test the upside border of the cloud at 0.6555 and then resume moving downwards to reach 0.6435. Another signal to confirm further descending movement is the price’s rebounding from the channels’ downside border. However, the scenario that Implies further decline may be cancelled if the price breaks the upside border of the cloud and fixes above 0.6575. In this case, the pair may continue growing towards 0.6670. After breaking the support level and fixing below 0.6500, the price may continue moving downwards and complete the Double Top reversal pattern.
USDCAD, “US Dollar vs Canadian Dollar”
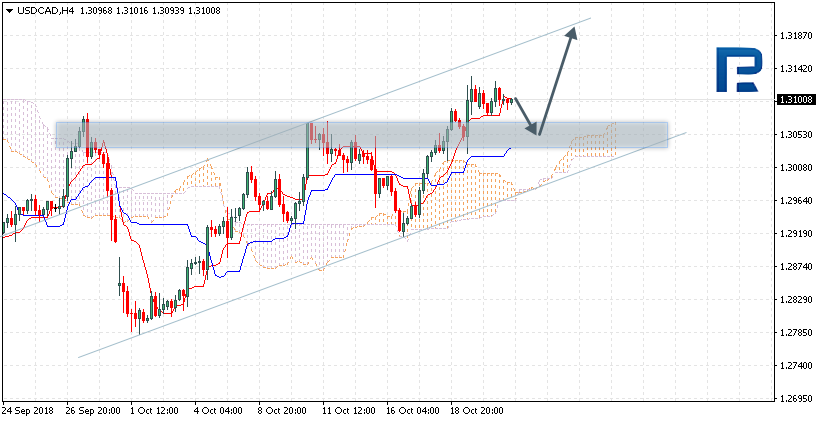
USDCAD is trading at 1.3100; the instrument is moving above Ichimoku Cloud, thus indicating an ascending tendency. The markets could indicate that the price may test Tenkan-Sen and Kijun-Sen at 1.3055 and then continue moving upwards to reach 1.3185. Another signal to confirm further ascending movement is the price’s rebounding from the support level. However, the scenario that implies further growth may be cancelled if the price breaks the downside border of the cloud and fixes below 1.2965. In this case, the pair may continue falling towards 1.2855.
Attention! Forecasts presented in this section only reflect the author’s private opinion and should not be considered as guidance for trading. RoboForex LP bears no responsibility for trading results based on trading recommendations described in these analytical reviews.
Yesterday, the bearish sentiment prevailed on the EUR/USD currency pair. The euro is under pressure due to uncertainty over the Italian budget. Drop in quotes exceeded 60 points. Trading instrument has updated local lows. At the moment, the euro is consolidating in the range of 1.14500-1.14750. The EUR/USD quotes have the potential for further decline.
Today, the news feed is calm.
The price has fixed below 50 MA and 200 MA, which indicates the power of sellers.
The MACD histogram is in the negative zone, but above the signal line, which gives a weak signal to sell EUR/USD.
Stochastic Oscillator is in the neutral zone, the %K line is above the %D line, which indicates the EUR/USD quotes growth.
Trading recommendations
Support levels: 1.14500, 1.14000
Resistance levels: 1.14750, 1.15000, 1.15250
If the price fixes below the local support level of 1.14500, a further fall in the EUR/USD quotes is expected. The movement is tending to the round level of 1.14000.
Alternative option. If the price fixes above the 1.14750 mark, it is necessary to look for entry points to the market to open long positions. The movement is tending to 1.15000-1.15250.
The GBP/USD currency pair
Technical indicators of the currency pair:
Prev Open: 1.30660
Open: 1.29567
% chg. over the last day: -0.77
Day’s range: 1.29369 – 1.29763
52 wk range: 1.2662 – 1.4378
The GBP/USD currency pair continues to show negative dynamics. During yesterday’s trading session, the pound weakened against the US dollar by more than 100 points. The UK currency is under pressure due to uncertainty over the Brexit issue. At the moment, the GBP/USD quotes are in a sideways trend. The key range is 1.29500-1.29900. Trading instrument has the potential for further decline.
We recommend paying attention to the speech by the Bank of England governor Carney.
The price has fixed below 50 MA and 200 MA, which indicates the power of sellers.
The MACD histogram is in the negative zone, but above the signal line, which gives a weak signal to sell GBP/USD.
Stochastic Oscillator is in the neutral zone, the %K line is above the %D line, which indicates the GBP/USD quotes growth.
Trading recommendations
Support levels: 1.29500, 1.29000
Resistance levels: 1.29900, 1.30200, 1.30750
If the price fixes below the support level of 1.29500, a further fall in the GBP/USD currency pair is expected. The movement is tending to the round level of 1.29000.
Alternative option. If the price fixes above the level of 1.29900, it is necessary to consider purchases of GBP/USD. The movement is tending to 1.30200-1.30400.
The USD/CAD currency pair
Technical indicators of the currency pair:
Prev Open: 1.30894
Open: 1.30963
% chg. over the last day: -0.04
Day’s range: 1.30877 – 1.31145
52 wk range: 1.2248 – 1.3387
Since the beginning of this week, the USD/CAD currency pair has being traded in a flat. Unidirectional trend is not observed. The USD/CAD quotes are testing local support and resistance levels: 1.30800 and 1.31200, respectively. In the near future technical correction is not excluded. Investors took a wait-and-see attitude before the Bank of Canada meeting.
Today, the news feed on the economy of Canada is calm.
Indicators do not send accurate signals. The price is testing 50 MA, which acts as dynamic support.
The MACD histogram is near the 0 mark.
Stochastic Oscillator is in the neutral zone, the %K line has crossed the %D line. There are no signals at the moment.
Trading recommendations
Support levels: 1.30800, 1.30300, 1.30000
Resistance levels: 1.31200, 1.31500
If the price fixes above the resistance level of 1.31200, the USD/CAD currency pair growth is expected. The movement is tending to 1.31500-1.31700.
Alternative option. If the price fixes below 1.30800, a correctional movement is expected. The target level for profit taking is 1.30400-1.30200.
The USD/JPY currency pair
Technical indicators of the currency pair:
Prev Open: 112.804
Open: 112.364
% chg. over the last day: +0.26
Day’s range: 112.306 – 112.840
52 wk range: 104.56 – 114.74
The USD/JPY currency pair has been declining. During the Asian trading session, the drop in prices was almost 50 points. At the moment, the “safe haven” currency is testing the mirror support level of 112.350. The local resistance is the 112.650 mark. Positions should be opened from these marks. We recommend paying attention to the US government bonds yield.
The news feed on the economy of Japan is calm.
Indicators do not send accurate signals: the price has fixed between 50 MA and 200 MA.
The MACD histogram has moved to the negative zone, which indicates the power of sellers.
Stochastic Oscillator is in the oversold zone, the %K line has crossed the %D line. There are no signals at the moment.
Trading recommendations
Support levels: 112.350, 112.000, 111.650
Resistance levels: 112.650, 112.900, 113.250
If the price fixes below 112.350, a further fall in the USD/JPY quotes is expected. The movement is tending to 112.000-111.700.
An alternative may be the growth of the USD/JPY currency pair to the round level of 113.000.


 This is fairly obvious to see in the chart, above, where the initial downside price rotation in February 2018 established the deeper price low. This low price level was still higher than the previous price low on the left edge of this chart. As you can see, after the February 2018 price low, price continued to rotate in an attempt to establish a new “price high” or “price low” beyond the existing highest and lowest price levels. It failed many time to accomplish this new price high or low and, in doing so, continued to rotate within a narrower price range. Until…