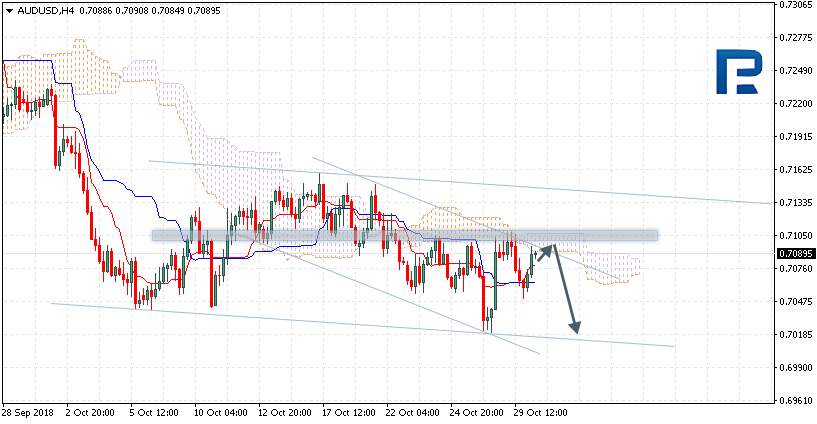
AUDUSD is trading at 0.7089; the instrument is moving below Ichimoku Cloud, thus indicating a descending tendency. The markets could indicate that the price may test the downside border of the cloud at 0.7100 and then resume moving downwards to reach 0.7020. Another signal to confirm further descending movement is the price’s rebounding from the channel’s upside border. However, the scenario that Implies further decline may be cancelled if the price breaks the upside border of the cloud and fixes above 0.7130. In this case, the pair may continue growing towards 0.7220.
NZDUSD, “New Zealand Dollar vs US Dollar”
NZDUSD is trading at 0.6549; the instrument is moving inside Ichimoku Cloud, thus indicating a sideways tendency. The markets could indicate that the price may test the upside border of the cloud at 0.6560 and then resume moving downwards to reach 0.6475. Another signal to confirm further descending movement is the price’s rebounding from the resistance level. However, the scenario that Implies further decline may be cancelled if the price breaks the upside border of the cloud and fixes above 0.6575. In this case, the pair may continue growing towards 0.6650. After breaking the downside border of the Triangle pattern and fixing below 0.6450, the price may continue moving downwards.
USDCAD, “US Dollar vs Canadian Dollar”
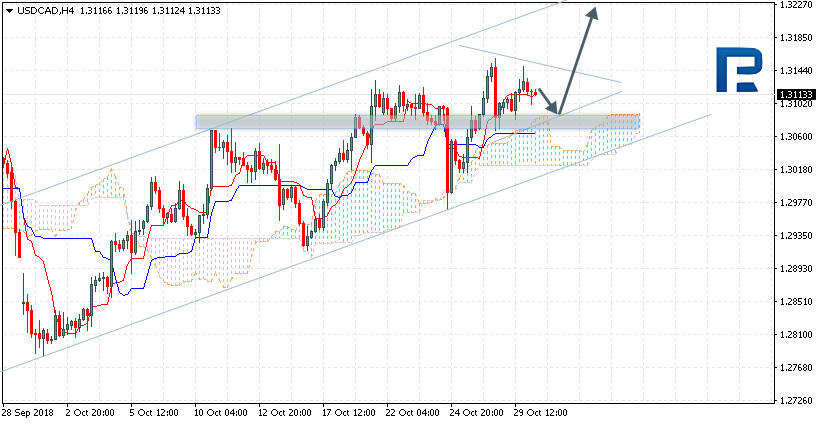
USDCAD is trading at 1.3113; the instrument is moving above Ichimoku Cloud, thus indicating an ascending tendency. The markets could indicate that the price may test the upside border of the cloud at 1.3100 and then continue moving upwards to reach 1.3225. Another signal to confirm further ascending movement is the price’s rebounding from the support level. However, the scenario that implies further growth may be cancelled if the price breaks the downside border of the cloud and fixes below 1.3020. In this case, the pair may continue falling towards 1.2935. After breaking the upside border of the Triangle pattern and fixing above 1.3155, the price may continue moving upwards.
Attention! Forecasts presented in this section only reflect the author’s private opinion and should not be considered as guidance for trading. RoboForex LP bears no responsibility for trading results based on trading recommendations described in these analytical reviews.
The technical pattern on the EUR/USD currency pair is ambiguous. The euro is still under pressure against the political instability. At the moment, the EUR/USD quotes are consolidating. Local support and resistance levels are: 1.13500 and 1.13800, respectively. Positions should be opened from these marks. In the near future, correction of the trading instrument is not excluded. We expect important economic reports.
The news feed on 30.10.2018:
– Report on the labor market in Germany at 10:55 (GMT+2:00);
– Consumer confidence index in the US at 16:00 (GMT+2:00).
The price has fixed below 50 MA and 200 MA, which indicates the bearish sentiment.
The MACD histogram is in the negative zone and continues to decline, which gives a signal to sell EUR/USD.
Stochastic Oscillator is in the neutral zone, the %K line is below the %D line, which also indicates the bearish sentiment.
Trading recommendations
Support levels: 1.13500, 1.13300, 1.13000
Resistance levels: 1.13800, 1.14300, 1.14700
If the price fixes below the local support level of 1.13500, a further fall in the EUR/USD quotes is expected. The movement is tending to 1.13250-1.13000.
Alternative option. If the price fixes above the resistance of 1.13800, it is necessary to look for entry points to the market to open long positions. The movement is tending to 1.14300-1.14500.
The GBP/USD currency pair
Technical indicators of the currency pair:
Prev Open: 1.28274
Open: 1.27968
% chg. over the last day: -0.23
Day’s range: 1.27557 – 1.27817
52 wk range: 1.2662 – 1.4378
The GBP/USD currency pair is in a sideways trend. At the moment, the local support and resistance levels are: 1.27600 and 1.28000, respectively. Investors expect new information regarding the Brexit process. We recommend opening positions from the key levels. In the near future, technical correction is not excluded.
The news feed on the UK economy is calm.
Indicators point to the power of sellers: the price has fixed below 50 MA and 200 MA.
The MACD histogram is in the negative zone, below the signal line, which gives a strong signal to sell GBP/USD.
The Stochastic Oscillator is located near the oversold zone, the %K line has crossed the %D line. There are no signals at the moment.
Trading recommendations
Support levels: 1.27600, 1.27300
Resistance levels: 1.28000, 1.28400, 1.28800
If the price fixes below the support of 1.27600, a further fall in the GBP/USD currency pair is expected. The movement is tending to 1.27300-1.27000.
Alternative option. If the price fixes above the round level of 1.28000, it is necessary to consider purchases of GBP/USD. The movement is tending to 1.28400-1.28600.
The USD/CAD currency pair
Technical indicators of the currency pair:
Prev Open: 1.30958
Open: 1.31303
% chg. over the last day: +0.24
Day’s range: 1.31055 – 1.31153
52 wk range: 1.2248 – 1.3387
At the moment, the technical picture on the USD/CAD currency pair is ambiguous. The trading instrument is in a sideways trend. Investors expect additional drivers. Local support and resistance levels are: 1.30900 and 1.31250, respectively. Positions should be opened from these marks.
Today, the news feed on the economy of Canada is calm. We recommend paying attention to the speech by the Bank of Canada governor Poloz.
Indicators do not send accurate signals: the price is testing 50 MA.
The MACD histogram is near the 0 mark.
The stochastic oscillator is in the neutral zone, the %K line is crossing the %D line. There are no accurate signals.
Trading recommendations
Support levels: 1.30900, 1.30500, 1.30100
Resistance levels: 1.31250, 1.31600
If the price fixes above the level of 1.31250, the USD/CAD quotes growth is expected. The movement is movement to 1.31600-1.31800.
An alternative may be the decrease of the USD/CAD currency pair to 1.30500-1.30300.
The USD/JPY currency pair
Technical indicators of the currency pair:
Prev Open: 111.862
Open: 112.355
% chg. over the last day: +0.35
Day’s range: 112.755 – 112.839
52 wk range: 104.56 – 114.74
Aggressive purchases are observed on the USD/JPY currency pair. During yesterday’s and today’s trading sessions, the quotes growth exceeded 100 points. The trading instrument has updated local highs. At the moment, the key support and resistance levels are: 112.600 and 112.900, respectively. Positions should be opened from these marks. We recommend paying attention to the news feed on the US economy.
Publication of important economic reports from Japan is not planned.
The price has fixed above 50 MA and 200 MA, which indicates the power of buyers.
The MACD histogram is in the positive zone, above the signal line, which gives a strong signal to buy USD/JPY.
Stochastic Oscillator is in the overbought zone, the %K line has crossed the %D line. There are no signals at the moment.
Trading recommendations
Support levels: 112.600, 112.250, 112.000
Resistance levels: 112.900, 113.200
If the price fixes below the support level of 112.600, correction of the USD/JPY quotes is expected. The movement is tending to 112.250-112.000.
An alternative may be the further growth of the USD/JPY currency pair to 113.200-113.500.
Yesterday, the US dollar strengthened against a basket of major currencies. Financial markets participants have started to buy actively the US currency after it was reported that Washington intended to introduce duties for all remaining China imports by early December if negotiations between the US President Donald Trump and China’s President Xi Jinping lead to nothing. The US dollar index (#DX) closed in the positive zone (+0.23%). The potential for growth remains.
The euro weakened after it became known that German Chancellor Angela Merkel was not going to run again for the Christian Democratic Union of Germany leader. The Japanese yen also weakened significantly against the US dollar amid the rise in the Asian stock market.
The “black gold” prices decreased slightly. At the moment, futures for the WTI crude oil are testing a mark of $66.90 per barrel. At 22:30, a report on the API weekly crude oil stock will be published.
Market Indicators
Yesterday, the major US stock indices closed again in the negative zone: #SPY (-0.55%), #DIA (-0.84%), #QQQ (-2.06%).
The 10-year US government bonds yield continues to decline. At the moment, the indicator is at the level of 3.10-3.11%.
The news feed on 30.10.2018:
– Report on the labor market in Germany at 10:55 (GMT+2:00); – Consumer confidence index in the US at 16:00 (GMT+2:00).
We also recommend paying attention to the speech by the Bank of Canada governor Poloz.
Today, we have a kind of funeral here as we analyse an instrument that unfortunately seems to have died about two weeks ago: bitcoin. On the 15th of October, we had a huge rise (which was later partially retraced), and I think that this led to the lack of volatility we’ve seen over the following weeks. BTC’s volatility has all but disappeared. One of the most popular features of this cryptocurrency is gone.
The price of this crypto asset is locked in a rectangular pattern between 6,340 and 6,470 USD (orange areas). As long as we remain within this range, we have no trading signal. The best way to deal with this is to wait for a breakout. A breakout of the upper orange area will give us a short-term buy signal, while a downwards breakout will give us a sell signal. The most important area for the long-term situation is the yellow zone at the bottom of the chart, which is the ultimate support for the whole of 2018. A breakout of this level will open the gates to hell for BTC.
There is also another important factor here that should be mentioned, which is the blue downwards trend line. It’s actually the upper line of a descending triangle pattern. The price has broken through this, which in theory should bring us a buy signal. In my opinion, we were just pushed out of the triangle. This was not a breakout, so there is no buy signal. From this formation at least, my outlook on BTC is rather negative.
On Monday the 29th of October, trading on the euro closed down. The price swayed in different directions against the background of statements by German Chancellor Angela Merkel and data from the US.
Merkel has announced the end of her political career, stating that she will not see re-election in Germany’s next federal elections in 2021. The strengthening of the US currency was caused by the publication of favourable data on consumer spending and reduced demand for risky assets in response to the downward correction of US stock indices. Statistics are now important for the market, as the next increase in interest rates is expected next week in the US.
13:00 Eurozone: GDP (Q3), consumer confidence (Oct), economic sentiment indicator (Oct), industrial confidence (Oct), business climate (Oct).
16:00 Germany: CPI (Oct).
16:00 US: S&P/Chase-Shiller home price indices (Aug).
17:00 US: CB consumer confidence (Oct).
Fig 1. EURUSD hourly chart.
Current situation:
Yesterday’s market expectations were fully justified. The price dropped to the 45th degree and came back. The price model for growth began to lose momentum after the evenin fall. While it is relevant, I would venture today to consider a price increase from the 45th degree (1.1363) to 1.1425/30. If the hourly candlestick closes below 1.1355, the forecase will be cancelled. In this case, it is worth preparing for a new low of 1.1336.
Of the data mentioned, it’s worth paying attention to the labour market and inflation report in Germany.
Almost like clockwork, our research team, at Technical Traders Ltd., (predicted on September 17) the US stock market would turn lower and attempt a 5~8% downside move on or after September 21 headed into the US mid-term elections. Our analysis of the potential downside move was related to our price modeling systems expectations that a common predicted downside target existed between -5% and -8%. Our researchers did not believe the markets would fall much below -10% before hammering out a price bottom and finding support.
Today, we wanted to alert you to the fact that we are just 7~10 days away from the US mid-term elections and if our predictions hold true, we will be establishing a price bottom in the US stock markets over the next 5+ trading days and begin a new upside price rally fairly quickly after the election results are known. We could interpret this as “a period of uncertainty that is mixed with economic and news data” which results in investors pulling out of the markets ahead of these types of global events. In all reality, the US elections are really a global event for many investors. Policies, regulations, taxes, objectives, and execution become a very big question for many as these elections take place. Hundreds of billions of dollars are exposed to risk in the weeks headed into US elections and, thus, global investors and traders are always cautious headed into a major US election.
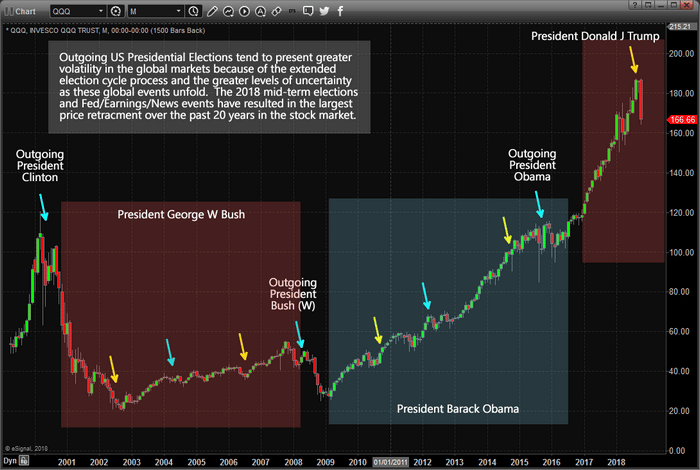
Our theory is that this phenomenon has become even more volatile in recent years and global political ideals have become further polarized. We believe when a sitting US president that has served for two terms is leaving office, far greater volatility enters the global markets typically. We believe that mid-term US elections, depending on the political climate at the time, may or may not reflect in broad global market concerns and volatility. We’ve highlighted major US Presidential elections and US Mid-Term elections on the chart below so you can see how volatility and price rotation increase or decrease depending on the political climate and uncertainty associated with these US elections. We’ve highlighted 6+ months (or longer) before Presidential elections and a few months before mid-term elections.
The current election event, November 6, 2018, is somewhat unique as it also coincides with the US Fed having raised FFR rates considerably over the past 2+ years as well as after a dramatic price increase in the US equities markets following the election of President Donald J. Trump. You can clearly see from the chart below that the QQQ has increased by nearly $80+ over the past two years while that same $80 increase existed over the entire Obama stock market recovery (8 years). This reflects the amount of increased volatility and activity that is within the current global capital market.
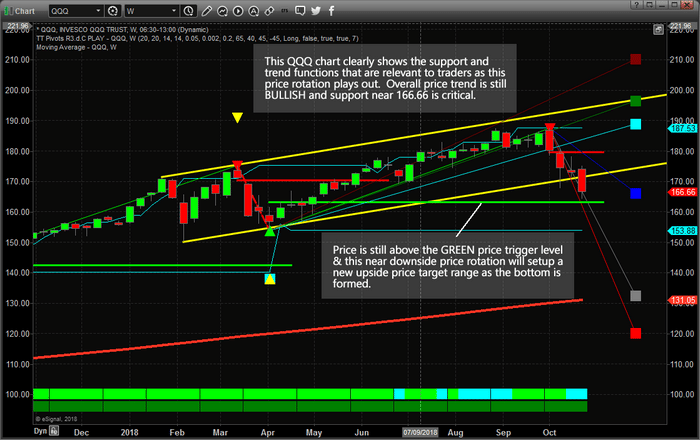
This QQQ Weekly chart highlights what we believe to be the core elements of this election cycle rotation. On this Weekly chart, the overall price trend is still BULLISH (see the DARKER GREEN blocks near the bottom of the chart) and the bullish price trigger level near $163 is still valid. Yes, the shorter term price trend is currently BEARISH and has been so since the week of October 8. You can see the bearish price trigger level near $179 (in red) that was recently breached and the downside price target level (in blue) near $166.
Our expectations from our predictions that the markets would be rotated lower by 5~8% were that the markets would move towards the lower YELLOW price channel level and stall near these levels (or just below these levels). We did not expect the extended price decline that was a result of earnings data and housing data being released last week. We still believe this move has already reached its downside objectives and is in the process of setting up a major bottom formation. We believe the extended move was an emotional price reaction to a hyper-election environment in the US and extended anticipation of caution in the global capital markets.
In the next segment of this research article, we’ll take a look at additional technical, price and modeling systems that support our belief of a major bottom formation setting up in the US equity markets and how election cycle events should be played for success. This current downside price rotation has extended to below our expected levels – much like a deeper “washout low” price formation. We continue to believe the next 7+ trading days will hammer out a bottom formation and that the US equities markets will resume an upside advance shortly after the elections are completed and throughout the remainder of 2018.
Please take a minute to visit TheTechnicalTraders.comto learn more about how we help our members find and execute success and how we can help you navigate these market rotations. Our predictive modeling systems called this move nearly 4 weeks in advance and now they are calling for a bottom to set up near November 10th and a price rally to resume throughout the rest of 2018. If you want to find out how these incredible tools can help you find and execute better trades, then visit TheTechnicalTraders.com to learn more.
Over the past 20+ years of research and trading in the markets, our team of traders and researchers know one thing is certain, when fear hits the global markets, precious metals react by rocketing higher. We’ve seen this happen over and over again – even when non-US geopolitical concerns spark some true fear in the markets.
If you’ve followed our research this week, we’ve been warning about how we believe this move is purely price and technical based and not really a fear-based global price collapse. In other words, our technical systems, price modeling systems, and other advanced price analysis tools are suggesting this move is nearing an end and was likely a function of price rotation and less a function of true fear in the global markets.
Yes, there were a couple of key factors the precipitated this price move; the Fed, Earnings, Housing Data, Trade, and Geopolitical concerns and the US Elections. Yet the biggest concern for traders was the “deja vu” feeling that Housing could present another massive crash near an election. We’ve been through that and we know how ugly that can be if it were to unfold again.
Our researchers, at www.TheTechnicalTraders.com, spent quite a bit of time going over the data and we continue to believe this downside price rotation in the global stock markets was nothing more than a technical price correction WITHOUT any real capitulation from other commodities. If the recent downside price collapse sowed any real fear into investors, then precious metals should have skyrocketed higher over the past 3+ weeks.
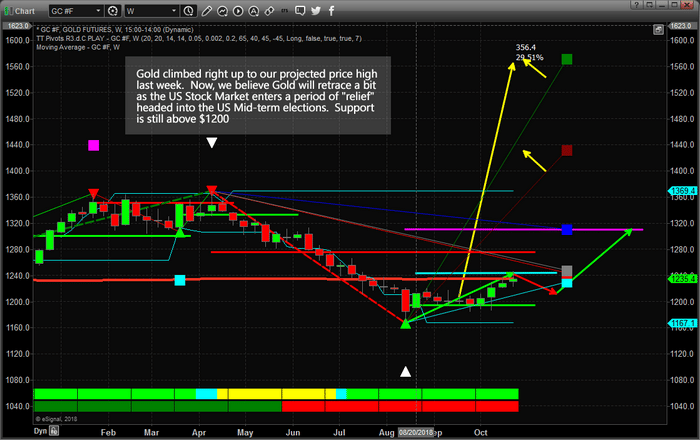
This Weekly Gold chart shows how prices advanced moderately over the past few weeks and failed to originate any real broad upside move as equity prices collapsed. Weeks ago, we predicted Gold would climb to near $1235, the CYAN line on this chart, before weakening to near $1200 again near the US mid-term elections. After the elections, we believe that Gold will begin another price advance toward a price target near $1310 headed into 2019.
The YELLOW arrow showing the massive upside projections are based on our Fibonacci price modeling system and suggest that Gold may ultimately have an upside potential near $1435 or $1565 eventually. These upside targets, if reached, would be the result of REAL FEAR entering the global markets associated with a much greater contagion/capitulation event taking place. This may be something that happens in the future, as some point, but we don’t believe this is taking place now.
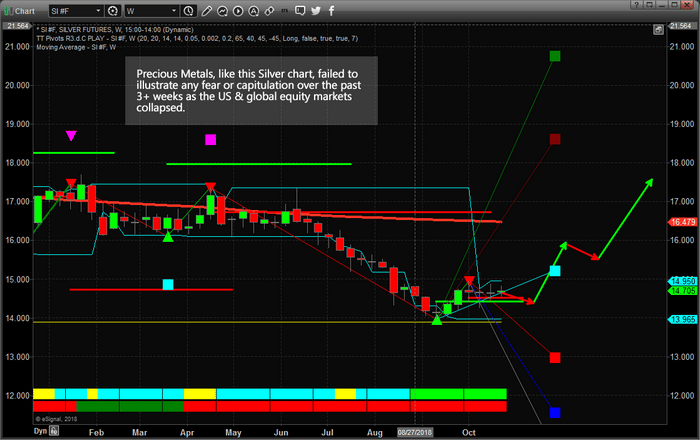
This Weekly Silver chart further illustrates the weakness in the precious metals sector throughout this recent global stock market collapse. The price of Silver actually fell slightly over the past few weeks and stayed near $14.75. A recent double bottom formation in Silver near $13.95 is a very strong indication that Silver is establishing a long-term base near the $14.00 level. You can see from our draws arrows that we believe Silver will continue to contract headed into the US mid-term elections, then begin a moderate advance higher.
We are actively searching for new trades within the precious metals sector that present clear opportunities for our members/subscribers as we believe this upside move in the metals will be one of the best trades in 2019. Although, right now, these trades are “setup trade” in the sense that we don’t expect any true fear to change price at the moment. We do expect investors to continue to look towards the precious metals markets as a form of protection from global events in the future and we believe that when the dam breaks and fear really does enter the markets, traders need to already be positioned within the precious metals sector – not chasing after the move.
Overall, our question still remains valid – where’s the capitulation in the precious metals? If this downside price movement within the global markets was “the top”, we have yet to see any real capitulation in precious metals, which we believe would be the first place to reflect this true fear. Without this capitulation, our researchers continue to believe this is a technical “reversion” move where price is moving lower to re-establish support for another upside price advance.
In conclusion, we do expect moderate price advances in the precious metals sector over the next 4~6+ months. We believe this sector will continue to attract investors as a means of protection against a sudden and more structural price collapse event in the future. Right now, though, we just don’t see the capitulation that would need to be in place if the downside equities move instilled any real fear in traders. It’s just not there – yet. Therefore, this recent downside swing appears to be a capital shift or reversion event where price will quickly attempt to find support, based (headed into the US mid-term elections – as we’ve been suggesting) and begin to move higher after November 12th.
Please visit www.TheTechnicalTraders.com/FreeResearch/ to see all of our recent research posts and to help you understand what our researchers believe is really transpiring within the global markets. Additionally, please visit TheTechnicalTraders.com to learn how we can help you find and execute better trades and stay ahead of these market moves. Learn how we help our subscribers by delivering specialized content, video, research, trading signals and more. The next few years are going to be full of fantastic trading opportunities. Now is the time to start to take advantage of these setups and create greater success for your future.
As we can see in the H4 chart, XAUUSD has reached the retracement of 38.2%, and right now one can see the divergence. The next upside target may be the retracement of 50.0% at 1262.85. The main support level is at 1183.22.
In the H1 chart, the divergence made the pair start a new descending movement. The possible targets may be the retracements of 23.6%, 38.2%, and 50.0% at 1229.15, 1220.50, and 1213.30 respectively.
USDCHF, “US Dollar vs Swiss Franc”
As we can see in the H4 chart, USDCHF has reached the post-correctional extension area between the retracements of 138.2% and 161.8% and right now once can see the divergence, which may indicate a possible pullback soon. At the same time, if the price breaks the high at 1.0026, the instrument may continue trading upwards to reach the retracement of 261.8% at 1.0129.
In the H1 chart, the divergence made the pair reverse and start a new decline to break the short-term support level at 0.9955. The downside targets are the retracements of 23.6%, 38.2% and 50.0% at 0.9912, 0.9841, and 0.9784 respectively.
Attention! Forecasts presented in this section only reflect the author’s private opinion and should not be considered as guidance for trading. RoboForex LP bears no responsibility for trading results based on trading recommendations described in these analytical reviews.
EURUSD is trading to return to 1.1425. Today, the pair may reach this level and then and then resume trading inside the downtrend with the target at 1.1302. Later, the market may form a new ascending structure towards 1.1361 and then start another decline to reach the short-term target of the third descending wave is at 1.1230.
GBPUSD, “Great Britain Pound vs US Dollar”
GBPUSD is moving upwards to reach 1.2857. Later, the market may resume falling towards 1.2721 and then grow to return to 1.2857. After that, the instrument may resume trading inside the downtrend with the short-term target of the third descending wave at 1.2615.
USDCHF, “US Dollar vs Swiss Franc”
USDCHF has reached 0.9970. Possibly, today the price may consolidate at the current levels. After the instrument breaks this pattern to the upside, the pair may resume trading inside the uptrend towards 1.0040 and then form a new descending structure to reach 0.9972. Later, the market may move upwards to reach the short-term target of the third ascending wave at 1.0106.
USDJPY, “US Dollar vs Japanese Yen”
USDJPY has broken the Triangle pattern downwards and returned to the broken border. Today, the pair may continue falling towards 111.11 and then start another growth to return to 111.78. After that, the instrument may resume trading inside the downtrend to reach the short-term target of the third descending wave at 110.72.
AUDUSD, “Australian Dollar vs US Dollar”
AUDUSD has returned to the center of the consolidation range. Today, the pair may move downwards to reach 0.7030 and then grow towards 0.7070. Later, the market may resume trading inside the downtrend with the target at 0.7000.
USDRUB, “US Dollar vs Russian Ruble”
USDRUB is growing towards the upside border of the Triangle pattern. Possibly, today the price may reach 66.15 and then resume falling towards 64.89.
XAUUSD, “Gold vs US Dollar”
Gold has reached another upside target. Possibly, today the pair may be corrected with the target at 1224.54. Later, the market may resume trading inside the uptrend to reach the short-term target of the third ascending wave at 1262.50.
BRENT
Brent is forming the second ascending impulse. Possibly, the price may form a new descending structure towards 77.15 and then start another growth with the short-term target at 78.73. Later, the market may resume falling towards 77.15 and then move upwards to reach 78.96. After that, the instrument may start another decline towards the target of the first descending wave at 74.98.
Attention! Forecasts presented in this section only reflect the author’s private opinion and should not be considered as guidance for trading. RoboForex LP bears no responsibility for trading results based on trading recommendations described in these analytical reviews.
On Friday, the EUR/USD currency pair was showing a variety of trends. This week the investors are waiting for the Eurozone Inflation Report, which will be published on Wednesday. At the moment, the EUR\USD currency pair is consolidating in the 1.13700-1.14100 range. Positions should be opened from these marks. A technical correction is possible soon.
The price fixed between 50 MA and 200 MA, which act as dynamic support and resistance levels.
The MACD histogram is in the positive zone but below the signal line, which gives a weak signal towards the EUR\USD purchase.
The Stochastic Oscillator is in the neutral zone, the %K line crosses the %D line. There are no precise signals.
Trading recommendations
Support levels: 1.13700, 1.13400, 1.13000
Resistance levels: 1.14100, 1.14600, 1.15000
If the price fixes below the local support level of 1.13700, we can expect further descent of the EUR/USD quotes. The movement will tend towards 1.13400-1.13200.
Alternatively, the price fixes above the resistance level of 1.14100. In this case, you should look for the market entry points to open long positions. The movement will tend toward 1.14600-1.14800.
The GBP/USD currency pair
Technical indicators of the currency pair:
Prev Open: 1.28154
Open: 1.28274
% chg. over the last day: +0.12
Day’s range: 1.28059 – 1.28159
52 wk range: 1.2662 – 1.4378
The GBP/USD currency pair is in the sideward trend. The investors are waiting for the additional drivers. At the moment, the key support and resistance levels are 1.27900 and 1.28400 respectively. We recommend you open the positions from the key levels. A technical correction is possible soon.
The indicators do not provide precise signals: the price is testing 50 MA, which currently acts as a dynamic resistance line.
The MACD histogram is near 0.
The Stochastic Oscillator is in the neutral zone, the %K line is below the %D line, which indicates bearish sentiments.
Trading recommendations
Support levels: 1.27900, 1.27600, 1.27000
Resistance levels: 1.28400, 1.29000, 1.29500
If the price fixes below the support line of 1.27900, we can expect a further descend of the GBP/USD currency pair. The movement will tend toward 1.27600-1.27400.
Alternatively, if the price fixes above 1.28400, you should look at buying GBP/USD. The movement will tend toward 1.29000.
The USD/CAD currency pair
Technical indicators of the currency pair:
Prev Open: 1.30677
Open: 1.30958
% chg. over the last day: -0.07
Day’s range: 1.30992 – 1.31146
52 wk range: 1.2248 – 1.3387
Last week the Bank of Canada raised the key interest rate by 25 basis points to 1.75%. The demand for the CAD has grown significantly. The local support and resistance levels are 1.30800 и 1.31200, respectively. Positions should be opened from these levels.
The Economic News Feed for 29.10.2018 is calm.
There are no precise signals, the price is testing 50 МА.
The MACD histogram is around 0.
The Stochastic Oscillator is in the neutral zone, the %K line is below the %D line, which indicates bearish sentiments.
Trading recommendations
Support levels: 1.30800, 1.30400, 1.30000
Resistance levels: 1.31200, 1.31500, 1.31700
If the price fixes above 1.31200, we can expect further growth of the USD/CAD quotes. The movement will tend towards 1.31500-1.31700.
Alternatively, the currency pair can drop toward 1.30400-1.30000.
The USD/JPY currency pair
Technical indicators of the currency pair:
Prev Open: 112.397
Open: 111.862
% chg. over the last day: +0.07
Day’s range: 111.930 – 112.800
52 wk range: 104.56 – 114.74
The USD/JPY currency pair is showing a variety of trends. At the moment, the key support and resistance levels are 111.850 and 112.250. Positions should be opened from these levels. We recommend you keep an eye on the US government bonds yield.
The Economic News Feed for 29.10.2018 is calm.
The indicators do not provide precise signals, the price has crossed 50 MA.
The MACD histogram is around 0.
The Stochastic Oscillator is in the neutral zone, the %K line has crossed the %D line. There are no signals at the moment.
Trading recommendations
Support levels: 111.850, 111.600, 111.400
Resistance levels: 112.250, 112.600, 112.900
If the price fixes below the support level 111.850, we can expect further descent of the USD/JPY quotes. The movement will tend toward 111.600-111.400.
Alternatively, the currency pair can grow to 112.600-112.900.