The US currency continued to strengthen against a basket of major currencies. The US dollar was supported by optimistic data on the ADP nonfarm employment change in October. The figure counted to 227K, while experts expected 189K. The US dollar index (#DX) closed in the positive zone (+0.11%). In the near future technical correction is not excluded.
Yesterday, economic reports from the Eurozone and Canada were also published. According to preliminary data from Eurostat, the Eurozone consumer price index rose in October to 2.2% (y/y) instead of the forecasted value of 2.1% (y/y). Canada GDP growth (m/m) counted to 0.1% in August, while investors expected the figure to be at the level of 0.0%. Today, during the Asian trading session, Caixin manufacturing PMI has been published in China, which counted to 50.1 instead of 49.9. Demand for the pound has grown significantly. According to The Times, London and Brussels reached a preliminary agreement in the field of financial services. The Bank of England meeting is in the focus of attention.
The “black gold” prices are consolidating after a sharp collapse during yesterday’s trading. At the moment, futures for the WTI crude oil are testing a mark of $65.00 per barrel.
Market Indicators
Yesterday, the main US stock indices closed in the positive zone: #SPY (+1.07%), #DIA (+1.00%), #QQQ (+2.35%).
At the moment, the 10-year US government bonds yield is at the level of 3.15-3.16%.
The news feed on 01.11.2018:
– The index of economic activity in the UK manufacturing sector at 11:30 (GMT+2:00); – The Bank of England interest rate decision at 14:00 (GMT+2:00); – ISM manufacturing PMI in the US at 16:00 (GMT+2:00).
As we can see in the H4 chart, GBPUSD is trading towards the low at 1.2662. If the price breaks this level, it may continue moving towards the post-correctional extension area between the retracements of 138.2% and 161.8% at 1.2417 and 1.2270 respectively. At the same time, there is a convergence, which may indicate a possible short-term pullback.
In the H1 chart, there is a convergence, which may indicate a new pullback to the upside after the pair reaches the low at 1.2662. The possible targets are the retracements of 23.6%, 38.2%, and 50.0% at 1.2799, a.2882, and 1.2950 respectively.
EURJPY, “Euro vs. Japanese Yen”
As we can see in the H4 chart, the convergence made EURJPY reverse and start a new correction to the upside, which has already reached the retracement of 23.6%. The next possible targets are the retracements of 38.2% and 50.0% at 129.11 and 129.87 respectively. The support level is at 126.63.
In the H1 chart, there is a divergence, which may indicate a possible pullback in the nearest future. The targets may be the retracements of 23.6%, 38.2%, and 50.0% at 128.08, 127.82, and 127.59 respectively.
Attention! Forecasts presented in this section only reflect the author’s private opinion and should not be considered as guidance for trading. RoboForex LP bears no responsibility for trading results based on trading recommendations described in these analytical reviews.
EURUSD is moving downwards. Today, the pair may reach 1.1323 and then grow towards 1.1370. After that, the instrument may start another decline to reach 1.1276. The short-term target of this structure is at 1.1220.
GBPUSD, “Great Britain Pound vs US Dollar”
GBPUSD is still forming the third descending wave. Possibly, today the pair may reach 1.2655 and then form a new ascending structure towards 1.2777. Later, the market may resume trading inside the downtrend with the short-term target at 1.2477.
USDCHF, “US Dollar vs Swiss Franc”
USDCHF is still growing. Possibly, the price may consolidate and test 1.0000 from above. According to the main scenario, the pair may continue trading inside the uptrend to break 1.0044. The next target is at 1.0120.
USDJPY, “US Dollar vs Japanese Yen”
USDJPY is still moving upwards; it has almost formed the Divergent Triangle pattern and tested its upside border. Possibly, today the price may form a new consolidation range below 113.30. The instrument is expected to start a new descending structure towards 111.31. The first target is at 112.31.
AUDUSD, “Australian Dollar vs US Dollar”
AUDUSD is still consolidating around 0.7087. Today, the pair may form a new ascending structure towards the upside border at 0.7155 and then resume trading inside the downtrend to reach the key target of this wave at 0.7000.
USDRUB, “US Dollar vs Russian Ruble”
USDRUB is still trading in the center of the consolidation range around 65.55 without any particular direction. Possibly, the price may grow to reach the upside border at 66.36 and then resume falling with the short-term target at 63.90.
XAUUSD, “Gold vs US Dollar”
Gold has rebounded from 1235.50 and resumed falling. Possibly, the pair may continue the correction towards 1206.04. After that, the instrument may resume trading inside the uptrend towards 1252.30.
BRENT
Brent has completed the descending structure at 76.55 and right now is consolidating around this level. Possibly, the price may break the range to the downside to reach 74.95 and then start another growth to return to 77.40. The market is expected to start a new correction towards 80.37 and then resume falling with the first target at 73.60.
Attention! Forecasts presented in this section only reflect the author’s private opinion and should not be considered as guidance for trading. RoboForex LP bears no responsibility for trading results based on trading recommendations described in these analytical reviews.
Yesterday, the EUR/USD was showing a bearish sentiment. The currency pair is weakened after weak economic stats from the Eurozone. Right now, the EUR/USD quotes are consolidating. The local support and resistance levels are 1.13400 and 1.13650 respectively. Positions should be opened from these levels. A technical correction is possible soon.
The price fixed below 50 МА and 200 МА, which indicates a bearish sentiment.
The MACD histogram is in the red, but above the signal line, which gives a weak signal towards the sale of EUR/USD.
The Stochastic Oscillator is in the neutral zone, the %K line is above the %D line, which indicates a bullish sentiment.
Trading recommendations
Support levels: 1.13400, 1.13000
Resistance levels: 1.13650, 1.14000, 1.14400
If the price fixes below the local support level of 1.13400, we can expect a further fall of EUR/USD towards 1.13000.
Alternatively, if the price fixes above the resistance level of 1.13650, you should look for market entry points to open long positions. The movement will tend toward 1.14000-1.14400.
The GBP/USD currency pair
Technical indicators of the currency pair:
Prev Open: 1.27968
Open: 1.27076
% chg. over the last day: -0.66
Day’s range: 1.27223 – 1.27394
52 wk range: 1.2662 – 1.4378
Yesterday, the pound started losing positions against the USD. At the moment, the GBP/USD quotes are recovering. The key support and resistance levels are 1.27000 and 1.27600 respectively. The investors are waiting for the additional drivers. Tomorrow, the Bank of England will publish their resolution regarding the key interest rate. You should open positions from the key levels. The trading instrument has some potential towards further growth.
The Economic News Feed for 31.10.2018 is calm.
The indicators show the sellers’ strength — the price fixed below the 50 MA and 200 MA.
The MACD histogram is in the positive zone, but above the signal line, which gives a weak signal towards a sale of GBP/USD.
The Stochastic Oscillator is around the overbought zone, the %K line is above the %D line, which gives a weak signal towards a sale of GBP/USD.
Trading recommendations
Support levels: 1.27000, 1.26600
Resistance levels: 1.27600, 1.28000, 1.28400
If the price fixes above the resistance level of 1.27600, we can expect a correction. The movement will tend toward 1.28000-1.28400.
Alternatively, the GBP/USD quotes will fall towards 1.27000-1.26750.
The USD/CAD currency pair
Technical indicators of the currency pair:
Prev Open: 1.31303
Open: 1.31112
% chg. over the last day: -0.14
Day’s range: 1.31179 – 1.31269
52 wk range: 1.2248 – 1.3387
The USD/CAD currency pair is showing an ambiguous picture. The trading instrument is still moving sidewards. Investors are waiting for additional drivers. The local support and resistance levels are 1.31100 and 1.31400 respectively. Positions should be opened from these levels.
The Economic News Feed for 31.10.2018:
– GDP report (Canada) – 14:30 (GMT+2:00).
We also recommend you keep an eye on Stephen Poloz – Governor of the Bank of Canada – and his speech.
The indicators do not provide precise signals: the price is testing 50 MA.
The MACD histogram is around 0.
The Stochastic Oscillator is in the neutral zone, the %K line is below the %D line, which indicates a bearish sentiment.
Trading recommendations
Support levels: 1.31100, 1.30700, 1.30400
Resistance levels: 1.31400, 1.31700
If the price fixes above the 1.31400, we can expect further growth of the USD/CAD quotes. The movement will tend toward 1.31700-1.32000.
Alternatively, the price can lower to 1.30700-1.30500.
The USD/JPY currency pair
Technical indicators of the currency pair:
Prev Open: 112.355
Open: 113.076
% chg. over the last day: +0.61
Day’s range: 113.029 – 113.218
52 wk range: 104.56 – 114.74
The USD/JPY currency pair is showing a positive trend. During yesterday’s and today’s trade, the quotes have grown almost by 100 points. Currently, the USD/JPY quotes are consolidating. The local support and resistance levels are 112.900 и 113.250, respectively. Positions should be opened from these levels. A technical correction is possible in the near future.
The Bank of Japan kept the key parameters of the monetary policy on the same level.
The price fixed above 50 MA and 200 MA, which indicates the buyers’ strength.
The MACD histogram is in the positive zone, but below the signal line, which gives a weak signal towards buying USD/JPY.
The Stochastic Oscillator is in the neutral zone, the %K line is below the %D line, which indicates a bearish sentiment.
Trading recommendations
Support levels: 112.900, 112.600, 112.300
Resistance levels: 113.250, 113.500
If the price fixes below the mirror support 112.900, we can expect a correction of the USD/JPY quotes. The movement will tend toward 112.600-112.300.
Alternatively, the price can grow towards 113.500-113.700.
The US currency kept strengthening against the basket of other currencies. It got a boost due to the publication of the Customer Confidence Index, which in October reached 137.9 instead of the expected 136.0. The USD index (#DX) updated the monthly maximums and closed in the positive zone (+0.45%). The prospects for growth remain.
The EUR is slightly weakened after the publication of the weak economic stats from the eurozone. The number of unemployed citizens in Germany lowered by 11K in October, but the experts expected it to lower by at least 12K. The preliminary quarterly Eurozone GDP reports indicate 0.2% growth instead of 0.4%. This means that the annual Eurozone GDP growth slowed to 1.7%, while the experts expected 1.9%.
Australian Customer Price Index for the third quarter was published during the Asian trading session today. It grew by 0.4%, while the experts expected 0.5%. The “Purchasing Manager” Index in China for October reached 50.2 instead of 50.6. The Bank of Japan, as expected, kept the basic parameters of the monetary policy at the same level.
The oil prices started to grow. At the moment, the WTI futures are at the 67 USD/barrel. At 16:30 (GMT+2:00) we can expect an API Weekly Crude Oil Stock report from the USA.
Market Indicators
Yesterday, the major US stock indices started to recover: #SPY (+1,48%), #DIA (+1,73%), #QQQ (+1,65%).
The 10-year US government bonds yield keeps lowering. Right now, it is 3,13-3,14%.
The Economic News Feed for 31.10.2018:
– The Consumer Price Index (EU) – 12:00 (GMT+2:00); – ADP Non-farm Employment Change (US) – 14:15 (GMT+2:00); – GDP Report (Canada) – 14:30 (GMT+2:00).
We also recommend you keep an eye on Stephen Poloz – Governor of the Bank of Canada – and his speech.
On Tuesday the 30th of October, the euro closed down. Buyers tried to reverse the situation twice and both times were unsuccessful. The euro fell against the dollar to 1.1341. There were several factors which contributed to the weakening of the single currency.
1. The euro remains under pressure due to uncertainty around Italy. Italian bond yields rose this quarter against the background of weak GDP data in the country. The difference with the yields of similar German securities increased to 300 points. So far there’s no news with regard to any new budget plans.
2. US authorities are ready to introduce tariffs for the remaining imports from China by early December if new trade agreements are not reached, President Trump tweeted. US 10-year bonds shot up, and the dollar strengthened across the market.
16:45 US: Chicago Purchasing Managers’ Index (Oct).
17:30 US: EIA Crude Oil Stocks change (Oct 26).
Fig 1. EURUSD hourly chart
Current situations:
The reversal formation did not work. External factors turned out stronger than technical signals. The price returned to the low of the 26th of October. At the time of writing, the euro is trading at 1.1340.
In the Asian session, the US dollar is showing mixed dynamics with regard to other major currencies. The franc and the pound are trading up, while the others are trading in the red. Today, traders’ attention will be focused on retail sales in Germany and Eurozone inflation data. If stock indexes don’t fall, then their attention will switch to the BOE meeting on Thursday and the US labor market survey slated for Friday. The market will now begin preparing for these events.
What can we expect today?
The price is on a support. Taking into account external factors and the general strengthening of the dollar in light of growing 10-year US bond yields, I expect the pair to fall to the 90th degree (1.1309) and rebound to 1.1355.
The level of 1.1365 for me is a reference point. Now, the lb is at 1.1371. If we consider the time of the rebound, then we can expect to see the price at 1.1365. If there is a breakout, then our forecast for today won’t work. The 45th degree is at the top of the channel, which is built from lows. If they pass 1.1365 then this will serve as a target for buyers.
The clock is ticking on our expected bottom formation and now is the time for skilled traders to begin to position their trades for the remainder of 2018 and early 2019. We detailed why we believe the US equities markets have already, or are currently, hammering out a price bottom after the last few weeks downside price activity. In part one of this article, we illustrated how the US elections cycles are really more of a global geopolitical event and often drive price rotation in the months prior to these elections. Please take a minute to read Part 1 of this two-part research post if you have not already done so.
In this second part of our US election research post, we are going to continue to review topics that were previously discussed as well as highlight how certain market segments appear to be setting up for a massive price reversal. So, let’s get started.
Keeping in mind the information we presented in Part 1 of this research, our hypothesis is that US elections cycles present a huge opportunity for skilled traders by creating volatility and rotation in price and many segments of the global markets. Over the past 3+ years, we have been writing about what we call a “capital shift” that has been taking place. Near the end of the Obama presidency (2015 & 2016), a number of factors were taking place in the US and global economy. First, the start of the new Presidential Election cycle events was already working through the news cycles – the selection of the candidates. Second, China had recently instilled capital controls to prevent a capital outflow issue and to support their bulging economy locally. Lastly, emerging markets and oil had collapsed, putting incredible pressures on certain foreign markets to support their local economies and find suitable sources for their investments as currencies started to collapse as well.
This event, that actually started in 2014 or so, initiated what we call the “capital shift” where cash quickly moved out of risky investments and hunted for and deployed within safer investment structures – the US and major global equity markets. In particular, we believe the US Technology, healthcare and biotech sectors were huge beneficiaries of these new capital investments and we believe as these share prices started increasing, more and more capital kept flowing into these sectors – like a dog chasing his tail. The price advances seem to never end… until the 2016 election cycle event. This caused the entire global equities markets to pause for a few months as Hillary Clinton and Donald Trump battled it out.
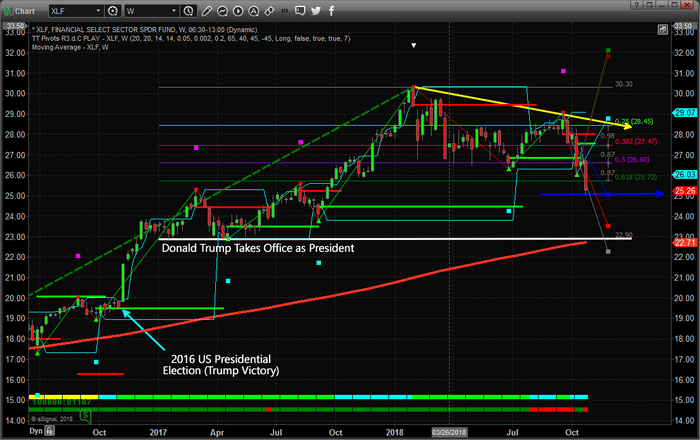
Within this Weekly XLF chart, you can see how quickly after the US presidential election the Financial Sector sprung back to life – rallying nearly 20% within the 6 weeks following the Trump victory. This is a massive move for investors and traders. Skilled traders know to watch for these setups within election cycle events and this is the one reason we are writing this article for you today – to keep you informed that massive trading opportunities exist over the next 3~6+ weeks.
You can also see from this chart that by the time President Trump was sworn into office, the XLF price rotated within a 12~15% range before the new Trump policies and objectives began to be announced (near October 2017). At that time, the Financial sector skyrocketed again by another 35~40% – reaching a peak near $30.60 in January 2018. Pay attention to what we are trying to suggest to you as skilled traders, we are about 7~10 days away from a US mid-term election that will likely present opportunities like this again and we want all of you to understand the huge potential for very big price swings that are setting up right now. The XLF is trading near $25.25 and any upside potential to near recent highs would reflect a 12~15% price increase (or more). Should this mid-term election result in increased fear in the markets and a related price downturn, the nearest support highlighted by the WHITE line on this chart would reflect a -9% price decrease. Either way, up or down, the potential for the Financial sector to generate big gain is already there – waiting for us to execute.
As we stated in Part 1, our predictive modeling systems have been suggesting that a major price bottom formation will setup sometime between November 8 and November 12 and that price will rally throughout the end of 2018 as the Santa Rally kicks into gear again. The recent GDP numbers support this outcome as the US economy is knocking out 3.5~3.8% levels every quarter.
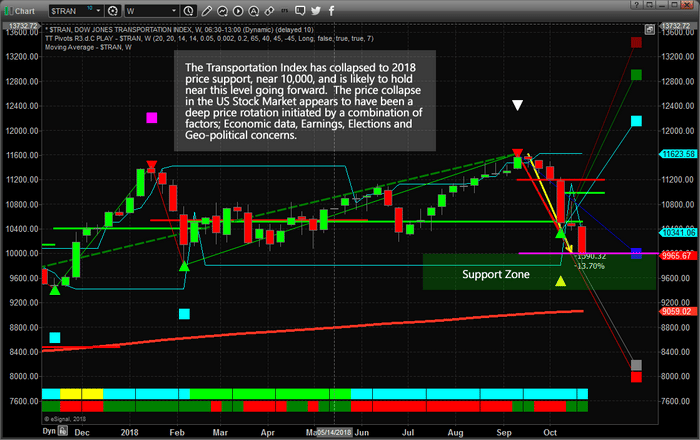
We found the move in the Transportation Index very interesting in terms of relative price analysis. The $TRAN index rotated lower to meet our expected 5~8% targets, then blew past those levels last week to drop to below our BLUE projected Fib extension level – then recover. The recent new low in the $TRAN will set up a new Fibonacci price bottom and will establish new upside price targets as the bottoms forms and price stalls headed into the mid-term elections. We know this will occur as Fibonacci price theory operates on price peaks and valleys and we expect a continued price bottom to form over the next 7 to 10 Daily trading sessions. Once this price low formation is established and confirmed, our price modeling systems will generate new upside projection levels that will help us understand how far and fast price will attempt to move higher.
Major election cycles happen every two years in the US and are real opportunities for skilled traders. The first rule is that you should be very cautious as major election events begin to unfold – such as major Presidential election cycles. Understand that these events can, and often do, sew fear and uncertainty into the markets and could be predicted by some very interesting price swings in commodities, foreign markets, currencies or equities. As the election cycle continues, prepare for the opportunities that will unfold and make sure you watch the commodities, like Gold, Silver, Oil and the US Dollar, for signs of contagion, capitulation, and fear. We believe our September 17th analysis of a price bottom setting up near or before November 12 is still the valid outcome of this election cycle and we believe there will be huge opportunities for skilled traders immediately after this US election event.
Be prepared and don’t miss this chance to really capture some great trading opportunities.
Our predictive modeling systems called this move nearly 4 weeks in advance and now they are calling for a bottom to set up near November 10th and a price rally to resume throughout the rest of 2018. If you want to find out how these incredible tools can help you find and execute better trades, then visit TheTechnicalTraders.com to learn more.
As Bitcoin celebrates its tenth anniversary and with the UK government’s Cryptoassets Taskforce releasing its final report, the cryptocurrency market is “unquestionably coming of age.”
This is the message from Nigel Green, founder and CEO of deVere Group, one of the world’s largest independent financial advisory organizations.
It comes as the original and still dominant digital currency reaches its milestone tenth year Wednesday.
Also, it follows the publication on Monday of a report into the crypto sector by the Cryptoassets Taskforce alongside the 2018 UK Budget documentation. The British Chancellor, Philip Hammond, created the Taskforce, which consists of HM Treasury, the Financial Conduct Authority and the Bank of England, in March 2018, with the aim of establishing a clear path to the establishment of the UK’s policy and regulatory approach to cryptoassets and blockchain, the technology that underpins them.
Mr Green comments: “Traditionalists who somehow still believe that cryptocurrencies are ‘just a fad’ could be compared to King Canute who is said to have attempted to command the tides of the sea to go back.
“It’s becoming increasingly clear that cryptocurrencies are the future of money.
“This is evidenced by Bitcoin, the world’s first cryptocurrency turning 10, and by more and more governments, regulators, financial institutions, and retail and institutional investors, amongst others, appreciating the real and growing demand for digital, global currencies in today’s ever more digitalized and globalized world.”
He continues: “This is also underscored by the UK government Cryptoassets Taskforce’s final report which states that ‘the market is continuing to evolve rapidly’, before adding ‘there is increasing institutional investment in this space, and many banks are starting to explore how they can interact with this growing market’.
“The report’s proactive and pragmatic approach towards regulation of the burgeoning sector should be championed.
“It is a sector in which there is a clear need for a robust international regulatory framework and ongoing supervision in order to further protect both retail and institutional investors, as well as to help tackle illicit activity.”
The Taskforce’s report affirms: “The government, the FCA and the Bank of England will continue to be actively involved in international efforts [on regulation], and the UK will be a thought leader in shaping future regulatory approaches.”
Last week, the deVere CEO noted in a media statement: “There’s an ongoing shift away from fiat money, and the momentum of this is only set to increase over the next 10 years.
“The pace of mass adoption will speed-up and the cryptocurrency market cap can reasonably be assumed to reach at least 5000 per cent above its current valuation over the next decade.”
Today the cryptocurrency market is worth more than $400 billion, meaning it could reach the $20 trillion mark by the deVere CEO’s prediction.
Mr Green concludes: “As Bitcoin moves into its second decade and as authorities globally seek to harness the enormous potential of cryptocurrencies, it’s clear the market is, unquestionably, coming of age.”
About:
deVere Group is one of the world’s largest independent advisors of specialist global financial solutions to international, local mass affluent, and high-net-worth clients. It has a network of more than 70 offices across the world, over 80,000 clients and $12bn under advisement.
Last week, we did an analysis of the AUDCHF pair. Now it’s time for its little brother: NZDCHF. The setup we have here is great for long-term investors as it is present on both the H4 and D1 charts. Our outlook on this instrument is positive.
Between August and the middle of October, the pair formed an inverse Head & Shoulders pattern. On the 15th of October, we got a breakout of the neckline (black), which gave us a buy signal. The NZDCHF pair listened and went higher. The beginning of last week brought us a bearish correction (red lines), which aimed at the neckline to test it as a closest support. The test was positive for buyers and the pair went higher. The correction formed a wedge and the new week has brought us a breakout of the upper line of this pattern, which is a legitimate signal to go long. That is the beauty of price action!
Positive sentiment here remains as long as we are above the yellow horizontal support. That gives us a lot of space for a bearish correction, but in my opinion, after today’s breakout, the price should mostly aim higher.
As we can see in the H4 chart, USDCAD has completed another slight pullback from the resistance level; right now, it is still forming Shooting Star, Harami, and Hanging Man reversal patterns. Judging by the previous movements, right now it may be assumed that the instrument may continue its ascending movement.
AUDUSD, “Australian Dollar vs US Dollar”
As we can see in the H4 chart, AUDUSD is still testing the support level and forming Engulfing, Hammer, and Inverted Hammer reversal patterns. Judging by the previous movements, it may be assumed that the instrument may complete the correction and then resume moving inside the uptrend.
Attention! Forecasts presented in this section only reflect the author’s private opinion and should not be considered as guidance for trading. RoboForex LP bears no responsibility for trading results based on trading recommendations described in these analytical reviews.