EURUSD has completed the ascending impulse and right now consolidating at its top. Today, the pair may start a new descending structure towards 1.1352 and then grow to reach 1.1385. After that, the instrument may start another decline with the short-term target at 1.1290. However, the price may choose an alternative scenario and continue the correction towards 1.1478.
BRENT
Brent has almost reached the target of the first descending wave. Possibly, today the price may grow towards 74.65 and then fall to reach 71.20, thus forming a new consolidation range. Later, the market may break it to the upside and start a new correction with the target at 80.37.
Attention! Forecasts presented in this section only reflect the author’s private opinion and should not be considered as guidance for trading. RoboForex LP bears no responsibility for trading results based on trading recommendations described in these analytical reviews.
Yesterday, the EUR/USD currency pair was defined by the aggressive purchases. The quotes have grown by almost 150 points. The USD weakened against the EUR after the publication of the weak economic stats. At the moment, the local support and resistance levels are 1.14100 and 1.14450 respectively. Positions should be opened from these levels. The trading instrument has a potential for further growth. The US Labour Market reports are in the spotlight.
The Economic News Feed for 02.11.2018:
– The Purchasing Managers’ Index (GER) – 10:55 (GMT+2:00);
– The various US Labour Market reports – 14:30 (GMT+2:00).
The price has fixed above 50 MA and 200 MA, which indicates the power of the buyers.
The MACD histogram is in the positive zone, but above the signal line, which gives a strong signal towards the purchase of EUR/USD.
The Stochastic Oscillator is in the overbought zone, the %K line has crossed the %D line. There are no signals at the moment.
Trading recommendations
Support levels: 1.14100, 1.13800, 1.13400
Resistance levels: 1.14450, 1.14700
If the price fixes above the resistance line 1.14450, we can expect further growth of the EUR/USD quotes. The movement tends towards the 1.15000.
Alternatively, the price will fix below 1.14100, which means you should look for the market entry points to open short positions. The movement will tend toward 1.13800-1.13500.
The GBP/USD currency pair
Technical indicators of the currency pair:
Prev Open: 1.27669
Open: 1.29981
% chg. over the last day: +1.86
Day’s range: 1.30222 – 1.30286
52 wk range: 1.2662 – 1.4378
The GBP/USD currency pair is also showing aggressive purchasing. During the yesterday’s and today’s trading, the quotes have grown by 250 points. The British pound strengthened against the USD after the news that Great Britain and the EU might reach an agreement on Brexit soon. At the moment, the key support and resistance levels are 1.29900 and 1.30450 respectively. The pound has the potential for further recovery.
The Economic News Feed for 02.11.2018:
– Construction Purchasing Managers’ Index (GB) – 11:30 (GMT+2:00).
The indicators show the power of the buyers: the price fixes above 50 MA and 200 MA.
The MACD histogram is in the positive zone, but below the signal line, which provides a weak signal towards the purchase of the GBP/USD.
The Stochastic Oscillator is in the overbought zone, the %K line is above the %D line, which indicates a bullish sentiment.
Trading recommendations
Support levels: 1.29900, 1.29400, 1.29000
Resistance levels: 1.30450, 1.30800
If the price fixes above the resistance line 1.30450, we can expect further growth of the GBP/USD currency pair. The movement will tend toward 1.30800-1.31000.
Alternatively, the GBP/USD quotes can fall toward 1.29500-1.29300.
The USD/CAD currency pair
Technical indicators of the currency pair:
Prev Open: 1.31565
Open: 1.30847
% chg. over the last day: -0.49
Day’s range: 1.31090 – 1.31256
52 wk range: 1.2248 – 1.3387
The USD/CAD currency pair is showing an active sell-off. During the yesterday’s and today’s trading, the quotes have fallen by more than 100 points. At the moment, the local support and resistance lines are 1.30500 and 1.30750 respectively. Positions should be opened from these levels. The trading instrument has a potential for further decline.
At 14:30 (GMT+2:00) we expect the Labour Market stats from Canada.
The indicators show the power of the sellers: the price is below 50 МА and 200 МА.
The MACD histogram is in the negative zone and below the signal line, which indicates a bearish mood.
The Stochastic Oscillator is in the overbought zone, the %K line started to cross the %D line. There are no signals at the moment.
Trading recommendations
Support levels: 1.30500, 1.30200, 1.30000
Resistance levels: 1.30750, 1.31000, 1.31300
If the price fixes above the support level of 1.30500, we can expect further growth of the USD/CAD quotes. The movement will potentially tend toward 1.30200-1.30000.
Alternatively, the currency pair can grow toward 1.31000-1.31300.
The USD/JPY currency pair
Technical indicators of the currency pair:
Prev Open: 112.855
Open: 112.648
% chg. over the last day: -0.19
Day’s range: 112.947 – 113.102
52 wk range: 104.56 – 114.74
The USD/JPY currency pair keeps showing an ambiguous technical picture. The trading instrument is consolidating while the investors are waiting for the additional drivers. At the moment, the local support and resistance levels are 112.800 and 113.100 respectively. Positions should be opened from these levels.
Today we expect no important news from Japan.
The indicators do not provide precise signals, the price went over 50 MA.
The MACD histogram is around 0. There are no signals.
The Stochastic Oscillator is in the neutral zone, the %K line went over the %D line. There are no precise signals.
Trading recommendations
Support levels: 112.800, 112.500, 112.200
Resistance levels: 113.100, 113.350
If the price fixes below the already mirror support of 112.750, the USD/JPY quotes are expected to decline. The movement is tending to 112.500-112.200.
An alternative may be the USD/JPY currency pair growth to 113.350-113.500.
The USD is weakened against the basked of other currencies due to the release of the weak economic data. For example, the number of the primary application for unemployment benefits reached 214K instead of the 213K. The Purchasing Managers’ Index by ISM lowered to 57.7 in October, while the experts were expecting 59.0. The USD index (#DX) retreated from the monthly minimums and closed in the negative zone (-0.84%).
The British pound strengthened against the USD after the news that the GB and the EU might finally reach an agreement on Brexit. The new treaty allows the British financial companies to keep working on the European markets after the Brexit is over. The GBP is also supported by the fact that the Bank of England decided to retain the key interest rate at 0.75% and hinted that it might raise further.
A Retail Sales report from Australia was published today, during the Asian trading session. The indicator reached 0.2% in September and turned out to be worse than the expected value of 0.3%. Today we also expect important economic stats from the EU, Great Britain, USA and Canada.
The prices on oil are consolidating. At the moment, the WTI futures are at 63.70 USD/barrel.
Market Indicators
Yesterday, the major US stock indices closed in the green: #SPY (+1,06%), #DIA (+1,01%), #QQQ (+1,32%).
The 10-year US government bonds yield is 3.15-3.16%.
The Economic News Feed for 02.11.2018:
– Purchasing Managers’ Index (GER) – 10:55 (GMT+2:00);
– Construction Purchasing Managers’ Index (GB) – 11:30 (GMT+2:00);
– Various Reports on the Labour Market (US) – 14:30 (GMT+2:00);
On Thursday the 1st of November, trading on the euro closed up 0.85% (+96 pips). The price kept this momentum during for three sessions. The euro rose against the US dollar amid partial profit taking in tandem with the British pound, as well as a significant weakening of the US dollar across the entire spectrum of the market due to falling bond yields and weak data on activity in the US manufacturing sector. Initially, the New Zealander and the pound caused the dollar to weaken. The remaining currencies have already followed suit.
The Bank of England noted that next year the rate could grow even faster if a trade agreement is reached on Brexit. According to BOE head Carney, a trade agreement is likely.
The ISM business activity index was 57.7 (forecast: 59.0; previous 59.8) for October. It increased pressure on the dollar, which grew during the Asian session.
Day’s news (GMT+3):
11:15 Switzerland: real retail sales (Sep).
11:45 France: Markit Manufacturing PMI (Oct).
11:55 Germany: Markit Manufacturing PMI (Oct).
12:00 Eurozone: Markit Manufacturing PMI (Oct).
12:30 UK: PMI construction (Oct).
15:30 Canada: unemployment rate (Oct), participation rate (Oct), net change in employment (Oct).
15:30 US: average hourly earnings (Oct), nonfarm payrolls (Oct), unemployment rate (Oct), labor force participation rate (Oct).
17:00 US: factory orders (Sep).
20:00 US: Baker Hughes US oil rig count.
Fig 1. EURUSD hourly chart.
Current situation:
Buyers got off to a good start to the month. There was a breakout of the trend line which pushed the price up from the A-A and B-B channels.
Today is nonfarm payrolls day. I won’t be making an intraday forecast today as the NFP indicator is unpredictable. If anyone is looking to trade before the report is released, then keep your eye on 1.1433 (112th degree) if you’re thinking of selling euros. If the price goes down immediately, then you can forget about the short position and quietly wait for the release of the US labor market report. I’m not expecting any growth since we are at around the 112th-135th degrees, which for me is a reversal zone.
The daily trend line is passing through 1.1457. Be on the lookout today. If the NFP report turns out to be higher than expected, the euro/dollar could fall to 1.1350 (67th degree) without even reaching the trend line.
A pioneering actively managed cryptocurrency solution has today been launched by one of the world’s largest independent financial advisory organizations.
deVere Group has founded the deVere Digital Asset Funds, a suite of digital currency solutions for experienced investors, in association with Dalma Capital Management Limited, a prominent hedge fund manager in the Dubai International Financial Centre.
It comes a day after Bitcoin, the world’s original digital currency, and still largest by market capitalization, reached its 10th anniversary.
Nigel Green, founder and CEO of deVere Group, comments: “Cryptocurrencies are now undeniably part of mainstream finance.
“Their momentum continues to gain traction as both retail and institutional investors increasingly value the need and demand for digital, global currencies in today’s ever-more digitalized and globalized world.
“The crypto market continues to expand considerably, with mass adoption on the horizon.
“These actively managed cryptocurrency solutions address growing demand by clients who want the potential associated benefits of exposure to the digital currency sector – which typically include portfolio diversification and decent returns – but with reduced volatility for which the market is known.”
He continues: “The deVere Digital Asset solution will invest in a diversified portfolio of digital assets via algorithmic trading over different platforms – including crypto-currency exchanges and OTC markets – as well as arbitrage opportunities.”
“Through a ground-breaking algorithmic system, when the price of one asset, for instance Bitcoin or Ethereum, is greater on one platform than on another, the opportunity is identified to generate profit from the difference of price across platforms. These trades, referred to as arbitrage, allow profits to be generated with little or no directional market risk.”
Zachary Cefaratti, CEO of Dalma Capital comments: “Crypto Asset Markets abound with durable inefficiencies – creating opportunities for hedge funds to generate uncorrelated excess returns through systematic relative value arbitrage, momentum trading and mean-reversion strategies.”
He adds: “Crypto Markets have created opportunities that we have not seen in conventional markets for decades. Arbitrage opportunities abound – the prices of the top 25 crypto assets vary across over 400 liquidity venues. The ability to trade long and short allows profit opportunities regardless of market direction.”
The deVere Digital Asset Platform is to be showcased at the forthcoming Alternative Investment Management (AIM) Summit taking place in Dubai on 26-27 November at the Ritz Carlton hotel.
Mr Green concludes: “We’re confident due to our custom-developed platform, which analyses market data and suggests rebalancing that’s best suited for the current market, will be a market leading investment solution in the digital currency space.
“The launch today of the deVere Digital Asset strategies underscores our ongoing commitment to reshaping and redefining the way financial services are delivered through fintech [financial technology], which we believe is a positive force for individuals, businesses and society.”
About:
deVere Group is one of the world’s largest independent advisors of specialist global financial solutions to international, local mass affluent, and high-net-worth clients. It has a network of more than 70 offices across the world, over 80,000 clients and $12bn under advisement.
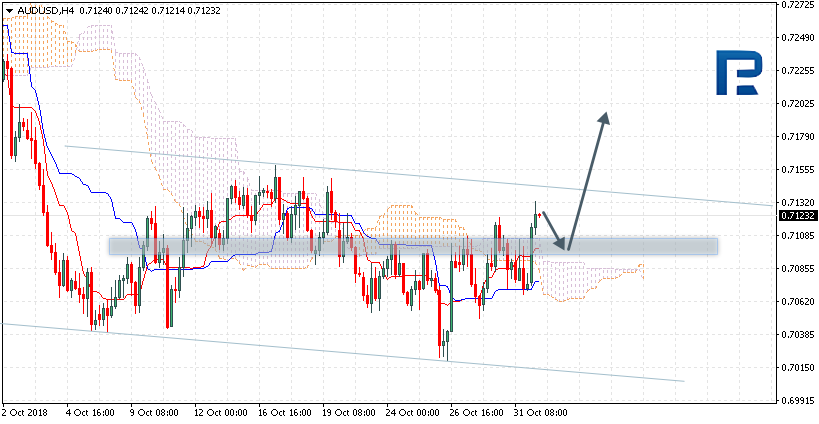
AUDUSD is trading at 0.7090; the instrument is moving above Ichimoku Cloud, thus indicating an ascending tendency. The markets could indicate that the price may test the upside border of the cloud at 0.7105 and then resume moving upwards to reach 0.7205. Another signal to confirm further ascending movement is the price’s rebounding from the support level. However, the scenario that Implies further growth may be cancelled if the price breaks the downside border of the cloud and fixes below 0.7030. In this case, the pair may continue falling towards 0.7010. After breaking the channel’s upside border and fixing above 0.7155, the price may continue moving upwards.
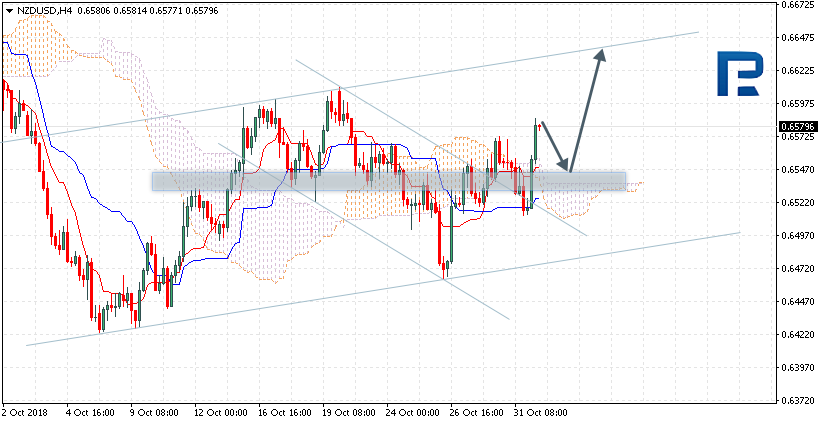
NZDUSD, “New Zealand Dollar vs US Dollar”
NZDUSD is trading at 0.6579; the instrument is moving above Ichimoku Cloud, thus indicating an ascending tendency. The markets could indicate that the price may test the upside border of the cloud at 0.6545 and then resume moving upwards to reach 0.6635. Another signal to confirm further ascending movement is the price’s rebounding from the support level. However, the scenario that Implies further growth may be cancelled if the price breaks the downside border of the cloud and fixes below 0.6490. In this case, the pair may continue falling towards 0.6405.
USDCAD, “US Dollar vs Canadian Dollar”
USDCAD is trading at 1.3144; the instrument is moving above Ichimoku Cloud, thus indicating an ascending tendency. The markets could indicate that the price may test the upside border of the cloud at 1.3110 and then continue moving upwards to reach 1.3255. Another signal to confirm further ascending movement is the price’s rebounding from the support level. However, the scenario that implies further growth may be cancelled if the price breaks the downside border of the cloud and fixes below 1.3025. In this case, the pair may continue falling towards 1.2935.
Attention! Forecasts presented in this section only reflect the author’s private opinion and should not be considered as guidance for trading. RoboForex LP bears no responsibility for trading results based on trading recommendations described in these analytical reviews.
In the H4 chart, USDCHF is expected to continue growing to reach the resistance at the 3/8 level.
In the H1 chart, USDCHF is trading above the 5/8 level and may continue trading upwards to reach the resistance at the 8/8 one.
As we can see in the M15 chart, the pair has broken the upside line of the VoltyChannel indicator and, as a result, may continue moving upwards.
XAUUSD, “Gold vs US Dollar”
As we can see in the H4 chart, XAUUSD is consolidating. In this case, the price may continue trading upwards to reach the resistance at the 5/8 level.
In the H1 chart, the pair is trading inside the “oversold zone”. In this case, the price may break the 0/8 level and continue growing towards the resistance at the 3/8 one.
In the M15 chart, the pair may break the upside line of the VoltyChannel indicator and, as a result, continue moving upwards.
Attention! Forecasts presented in this section only reflect the author’s private opinion and should not be considered as guidance for trading. RoboForex LP bears no responsibility for trading results based on trading recommendations described in these analytical reviews.
Yesterday, the EUR/USD currency pair fell slightly. At the moment, quotes have updated local highs and started to grow. Key support and resistance levels are: 1.13500 and 1.13800, respectively. Positions should be opened from these marks. Trading instrument has the potential for further growth.
The news feed on 01.11.2018:
– ISM manufacturing PMI in the US at 16:00 (GMT+2:00).
The price has fixed between 50 MA and 200 MA, which are dynamic support and resistance levels.
The MACD histogram has moved to the positive zone, which gives a signal to buy EUR/USD.
Stochastic Oscillator is in the overbought zone, the %K line has crossed the %D line. There are no signals.
Trading recommendations
Support levels: 1.13500, 1.13200, 1.30000
Resistance levels: 1.13800, 1.14100, 1.14400
If the price fixes below the local support level of 1.13500, the EUR/USD quotes are expected to decline. The movement is tending to 1.13200-1.13000.
Alternative option. If the price fixes above the resistance of 1.13800, it is necessary to look for entry points to the market to open long positions. The movement is tending to 1.14100-1.14400.
The GBP/USD currency pair
Technical indicators of the currency pair:
Prev Open: 1.27076
Open: 1.27669
% chg. over the last day: +0.47
Day’s range: 1.28720 – 1.29203
52 wk range: 1.2662 – 1.4378
There are aggressive purchases on the GBP/USD currency pair. During yesterday’s and today’s trading, the growth of quotes exceeded 200 points. Demand for the pound has grown significantly. According to The Times, London and Brussels reached a preliminary agreement in the field of financial services. At the moment, the key support and resistance levels are: 1.28700 and 1.29300, respectively. The trading instrument has the potential for further correction. We recommend opening positions from the key levels. Investors expect the Bank of England interest rate decision.
The news feed on 01.11.2018:
– The index of economic activity in the UK manufacturing sector at 11:30 (GMT+2:00);
– The Bank of England interest rate decision at 14:00 (GMT+2:00).
Indicators point to the power of buyers: the price has fixed above 50 MA and 200 MA.
The MACD histogram is in the positive zone, above the signal line, which gives a strong signal to buy GBP/USD.
Stochastic Oscillator is in the overbought zone, the %K line is crossing the %D line. There are no signals.
Trading recommendations
Support levels: 1.28700, 1.28300, 1.28000
Resistance levels: 1.29300, 1.29700
If the price fixes above the resistance level of 1.29300, further growth of the GBP/USD currency pair is expected. The movement is tending to 1.29700-1.30000.
An alternative may be a drop in the GBP/USD quotes to 1.28300-1.28000.
The USD/CAD currency pair
Technical indicators of the currency pair:
Prev Open: 1.31112
Open: 1.31565
% chg. over the last day: +0.40
Day’s range: 1.31090 – 1.31256
52 wk range: 1.2248 – 1.3387
Yesterday, Statistics Canada published a fairly optimistic report on the country’s GDP. Today, the USD/CAD currency pair has moved away from local highs and started to decline. At the moment, the local support and resistance levels are: 1.31000 and 1.31400, respectively. Positions should be opened from these marks. Trading instrument has the potential for further decline.
The news feed on the economy of Canada is calm.
Indicators do not give accurate signals: the price is being traded between 50 MA and 200 MA.
The MACD histogram has moved into the negative zone, which signals the bearish sentiment.
Stochastic Oscillator is in the oversold zone, the %K line has crossed the %D line. There are no accurate signals.
Trading recommendations
Support levels: 1.31000, 1.30700, 1.30400
Resistance levels: 1.31400, 1.31700
If the price fixes below the round level of 1.31000, a further drop in the USD/CAD quotes is expected. The movement is tending to 1.30700-1.30500.
An alternative may be the USD/CAD currency pair growth to the level of 1.31600-1.31800.
The USD/JPY currency pair
Technical indicators of the currency pair:
Prev Open: 113.076
Open: 112.855
% chg. over the last day: -0.20
Day’s range: 112.860 – 112.920
52 wk range: 104.56 – 114.74
The technical pattern on the USD/JPY currency pair is ambiguous. The trading instrument is in a sideways trend. Investors expect additional drivers. At the moment, local support and resistance levels are 112.750 and 113.100, respectively. Positions should be opened from these marks.
Today, the publication of important news from Japan is not expected.
Indicators do not send accurate signals: the price has fixed between 50 MA and 200 MA.
The MACD histogram is in the negative zone, but above the signal line, which gives a weak signal to sell USD/JPY.
Stochastic Oscillator is in the neutral zone, the %K line crossed the %D line. There are no signals.
Trading recommendations
Support levels: 112.750, 112.500, 112.200
Resistance levels: 113.100, 113.350
If the price fixes below the already mirror support of 112.750, the USD/JPY quotes are expected to decline. The movement is tending to 112.500-112.200.
An alternative may be the USD/JPY currency pair growth to 113.350-113.500.
On Wednesday the 31st of October, trading on the euro closed down by 0.28%. Pressure on the euro continues to stem from the uncertainty around the situation in Italy, as well as the general strengthening of the US dollar after the publication of positive data on the number of new jobs in the US private sector and the growth in 10-year US bond yields. The indicator exceeded market expectations.
Data from Automatic Data Processing (ADP) showed that the growth rate of employment in the US private sector accelerated in October. In October, the number of those employed increased by 227 thousand, compared to 218 thousand in September (it was revised from 230 thousand). The market expected that the number of those employed will grow by 189 thousand.
Our expectations for yesterday were fully justified; an increase to 1.1360, followed by a decrease to 1.1302. In Asia, the dollar has fallen in value against all currencies. The market driver for today was the New Zealander, which was then followed by the Australian dollar and the pound.
There were rumours across the market that the RBNZ would not lower rates, but rather take a pause. In the second quarter of 2018, New Zealand’s economy grew by 1.10% QoQ, which was the fastest pace in two years. After the publication of this data, there was talk that the Central Bank could once again lower rates.
The Briton is growing on statements from the UK’s main Brexit negotiator Dominic Raab. He expects an agreement on Brexit on the 21st of November. Because of this, the euro/pound cross pair slipped.
The key event for the pound will be the BOE meeting. A rate increase isn’t expected, so special attention will be paid to the results of the voting and Mark Carney’s press conference. Events in the UK will affect the euro/dollar cross via the euro/pound cross pair.
According to the forecast, I am waiting for a drop to 1.1309, but there is the risk that we will not pass through 1.1330. There was a breakout of the trend line. Buyers have rested on the upper border of the B-B channel. Since the stochastic is on top, I’ll wait for it to fall at the start of the European session. We’ll have a better idea then. Keep in mind that it is more difficult to turn the market around whilst the situation in Italy is still ongoing. Sellers drive the price for a couple of hours to 1.1309, and even reach new all-time lows. Selling euros is safer than buying and in order to buy, we should first pass 1.1360.