As we can see in the H4 chart, after reaching the retracement of 50.0%, XAUUSD has formed a new ascending impulse. The next upside target may be the high at 1243.41. If the price breaks it, the instrument may continue growing towards the post-correctional extension area between the retracements of 138.2% and 161.8% at 1255.50 and 1262.49 respectively. The support level is the retracement of 23.6% at 1208.50.
In the H1 chart, the pair is trading upwards. The closest upside target is the high at 1243.41.
USDCHF, “US Dollar vs Swiss Franc”
As we can see in the H4 chart, the divergence made USDCHF reverse and start a new correction, which has reached the retracement of 23.6%. The next downside targets may be the retracements of 38.2% and 50.0% at 0.9883 and 0.9818 respectively. The key resistance level is the high at 1.0095.
In the H1 chart, the pair has been corrected by 61.8%. If the price breaks the high, the instrument may continue growing towards the post-correctional extension area between the retracements of 138.2% and 161.8% at 1.0143 and 1.0173 respectively.
Attention! Forecasts presented in this section only reflect the author’s private opinion and should not be considered as guidance for trading. RoboForex LP bears no responsibility for trading results based on trading recommendations described in these analytical reviews.
EURUSD has completed another descending impulse and right now consolidating. Today, the pair may continue falling towards 1.1342 and then grow to reach 1.1396. After that, the instrument may start another decline with the short-term target of the fifth descending wave at 1.1290.
USDCHF, “US Dollar vs Swiss Franc”
USDCHF has finished the ascending impulse and right now is consolidating at the top. Possibly, today the price may break 1.0042 upwards. The target is at 1.0121. Later, the market may resume falling to return to 1.0042.
USDJPY, “US Dollar vs Japanese Yen”
USDJPY has completed the consolidation range below 113.10 and right now is trading to break this level upwards. Possibly, the price may form one more ascending structure towards 113.59 and then resume falling to return to 113.10. After that, the instrument may start another growth with the target at 113.76 (an alternative scenario). According to the main scenario, the pair is expected to continue trading inside the downtrend with the target at 111.00.
AUDUSD, “Australian Dollar vs US Dollar”
AUDUSD has finished the descending impulse and right now is consolidating. Possibly, the price may fall to reach 0.7173 and then start another growth towards 0.7214. Later, the market may resume trading inside the downtrend with the short-term target at 0.7132.
USDRUB, “US Dollar vs Russian Ruble”
USDRUB is trading to break 65.93 upwards. Possibly, the price may continue growing to reach 66.40 and then resume falling with the short-term target at 63.93.
Attention! Forecasts presented in this section only reflect the author’s private opinion and should not be considered as guidance for trading. RoboForex LP bears no responsibility for trading results based on trading recommendations described in these analytical reviews.
On Friday, November 2, trading on currency majors was very active. The US have published a rather optimistic report on the labor market for October. The dollar index (#DX) closed in the positive zone (+0.27%). Demand for the US currency is still high. At the moment, the EUR/USD quotes are consolidating in the range of 1.13750-1.14000. We recommend opening positions from these marks.
The news feed on 05.11.2018:
At 17:00 (GMT+2:00) the ISM non-manufacturing PMI will be published.
Indicators do not send accurate signals: the price has crossed 50 MA and 200 MA.
The MACD histogram is close to the 0 mark.
Stochastic Oscillator is in the neutral zone, the %K line is above the %D line, which indicates the bullish sentiment.
Trading recommendations
Support levels: 1.13750, 1.13400, 1.13100
Resistance levels: 1.14000, 1.14250, 1.14500
If the price fixes above the round level of 1.14000, the EUR/USD quotes are expected to grow. The movement is tending to 1.14250-1.14500.
Alternative option. If the price fixes below 1.13750, it is necessary to look for entry points to the market to open short positions. The movement is tending to 1.13400-1.13100.
The GBP/USD currency pair
Technical indicators of the currency pair:
Prev Open: 1.29981
Open: 1.30215
% chg. over the last day: -0.29
Day’s range: 1.29835 – 1.30247
52 wk range: 1.2662 – 1.4378
The GBP/USD currency pair is in a sideways trend after a sharp rise last week. At the moment, quotes are testing local support and resistance levels: 1.29800 and 1.30300, respectively. The trading instrument has the potential for further growth. We recommend following the current information regarding the Brexit process.
At 11:30 (GMT+2:00) the index of economic activity in the UK services sector will be published.
Indicators do not send accurate signals: the price is testing 50 MA.
The MACD histogram is in the positive zone, but below the signal line, which gives a weak signal to buy GBP/USD.
Stochastic Oscillator is in the neutral zone, the %K line is above the %D line, which indicates the bullish sentiment.
Trading recommendations
Support levels: 1.29800, 1.29500, 1.29100
Resistance levels: 1.30300, 1.30750
If the price fixes above the resistance level of 1.30300, a further increase in the GBP/USD currency pair is expected. The movement is tending to 1.30600-1.30800.
An alternative may be a drop in the GBP/USD quotes to 1.29500-1.29200.
The USD/CAD currency pair
Technical indicators of the currency pair:
Prev Open: 1.30847
Open: 1.30879
% chg. over the last day: +0.17
Day’s range: 1.30778 – 1.31127
52 wk range: 1.2248 – 1.3387
The technical pattern on the USD/CAD currency pair is ambiguous. At the moment, USD/CAD quotes are consolidating. Investors expect additional drivers. Local support and resistance levels are 1.30850 and 1.31200, respectively. Positions should be opened from these marks.
Today, the publication of important economic reports from Canada is not planned. We recommend paying attention to the speech by the Bank of Canada governor.
Indicators do not send accurate signals: 50 MA has crossed 200 MA.
The MACD histogram is in the positive zone, but below the signal line, which gives a weak signal to buy USD/CAD.
Stochastic Oscillator is in the neutral zone, the %K line is below the %D line, which indicates the bearish sentiment.
Trading recommendations
Support levels: 1.30850, 1.30500, 1.30200
Resistance levels: 1.31200, 1.31450, 1.31700
If the price fixes below the support of 1.30850, the USD/CAD quotes are expected to fall. The movement is tending to 1.30500-1.30300.
An alternative may be the growth of the USD/CAD currency pair to the level of 1.31450-1.31700.
The USD/JPY currency pair
Technical indicators of the currency pair:
Prev Open: 112.648
Open: 113.148
% chg. over the last day: +0.43
Day’s range: 113.108 – 113.337
52 wk range: 104.56 – 114.74
The USD/JPY currency pair is still in a sideways trend. The unidirectional trend is not observed. At the moment, the USD/JPY quotes are consolidating near the key resistance of 113.350. The round level of 113.000 is already a “mirror” support. We recommend paying attention to the US government bonds yield. Positions should be opened from the key levels.
The news feed on the economy of Japan is quite calm.
The price has fixed above 50 MA and 200 MA, which indicates the power of buyers.
The MACD histogram is in the positive zone, but below the signal line, which gives a weak signal to buy USD/JPY.
Stochastic Oscillator is in the neutral zone, the %K line is below the %D line, which indicates the bearish sentiment.
Trading recommendations
Support levels: 113.000, 112.650, 112.350
Resistance levels: 113.350, 113.700
If the price fixes above the resistance level of 113.350, the USD/JPY quotes growth is expected. The movement is tending to 113.700-114.000.
An alternative may be a decrease in the USD/JPY currency pair to 112.700-112.500.
On Friday, the US dollar strengthened against a basket of major currencies after the publication of strong labor market data for October. Thus, the number of people employed in the nonfarm sector increased to 250K instead of the forecasted value of 193K. The growth of average hourly earnings met market expectations and counted to 0.2% (m/m). The unemployment rate was 3.7%, as investors expected. The US dollar index (#DX) closed in the positive zone (+0.27%).
Also, the news that the United States and China could resume negotiations on ending the trade war between the countries affected investors’ sentiment. The US President, Donald Trump, met with the President of the People’s Republic of China, Xi Jinping, to discuss trade issues. The US President is positive and hopes that the conflict will soon be settled.
A number of events will take place this week that will affect the future alignment of forces on currency majors. So, tomorrow there will be elections of representatives to the US Congress. In addition, state and territory governors will be selected. Investors expect meetings of the central banks of Australia, New Zealand, and the US.
The “black gold” prices are falling. At the moment, futures for the WTI crude oil are testing a mark of $62.80 per barrel.
Market Indicators
On Friday, the main US stock indices closed in the negative zone: #SPY (-0.59%), #DIA (-0.50%), #QQQ (-1.56%).
At the moment, the 10-year US government bonds yield is at the level of 3.19-3.20%.
The news feed on 05.11.2018:
– The index of economic activity in the UK services sector at 11:30 (GMT+2:00); – ISM non-manufacturing PMI at 17:00 (GMT+2:00).
On Friday the 2nd of November, trading on the EURUSD closed down. After the publication of the US labor market data buyers lost all their daily gains. The number of new jobs exceeded expectations, and the value for the previous month has been revised upwards. The index of average hourly earnings (YoY) reached a 9-year high. Unemployment in the US remains at 3.7%.
US factory orders and the growth of US 10-year bond yields, which rose to 3.22%, served as good news to sellers.
The euro fell to 1.1372 on expectations of another rate hike in December. According to the latest data by CME Group’s FedWatch, the likelihood of a rate hike in the US in December is 77.5%. Before the payrolls data was published this amounted to 74.5%.
Net change in unemployment in Canada: +11.2k (forecast: +25.0k; previous: +63.3k).
Unemployment in Canada (Oct.): 5.8% (forecast: 5.9%; previous: 5.9%).
US trade balance (Sep): -54.0 (forecast: -53.6; previous reading revised from -53.2 to -53.3).
US nonfarm payrolls (Oct): 250k (forecast: 190k; previous reading revised from 134k to 118k).
US unemployment rate (Oct): 3.7% (forecast: 3.7%; previous: 3.7%).
US average hourly earnings (Oct): +0.2% (forecast: +0.3%; previous: +0.3%).
Day’s news (GMT+3):
12:30 UK: Markit services PMI (Oct).
16:10 Canada: BOC Governor Poloz Speech.
17:45 US: Markit services (Oct).
18:00 US: ISM non-manufacturing PMI (Oct).
Fig 1. EURUSD hourly chart
Current situation:
The euro crashed by 67 degrees to 1.1456. This is approximately 50% of the upwards movement from 1.1302 to 1.1456. The labor market report has come out. You can forget about it for the month. You can even forget that it came out of Friday, and the price fell 70 pips on this news.
The 67th degree and the balance line acted as a support. At the time of writing, the euro is at 1.1390. Given that there is not much in terms of news going on in Europe at the moment, on Monday, I am waiting for the price to recover to 1.1422.
I took a look back to find movements similar to those we saw last week. Believe it or not, in light of Friday’s dip there is a chance that the fall could be blocked. Here I did not consider the day of the week as I was limited to the 45th degree. If my estimates are correct, then sellers are looking at 1.1330.
A lot of excitement around movements in the AUD at the end of last Friday and over the weekend. It looks interesting and appears to be a technical movement brought on by the trade balance on Thursday. I remain strong in the view the USD come December 2019 will be higher still, but cannot ignore short-term opportunities.
The technical – AUD breakouts
• AUDUSD – Has tested this downtrend channel several times in the past year but has never closed above it. Friday finally saw a break and close above the trendline – the risk is the Midterms and the CNH fixing but it’s an interesting development. • EURAUD – Broke below the 200-day moving average. EUR has eased off in recent weeks as periphery states have produced weak economic data while Australia’s trade balance boomed. Again the risk here is the Midterms. • AUDCAD – Also broke out, as oil moderated. This cross is risky: oil, the midterm and EM all shift AUDCAD around and swiftly – stops are a must. Will be interesting to see if these break are more structural, I haven’t seen enough economic data yet that would confirm this which is why the RBA’s outlook is key.
The Economics
• There will be no move from Martin Place on Melbourne Cup day however there is a sense it could ‘set up’ it’s views of 2019 and 2020 on Tuesday as after the December meeting the RBA is on its summer break until the first Tuesday of February, which has a very large timeframe considering Asia (especially China) tends to change its policy during this time.
• The 5 keys to 2019 and 2020
o Funding – the cost of capital is eating into residential housing, personal lending and the consumption of credit. The RBA will be aware that further increases in global cash markets will come home to roost in Australia which is likely to put pressure on rate calls the downside. AUD weakener
o House prices – a lower wealth effect’ will filtering into a growth figures. Will this lead to macro-prudential tweaks that were originally brought into curb housing market in 2019 and 2020?
o Inflation – 16 consecutive and counting below its target 2% to 3% band. This should create a scenario where cuts are discussed, yet is maintaining a slight hike stance.
o Employment – booming part of the economy. However, the RBA still sees slack as being a thorn in the side of wage growth, part of its charter is to support employment which it can’t do as employment growth strong – tough one.
o GDP, can private investment remain an addition to GDP or will it slide back to a subtraction in 2019? This is a China question. Watch the CNY. And, will consumption the largest contributor to GDP slide as wealth declines and wage growth remains anaemic? The RBA clearly thinks not its forecasted GDP to hold at 3.25% come December 2019.
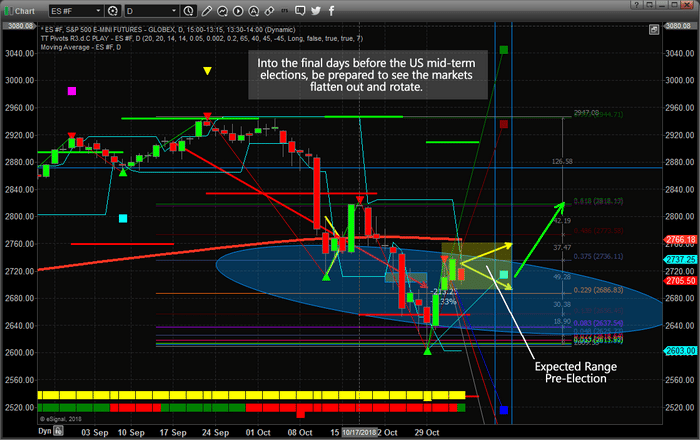
With very strong US jobs data hitting the news wires this morning and an incredible upside price swing overnight because of expectations and hope of a US/China trade deal in the works, we were not surprised by the downside rotation in the US stock market this morning. As we’ve been warning for the past 3+ months, we expect the US stock markets to trade very narrowly headed into the US mid-term elections and begin a breakout upside price move sometime between November 8 and November 12.
The news events, recently, and the relatively strong earnings data suggest the US stock market and economy should continue an upward bias throughout most of the end of 2018 and into early 2019. If President Trump were to secure a favorable trade deal with China, we expect the US stock market could surge 4~8% over a few days/weeks on that news alone. Our opinion is that few traders want to hold any positions over the weekend headed into a potentially tumultuous election cycle next week.
This Daily ES chart illustrates where we believe the price will stay before the US elections (The YELLOW arrows/box drawn on the chart). This range is roughly from 2690 to 2750 on the ES. We’ve also drawn two thin blue vertical lines that represent Nov 8 and Nov 12 – the dates which we expect the markets to establish a true price bottom and begin an upward price rally from. Additionally, we are displaying what we call “True Fibonacci Levels” on this chart in reference to key price target levels. We believe the initial upside price target will focus on the 2816 price level in the ES, then potentially push higher to the 2942 range. These True Fibonacci Levels are derived from our modeling systems calculations of Fibonacci Number Sequence relationships.
Additionally, the October 12th date aligns with Fibonacci Time/Price cycles as a key inflection point in price. Therefore, we strongly believe skilled traders should begin taking strategic positions in select markets/stocks prior to this point as we believe the price could move in a very dramatic and aggressive form after November 12th.
Please take a minute to visit our website to learn how we can help you stay ahead of these market moves. Visit TheTechnicalTraders.com and see just how easy and inexpensive it is to have a team of dedicated professionals working to help you become a better trader and deliver proprietary research, daily videos and more.
If you’ve been following our research, you already know how accurately we’ve called these past market moves. Pay attention to how the rest of this year plays out and see how accurate our predictions really are. We’ve called the moves in Oil, Gold, Technology, China/Asia, the US stock market and many more weeks or months before these moves happened. Isn’t it time you invested in your future success too?
US Dollar Index speculator positions continued higher this week
Large currency speculators continued to boost their bullish bets in favor of US Dollar Index futures once again this week while cutting back on their bullish Mexican peso positions, according to the latest Commitment of Traders (COT) data released by the Commodity Futures Trading Commission (CFTC) on Friday. See full article
The non-commercial contracts of WTI crude futures totaled a net position of 432,638 contracts, according to data from this week. This was a slide of -22,640 contracts from the previous weekly total. See full article
The large speculator contracts of gold futures totaled a net position of 13,194 contracts. This was a weekly decline of -16,194 contracts from the previous week. See full article
The large speculator contracts of 10-year treasury note futures totaled a net position of -502,839 contracts. This was a weekly increase of 41,194 contracts from the previous week. See full article
The large speculator contracts of S&P500 Mini futures totaled a net position of 263,008 contracts. This was a rise of 23,636 contracts from the reported data of the previous week. See full article
The non-commercial contracts of silver futures totaled a net position of -8,470 contracts, according to data from this week. This was a weekly fall of -3,291 contracts from the previous totals. See full article
The large speculator contracts of copper futures totaled a net position of 667 contracts. This was a weekly shortfall of -8,680 contracts from the data of the previous week. See full article
The Commitment of Traders report data is published in raw form every Friday by the Commodity Futures Trading Commission (CFTC) and shows the futures positions of market participants as of the previous Tuesday (data is reported 3 days behind).
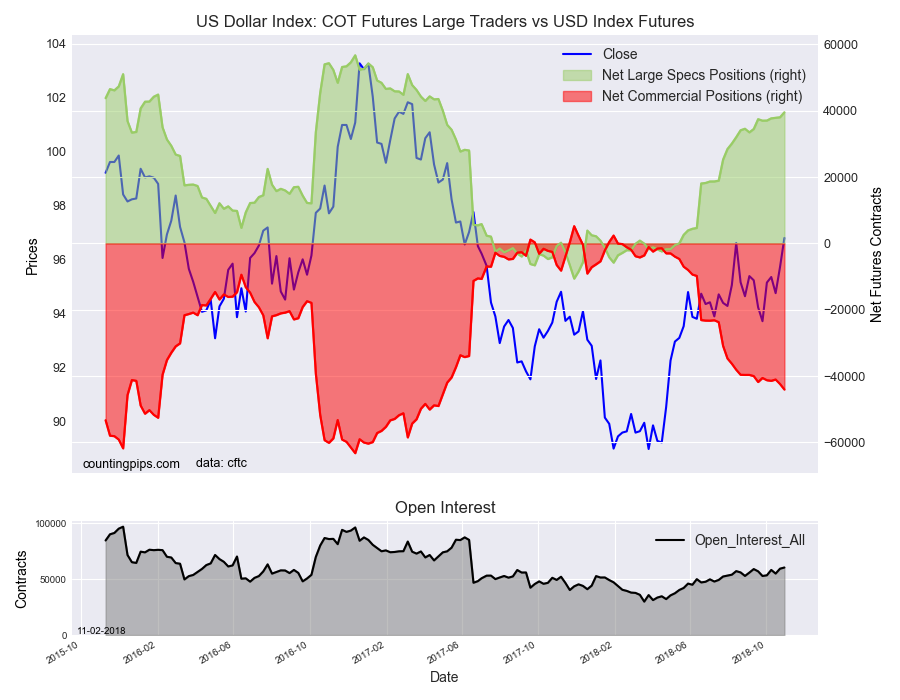
US Dollar Index speculator positions continued higher this week
Large currency speculators continued to boost their bullish bets in favor of US Dollar Index futures once again this week while cutting back on their bullish Mexican peso positions, according to the latest Commitment of Traders (COT) data released by the Commodity Futures Trading Commission (CFTC) on Friday.
The non-commercial futures contracts of US Dollar Index futures, traded by large speculators and hedge funds, totaled a net position of 39,523 contracts in the data reported through Tuesday October 30th. This was a weekly advance of 1,495 contracts from the previous week which had a total of 38,028 net contracts.
The speculative Dollar Index position has now risen for five straight weeks and is on an amazing run with gains in twenty-six out of the last twenty-eight weeks. The current standing remains at the highest level since May 2nd of 2017 when the net position totaled 40,020 contracts.
Individual Currencies Data this week:
In the other major currency contracts data, we saw just one substantial change (+ or – 10,000 contracts) in the speculators category this week.
The Mexican peso contract fell sharply by over -20,000 contracts this week and has fallen lower for three straight weeks. Despite these recent shortfalls, the peso has fared better than many of the other major currencies as the MXN has remained in an overall bullish position for eighteen weeks in a row. The current standing is above the +30,000 contract level for a seventh straight week.
Overall, the major currencies that improved this week were the US Dollar Index (1,495 weekly change in contracts), the Japanese yen (1,184 contracts) and the Swiss franc (2,583 contracts).
The currencies whose speculative bets declined this week were the euro (-2,358 weekly change in contracts), British pound sterling (-5,485 contracts), Canadian dollar (-2,427 contracts), Australian dollar (-44 contracts), New Zealand dollar (-1,983 contracts) and the Mexican peso (-24,218 contracts).
Other Notables for the week:
Euro positions continued to get battered and bruised this week and fell for the fifth straight week. The current standing remains at the most bearish level since March 14th of 2017 when net positions totaled -41,027 contracts.
New Zealand dollar positions declined againt this week (-1,983 weekly change in contracts) and are right near the record high bearish level of two weeks ago (-35,412 contracts). The NZD remains above the -30,000 contract level for a seventh week in a row.
See the table and individual currency charts below.
Table of Weekly Commercial Traders and Speculators Levels & Changes:
Currency
Net Commercials
Comms Weekly Chg
Net Speculators
Specs Weekly Chg
EuroFx
14,605
2,760
-32,662
-2,358
GBP
72,170
5,641
-52,482
-5,485
JPY
107,462
-5,688
-91,620
1,184
CHF
34,852
-756
-14,522
2,583
CAD
8,472
314
-9,655
-2,427
AUD
93,402
3,470
-70,412
-44
NZD
39,098
1,826
-35,031
-1,983
MXN
-35,418
26,351
33,809
-24,218
This latest COT data is through Tuesday and shows a quick view of how large speculators or non-commercials (for-profit traders) as well as the commercial traders (hedgers & traders for business purposes) were positioned in the futures markets. All currency positions are in direct relation to the US dollar where, for example, a bet for the euro is a bet that the euro will rise versus the dollar while a bet against the euro will be a bet that the dollar will gain versus the euro.
Weekly Charts: Large Trader Weekly Positions vs Price
EuroFX:
British Pound Sterling:
Japanese Yen:
Swiss Franc:
Canadian Dollar:
Australian Dollar:
New Zealand Dollar:
Mexican Peso:
*COT Report: The weekly commitment of traders report summarizes the total trader positions for open contracts in the futures trading markets. The CFTC categorizes trader positions according to commercial hedgers (traders who use futures contracts for hedging as part of the business), non-commercials (large traders who speculate to realize trading profits) and nonreportable traders (usually small traders/speculators). Find CFTC criteria here: (http://www.cftc.gov/MarketReports/CommitmentsofTraders/ExplanatoryNotes/index.htm).
The Commitment of Traders report is published every Friday by the Commodity Futures Trading Commission (CFTC) and shows futures positions data that was reported as of the previous Tuesday (3 days behind).
Each currency contract is a quote for that currency directly against the U.S. dollar, a net short amount of contracts means that more speculators are betting that currency to fall against the dollar and a net long position expect that currency to rise versus the dollar.
(The charts overlay the forex closing price of each Tuesday when COT trader positions are reported for each corresponding spot currency pair.) See more information and explanation on the weekly COT report from the CFTC website.
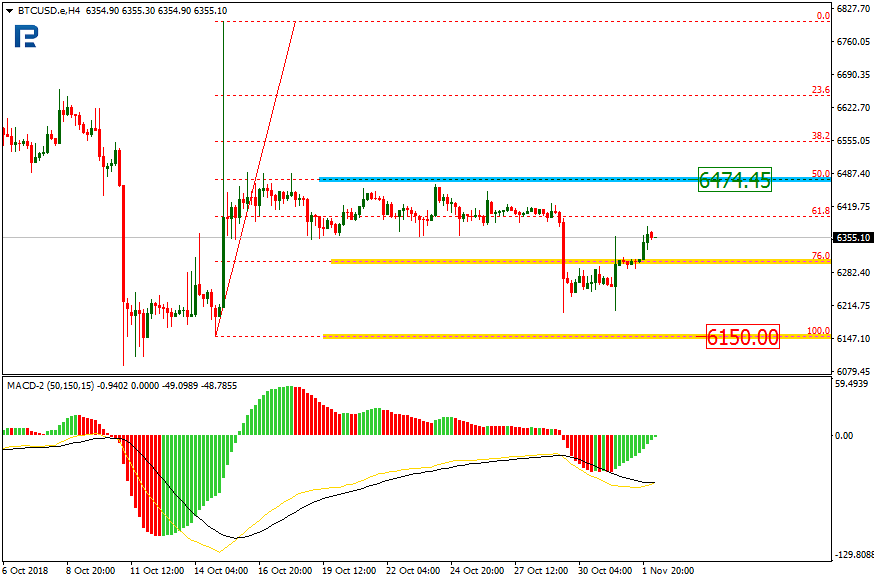
As we can see in the H4 chart, the correctional trend has passed the retracement of 76.0%. The previous correctional descending impulse couldn’t break the key support at 6150.00. The current rising movement may be considered as a continuation of the correction with an expansion. The upside target is the retracement of 50.0% at 6474.45.
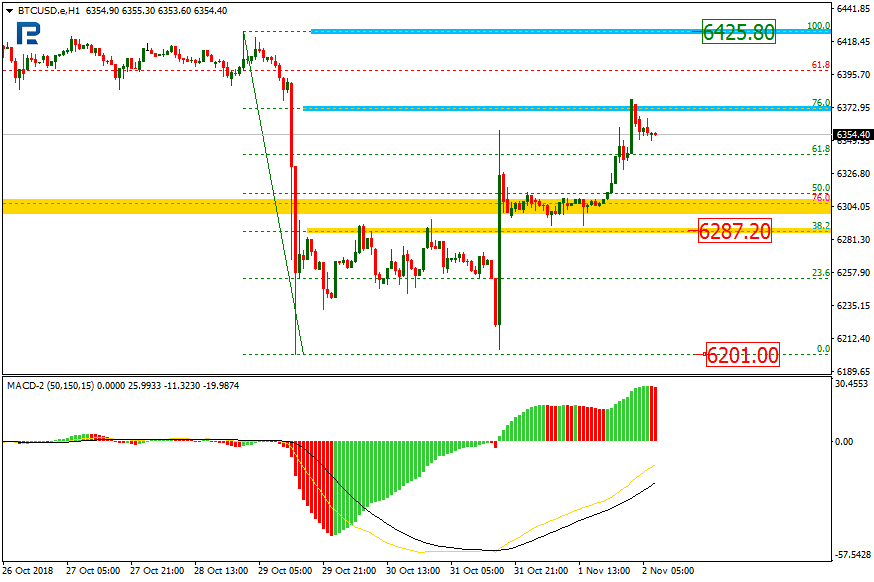
As we can see in the H1 chart, the pair has reached the retracement of 76.0%. The next upside target may be the resistance level at 6425.80. After finishing this ascending movement, the instrument is expected to fall towards the support level, which is the retracement of 38.2% at 6287.20.
ETHUSD, “Ethereum vs. US Dollar”
As we can see in the H4 chart, ETHUSD is being corrected between the low at 189.24 and the retracement of 50.0% at 204.43. If the instrument breaks the low, the price may continue falling towards the post-correctional extension area between the retracements of 138.2% and 161.8% at 177.75 and 170.66 respectively.
In the H1 chart, the uptrend is getting closer to the retracement of 76.0%.
Attention! Forecasts presented in this section only reflect the author’s private opinion and should not be considered as guidance for trading. RoboForex LP bears no responsibility for trading results based on trading recommendations described in these analytical reviews.