On Tuesday, November 6th, the British Pound remains strong against the USD. The key driver for the British currency is still the same as before – the Brexit negotiations. Nevertheless, the statistics matter as well, that’s why any progress in the Brexit talks and enthusiasm that accompanies it is somehow eliminated by weak macroeconomic readings that come from the United Kingdom.
It became known yesterday that the British government continued discussing the Irish border issue, which was believed as one of the most important things that prevented the parties from making progress in the talks.
The statistics published by the United Kingdom early in the week were not too positive. The Services PMI dropped up to 52.2 points in October after being 53.9 points in the previous month and against the expected reading of 53.4 points. The actual reading is the weakest since March, although it’s still higher than the psychologically-crucial level of 50 points, which usually marks decline and growth.
On one hand, the British economy is looking pretty strong right now and there are reasons to expect the GDP to continue improving. On the other hand, businesses and investors are still concerned about the economic uncertainty and lack of new orders.
This week, there will be a lot of numbers from the United Kingdom, which may really influence the Pound behavior. Some of them worth paying attention to are the preliminary GDP report and the Industrial Production reading to be published on Friday.
As we can see in the H1 chart right now, GBPUSD is testing the support line of the ascending channel. At the same time, there is a divergence in MACD, which may indicate a possible correction soon. If the pair breaks the support line, it may move downwards into the projected channel. The downside targets may be the retracements of 23.6%, 38.2%, and 50.0% at 1.2993, 1.2935, and 1.2889 respectively. After completing the correction, the instrument may start a new rising impulse. The target is the current high at 1.3257.
Author: Dmitriy Gurkovskiy, Chief Analyst at RoboForex
Disclaimer
Any predictions contained herein are based on the authors’ particular opinion. This analysis shall not be treated as trading advice. RoboForex shall not be held liable for the results of the trades arising from relying upon trading recommendations and reviews contained herein.
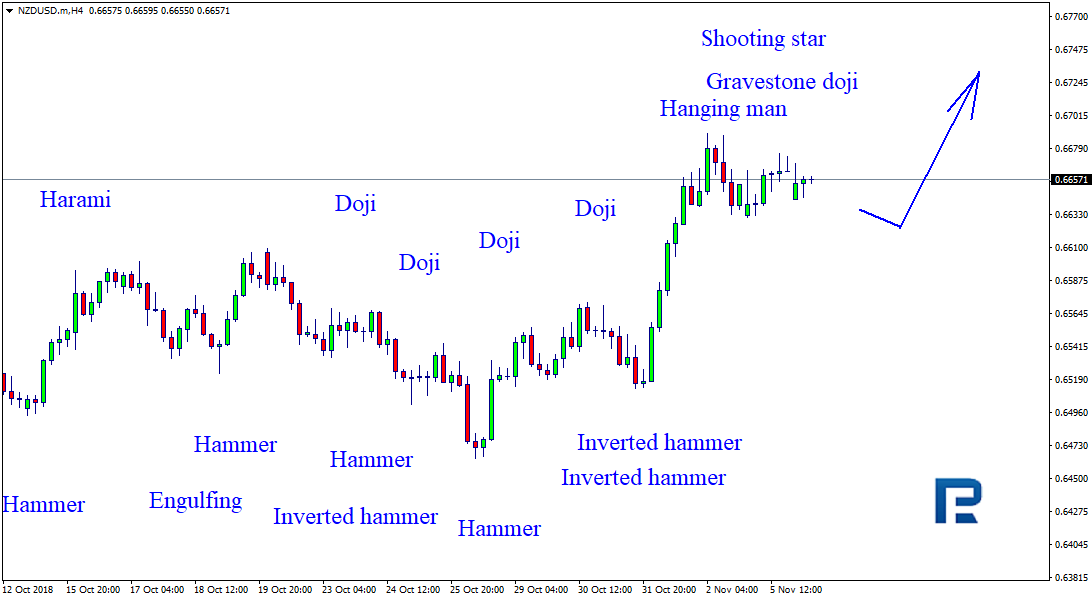
As we can see in the H4 chart, XAUUSD is forming another correction from the resistance level with Doji, Shooting Star, and Hanging Man reversal patterns. Judging by the previous movements, it may be assumed that after finishing the correction the instrument may continue its ascending movement.
NZDUSD, “New Zealand vs. US Dollar”
As we can see in the H4 chart, NZDUSD has reached the resistance level and formed Hanging Man, Gravestone Doji, and Shooting Star reversal patterns. Right now, the price is being corrected from the resistance level again. Judging by the previous movements, it may be assumed that the instrument may complete the pullback, break the resistance level, and then continue its growth.
Attention! Forecasts presented in this section only reflect the author’s private opinion and should not be considered as guidance for trading. RoboForex LP bears no responsibility for trading results based on trading recommendations described in these analytical reviews.
This week we will start by analysing WTI Oil, which was previously mentioned here on Friday. Has much changed since then? Not really, but we would like to describe the current situation in greater detail.
The mid-term chart here is beautiful and the price has created a good-looking downtrend. Why is it beautiful? Because it has been around since the 3rd of October, and the price has been moving very technically ever since. Traders have been following the main downtrend (red) with great precision. What is more, every single correction so far (blue) has been a technical pattern! First, we had a pennant, then a rectangle and a flag. The last one, and also the smallest one, was a flag too. All of them ended in the breakouts of the lower lines. On Thursday, WTI managed to break the horizontal support at 64 USD/bbl (green, important in June and August). On Friday, sellers managed to break the 38.2% Fibonacci.
All of this negative sentiment is keeping the sell signal alive. Monday started with a small rise but this is not technically significant. Negative sentiment will remain intact as long as we stay below the green and red lines.
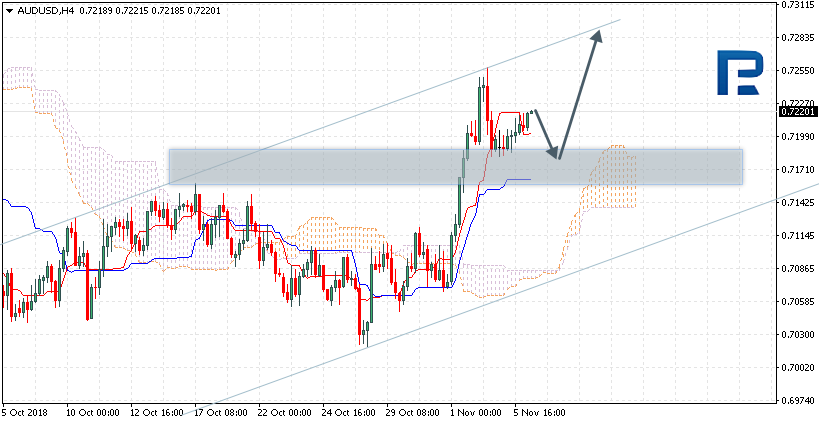
AUDUSD is trading at 0.7220; the instrument is moving above Ichimoku Cloud, thus indicating an ascending tendency. The markets could indicate that the price may test Tenkan-Sen and Kijun-Sen at 0.7185 and then resume moving upwards to reach 0.7285. Another signal to confirm further ascending movement is the price’s rebounding from the support level. However, the scenario that Implies further growth may be cancelled if the price breaks the downside border of the cloud and fixes below 0.7115. In this case, the pair may continue falling towards 0.7025.
NZDUSD, “New Zealand Dollar vs US Dollar”
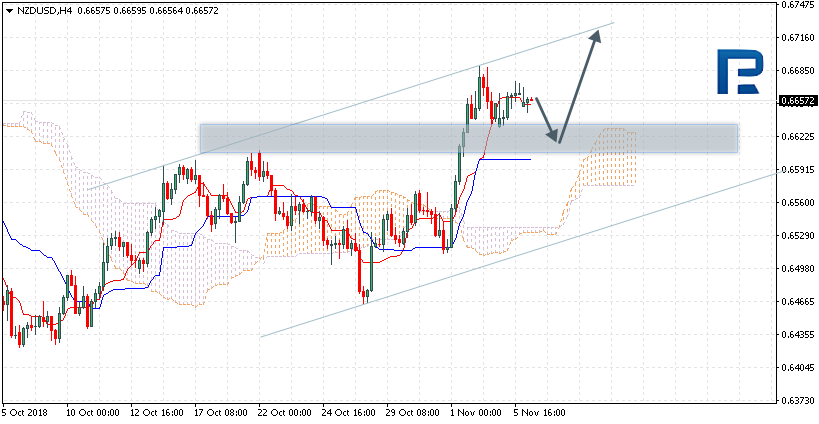
NZDUSD is trading at 0.6657; the instrument is moving above Ichimoku Cloud, thus indicating an ascending tendency. The markets could indicate that the price may test Tenkan-Sen and Kijun-Sen at 0.6635 and then resume moving upwards to reach 0.6715. Another signal to confirm further ascending movement is the price’s rebounding from the support level. However, the scenario that Implies further growth may be cancelled if the price breaks the downside border of the cloud and fixes below 0.6560. In this case, the pair may continue falling towards 0.6455.
USDCAD, “US Dollar vs Canadian Dollar”
USDCAD is trading at 1.3105; the instrument is moving above Ichimoku Cloud, thus indicating an ascending tendency. The markets could indicate that the price may test the upside border of the cloud at 1.3090 and then continue moving upwards to reach 1.3220. Another signal to confirm further ascending movement is the price’s rebounding from the support level. However, the scenario that implies further growth may be cancelled if the price breaks the downside border of the cloud and fixes below 1.3050. In this case, the pair may continue falling towards 1.2965. After breaking the channel’s upside border and fixing above 1.3165, the price may continue moving upwards.
Attention! Forecasts presented in this section only reflect the author’s private opinion and should not be considered as guidance for trading. RoboForex LP bears no responsibility for trading results based on trading recommendations described in these analytical reviews.
There is an ambiguous technical pattern on the EUR/USD currency pair. At the moment, the EUR/USD quotes are consolidating. Local levels of support and resistance are 1.14000 and 1.14250, respectively. Investors took a wait-and-see attitude before the midterm elections in the United States and the Fed’s meeting. We recommend opening positions from key levels.
The news feed on 06.11.2018:
At 17:00 (GMT+2:00) the data on the number of open jobs in the JOLTS labor market will be published.
Indicators point to the power of buyers: the price has fixed above 50 MA and 200 MA.
The MACD histogram is in the positive zone, but below the signal line, which gives a weak signal to buy EUR/USD.
Stochastic Oscillator is in the neutral zone, the %K line is above the %D line, which indicates the bullish sentiment.
Trading recommendations
Support levels: 1.14000, 1.13750, 1.13400
Resistance levels: 1.14250, 1.14500, 1.14850
If the price fixes above the resistance level of 1.14250, the EUR/USD currency pair is expected to grow. The movement is tending to 1.14500-1.14800.
Alternative option. If the price fixes below 1.14000, you need to look for entry points to the market in order to open short positions. The movement is tending to 1.13750-1.13500.
The GBP/USD currency pair
Technical indicators of the currency pair:
Prev Open: 1.30215
Open: 1.30330
% chg. over the last day: +0.40
Day’s range: 1.30289 – 1.30851
52 wk range: 1.2662 – 1.4378
The GBP/USD currency pair continues to show a positive trend. During yesterday’s and today’s trading, the growth of quotations exceeded 70 points. At the moment, the pound is testing a local resistance of 1.30800. The mark of 1.30300 is already a “mirror” support. Positive news about Brexit supports the demand on pound. Trading instrument is tending to grow.
The news feed on the UK economy is calm.
Indicators point to the power of buyers: the price has fixed above 50 MA and 200 MA.
The MACD histogram is in the positive zone and continues to rise, which gives a strong signal to buy GBP/USD
Stochastic Oscillator is in the neutral zone, the %K line is above the %D line, which indicates the bullish sentiment.
Trading recommendations
Support levels: 1.30300, 1.29800, 1.29500
Resistance levels: 1.30800, 1.31400
If the price fixes above the resistance level of 1.30800, further growth of the GBP/USD currency pair is expected. The movement is tending to 1.31200-1.31400.
An alternative could be a drop in the GBP/USD quotes to the level of 1.30000-1.29800.
The USD/CAD currency pair
Technical indicators of the currency pair:
Prev Open: 1.30879
Open: 1.31087
% chg. over the last day: +0.08
Day’s range: 1.30943 – 1.31160
52 wk range: 1.2248 – 1.3387
The USD/CAD currency pair is still being traded in the flat. The technical pattern is ambiguous. The USD/CAD quotes are testing local support and resistance levels: 1.30850 and 1.31200, respectively. Positions must be opened from these marks. Investors expect additional drivers. We recommend paying attention to the news feed from the United States.
At 15:30 (GMT+2:00) data on building permits in Canada will be published.
Indicators do not send accurate signals: 50 MA has crossed 200 MA.
The MACD histogram is in the positive zone, but below the signal line, which gives a weak signal to buy USD/CAD.
Stochastic Oscillator is in the neutral zone, the %K line has crossed the %D line. There are no signals at the moment.
Trading recommendations
Support levels: 1.30850, 1.30500, 1.30200
Resistance levels: 1.31200, 1.31450, 1.31700
If the price fixes below the support of 1.30850, the USD/CAD quotes are expected to fall. The movement is tending to 1.30500-1.30300.
An alternative could be the growth of the USD/CAD currency pair to the level of 1.31450-1.31700.
The USD/JPY currency pair
Technical indicators of the currency pair:
Prev Open: 113.148
Open: 113.192
% chg. over the last day: +0.12
Day’s range: 113.161 – 113.446
52 wk range: 104.56 – 114.74
The USD/JPY currency pair is still in the flat. Unidirectional trend is not observed. Currently, the local support and resistance levels are: 113.100 and 113.400, respectively. Financial market participants expect additional drivers. We recommend paying attention to the news feed and the dynamics of US government bonds. Positions must be opened from key levels.
The news feed on the economy of Japan is quite calm.
The price has fixed above 50 MA and 200 MA, which indicates the power of buyers.
The MACD histogram is in the positive zone, but below the signal line, which gives a weak signal to buy USD/JPY.
Stochastic Oscillator is in the neutral zone, the %K line is below the %D line, which indicates the bearish sentiment.
Trading recommendations
Support levels: 113.000, 112.650, 112.350
Resistance levels: 113.400, 113.700, 114.000
If the price fixes above the resistance level of 113.400, the growth of the USD/JPY quotes is expected. The movement is tending to 113.700-114.000.
An alternative could be a decrease in the USD/JPY currency pair to 112.700-112.500.
During yesterday’s trading, the USD weakened against the basket of the major currencies despite the strong economic data. For example, the Purchasing Managers’ Index by ISM for October reached 60.3 while the experts predicted only 59.3. The investors are waiting for the Congress election results. The USD index (#DX) closed in the red (-0.27%).
The British pound strengthened against the USD despite the weak economic stats from Great Britain. The Purchasing Managers’ Index in GB for October lowered to 52.2 instead of the expected 53.3. Still, the financial market participants are positive regarding the GBP, since Great Britain and the EU might reach a Brexit agreement soon.
During the Asian trading session, the Reserve Bank of Australia reached a decision regarding the key interest rate. Just as the expert predicted, it remained at 1.50%. The regulator plans to keep the current monetary policy course.
The prices on oil are consolidating. Right now, the WTI futures are trading at 62.85 USD/barrel. At 23:30 we expect an API Weekly Crude Oil Stock report.
Market Indicators
The major US stock indices show mixed results: #SPY (+0,55%), #DIA (+0,80%), #QQQ (-0,25%).
The 10-year US government bonds yield is 3,20-3,21%.
The Economic News Feed for 06.11.2018:
– JOLTS Job Openings report for September (US) – 17:00 (GMT+2:00);
– Various reports on the state of the Labour market (NZ) – 23:45 (GMT+2:00).
On Monday the 5th of November, trading on the euro closed up. After falling to 1.1354, the price recovered to 1.1424. At the beginning of the European session, the pressure on the euro left investors feeling anxious over the fact that the conflict between the Italian government and the European Commission was not resolved.
In the US session, the euro received support from the strengthening of the pound against the dollar. The pound rose on reports that the UK is close to concluding an agreement with the EU.
Day’s news (GMT+3):
10:00 Germany: factory orders (Sep).
11:15 Spain: Markit services PMI (Oct).
11:50 France: Markit services PMI (Oct).
11:55 Germany: Markit services PMI (Oct).
12:00 Eurozone: Markit PMI (Oct).
13:00 Eurozone: PPI (Sep).
16:30 Canada: building permits (Sep).
18:00 US: JOLTS job openings (Sep).
Fig 1. EURUSD hourly chart
Current situation:
The price has reached the level that I expected to see, but the way it formed was different.
Market participants are awaiting the outcome of the US mid-term elections. The Democrats are predicted to get a majority in the House, and the Senate will remain under Republican control. In this case, the euro will strengthen, as it will be difficult for Trump to implement his economic plans.
The price is trading near the balance line. Considering that the stochastics are in the euro buying zone, according to the forecast, I expect the price to recover to 1.1442.
On Wednesday, the regular meeting of the US Federal Reserve Open Market Committee will be held. The regulator will leave the base rate unchanged. An increase is expected in December, therefore, some key events to keep an eye on are the US mid-term congressional elections and the situation in Europe with regard to Italy’s draft budget for 2019.
It’s worth keeping one eye on the spread between the yields of Italian and German 10-year bonds, and the other on 10-year US bonds.
On the 29th of October, we wrote a piece about NZDCHF. In that analysis, we were bullish and that was a great call. Since our piece was published, the price has climbed more than 150 pips higher, hitting new mid-term highs. Today, positive sentiment on NZD will continue, but we will change the second currency in the pair. Our hero for the 5th of November is EURNZD.
The pair has been falling sharply since the 8th of October. From the technical point of view, the decline is caused by the double top formation (yellow rectangle). What is more, the double top pattern, at the same time, is a false breakout formation, above the orange resistance. The combination of these two factors gave us a strong decline, which allowed the price to break the long-term upwards trend line (blue). That is a very negative sign and opens up the way to 1.655, or the lows from January and June. It is unlikely that this will be the case, and we will need a bullish correction in the meantime, but the chances of the price getting there are very high.
Summing up, our outlook on this instrument is definitely negative, and it is likely that we will see a further drop. Entering right now is a bit too risky though, mainly because it seems that EURNZD could be oversold at the moment. In all honesty, I would prefer to wait for the bullish correction first.
The recent $200 million customs debacle may be just a tip of the iceberg. Due to illicit financial flows, Philippines has lost almost $10 billion annually. Tax evasion may be as costly. In this status quo, only a fully independent anti-graft campaign can succeed.
In August, 500 kilos of shabu (methamphetamine), estimated at ₱4.3 billion (over $80 million), that entered the country was intercepted by the Bureau of Customs at Manila’s container port. The next day, authorities found similar containers, but not the drugs estimated at ₱11 billion (almost $210 million).
In early November, former Customs intelligence officer Jimmy Guban, suspected member of a drug syndicate, was turned over to the Department of Justice after days of detention in the Senate. Accepted into the government’s Witness Protection Program, Guban is believed to be a vital witness in the smuggling into the country of billions of pesos worth of shabu.
Unsurprisingly, Dr Dante A. Ang, chairman emeritus of The Manila Times, has said that corruption has “become a way of life in high places in government.” While President Duterte’s campaign against illegal drugs has effectively interdicted the narco-state trajectory, he fears the country may still become “another Colombia.”
If corruption and illegal drugs are two sides of the same coin, Ang asks: “Whom can President Duterte trust?” The short answer is: “Nobody.”
From drug trade to illicit financial flows
While illegal drugs entered the Philippines before the President Aquino III era, it was during his watch that drugs grew embedded with most Filipino neighborhoods.
Yet, the drug scourge was downplayed by the mainstream media in the Philippines and largely ignored by international media, despite the expansion of the kitchen labs by drug syndicates, warnings by U.S. State Department, the Discovery documentary about drug leaders’ luxurious life in the New Bilibid Prisons and collusion by government authorities, including former Justice Secretary Leila de Lima.
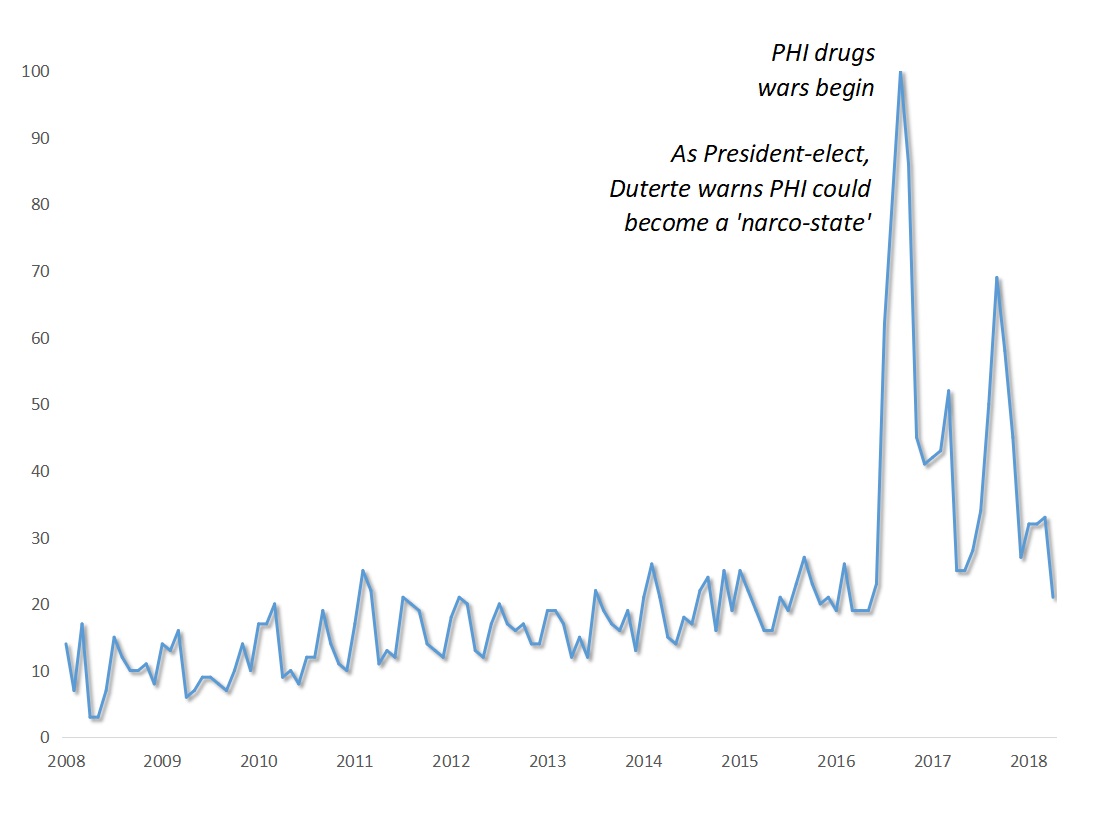
As a Google Trend search demonstrates, it was only after Duterte won the 2016 election and began the war against the drugs that Philippines discovered it had a drug problem. That, in turn, casts a long, dark shadow over the years when the country was ruled by the Liberal Party (Figure 1).
Figure 1The Long silence about PHI drugs until the Duterte Era
Source: Google
Of course, corruption is not a Philippines monopoly. Setting aside the lucrative multibillion dollar drugs business, illicit financial flows involve huge economic stakes that are not disclosed in national accounts or balance of payments figures. Rather, these flows typically comprise trade mispricing, bulk cash movements, informal transactions, and smuggling.
According to research, illicit flows nearly doubled to $130 billion in emerging Southeast Asia between 2003 and 2014. Concurrently, their cumulative value amounted to more than $1 trillion.
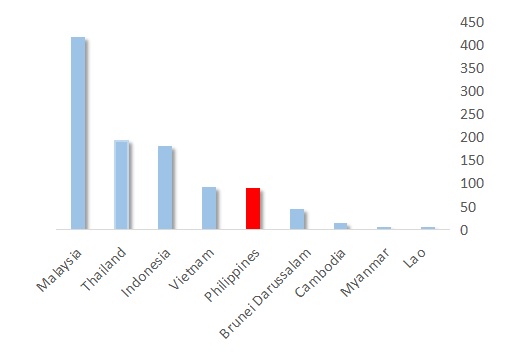
In country comparisons, Malaysia ranks highest in cumulative illicit financial flows. Between 2003 and 2014, it lost $420 billion in this way. Next come Thailand and Indonesia, while Philippines ranks at par with Vietnam. Each of the last two lost more than $90 billion in cumulative illicit financial flows during the period (Figure 2).
Figure 2Illicit Financial Flows: Emerging Southeast Asia ($ Billion)
Source: GFI
Today, even Colombia is in a different league than Philippines in illicit financial flows. Between 2003 and 2013, Colombia lost “only” $15 billion in cumulative illicit flows. Philippines lost an estimated $75 billion more.
The costs of corruption
According to the IMF, the annual cost of bribery alone has been estimated internationally at $1.5 to $2 trillion (2% of global GDP). Yet, bribery is just a part of the big picture. Historically, corruption that arises from the abuse of public office for private gain has been evidenced by powerful networks between business and government. These dark networks reflect the de facto privatization of public policy.
Internationally, corruption has been found to undermine economic development:
Since corruption weakens the state’s capacity to raise revenue and perform its core functions, it increases tax evasion. According to the 2017 UNU-Wider report (2013 data), tax evasion costs Philippines almost $7.4 billion annually, or 2.7% of its GDP. In these terms, the country ranks at par with Haiti, Morocco and India.
By inflating costs in the public procurement process, corruption undermines the quantity and quality of public spending. In addition to procurement abuses, the pork barrel scam (PDAF) illustrates such challenges. In the Philippines, the history of such funds began already in the American colonial period but seems to have intensified following President Corazon Aquino’s creation of the Countrywide Development Fund in 1990.
Because of lower public revenues, countries tend to rely more on central bank financing, which creates an inflation bias. In the Philippines, examples include recent inflation concerns that seem to have been fueled by supply abuses and hoarding of rice and the consequent destabilized prices (rice smuggling had soared already in the Benigno Aquino III era).
As corruption can even raise the cost of accessing financial markets since lenders factor in corruption, resources are allocated to rent-seeking rather than productive activities. In the Philippines, one cannot help but wonder why it was so important to focus on financial wealth rather than infrastructure investment in the pre-Duterte era.
International precedents
No country can or should tolerate a status quo, where growth and employment prospects remain subdued while a number of high-profile corruption cases undermine economic growth.
Evidence from Singapore, Hong Kong and China demonstrates that anti-corruption struggle can be effective, but only when the anti-graft authorities report directly to the chief executive – not to government agencies, policymakers, police, or military.
What the Philippines needs is effective zero tolerance toward corruption.
About the Author:
Dr Dan Steinbock is the founder of the Difference Group and has served at the India, China, and America Institute (US), Shanghai Institutes for International Studies (China) and the EU Center (Singapore). For more information, see http://www.differencegroup.net/
The original version was published by The Manila Times on Nov. 5, 2018.
Bitcoin and other cryptocurrencies are gaining more attention as days pass. Aside from the advantages that cryptocurrencies have like anonymity and easy international transactions, people are enticed by the fact that it can become a good investment. Apart from trading bitcoins for cash, you can also use bitcoins to buy gift cards, book flights, and hotels, buy furniture, or even buy real estate properties. Bitcoin purchases are not taxed at the moment since there is no way for third parties to identify, track, or intercept transactions that use bitcoins. Transaction fees are considerably lower as well compared to credit card transactions or services like Paypal.
Although there are many advantages in using bitcoin or other cryptocurrencies, just like any other investments, you should always be careful with your transactions. Since cryptocurrency is not regulated, many unscrupulous people have taken advantage of this and incidents of fraudulent cryptocurrencies, and other types of scam related to cryptocurrency have happened. One example of this is Prodeum, a cryptocurrency start-up that scammed its investors in just one weekend.
Because of these scams, law firms have now been involved in helping the victims. Cryptocurrency litigation has now become something that some lawyers specialize in. There are a lot of factors to consider when a cryptocurrency dispute arises. Aside from fraudulent Initial Coin Offering (ICO), lawyers could get involved if the cryptocurrency was used to launder money or hide assets; they could also get involved when there is an issue with the company, commercial, or intellectual property laws being violated in relation to cryptocurrency.
Here are some things that you can do as a cryptocurrency user to avoid being scammed:
1. Research. – Just like with any other investments that you will make, research is essential. When investing in an ICO, make sure to read and dissect their white papers to ensure that you’re working with reliable people. Take time to research the people behind the ICO, their whole team, board members, and other investors. It’s vital for you to learn as much as you can about the company before investing so that there will be no unpleasant surprises.
2. Be vigilant. – Cryptocurrency is still primarily bought and sold at exchanges. Because cryptocurrency is something new and the fuss around it is its value, many people get scammed by the promise of unrealistic prices. If an exchange promises incredible discounts or offers that seem too good to be true, it probably is. Another thing that you can do to avoid bitcoin exchange scams is to check the exchange’s URL. If a website’s address starts with HTTPS instead of just HTTP, that means that the traffic is encrypted and therefore has more protection.
3. Only use trusted sources. – Hardware wallet is a physical device that stores your private keys. Hardware wallets offer more protection from hacking since there is no way for hackers to access them when you’re not online. However, hackers have now found a way around that. Some hackers sell hardware wallets that have a backdoor for them to access all your cryptocurrency and the best way to avoid this is only to accept hardware wallets from trusted sources.
None of the content on Hoganinjury.com is legal advice nor is it a replacement for advice from a certified lawyer. Please consult a legal professional for further information.