On Wednesday the 7th of November, the euro/dollar pair closed slightly up. Buyers have lost all of the gains that could have been made from the results of the US Congressional elections. The euro fell from 1.1500 to 1.1425.
Congress is now split, with the Democratic Party in control of the House of Representatives and the Republican Party in control of the Senate. President Donald Trump congratulated everyone and expressed his desire for bipartisanship with the Democrats.
The elections are over. The dollar index has won back the losses incurred. Market participants have again switched gears, returning to the situation around the EU and Brexit. From 1.15, the price dropped to 1.1436, rolling back to the balance line.
At 12:00 the ECB will issue the Eurozone economic bulletin. It may have a short-term impact on our pair. In the evening, the Fed will announce the interest rate decision. There is no rate hike expected at the November meeting and the accompanying statement will not include the publication of economic forecasts. Fed Chair Jerome Powell will hold a press conference in December.
The pair is in the middle of the rising channel in the range of 1.1360-1.1550. If we draw a trend line from 1.1302, we’ll see the intermediate support at 1.1410. Now the 67th degree is acting as a support. I think that the price will remain above the trend line and close somewhere around 1.1437. It’ll take a day for the dust to settle after the US Congressional elections. If the trend does not hold at 1.1410, the fall will accelerate to 112nd degree or the lower border of the channel at 1.1366.
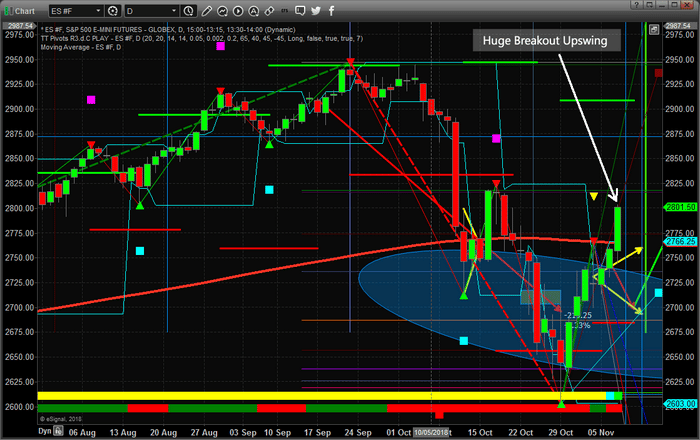
Our research team is writing this message to alert all investors and traders of a pending rotation in the US stock market that may happen between now and November 15. The upside price breakout that is occurring on November 7, the day after the US mid-term elections, is an incredible display of global investor sentiment regarding the GOP success in the Senate and the continued business-friendly expectations originating out of Washington DC. The move, today, shows how clearly a global capital market shift is still engaged in the US markets and how much global investors are counting on the US to drive ROI and economic growth going forward.
Yet, we feel it is important to urge investors that our modeling systems are still suggesting an ultimate price bottom should be setting up near November 8~15 and that we could still see a bit of downward price rotation over the next few days before this ultimate price bottom completes. It might be too easy to get caught up in this move, today, and fail to properly understand the price rotation risks that are still active in the time/price horizon.
The ES is currently +48.00 as of the creation of this post (+1.74%). This is an incredible move higher and the 2790 level becomes critical support for the markets as long as price is able to stay above that level.
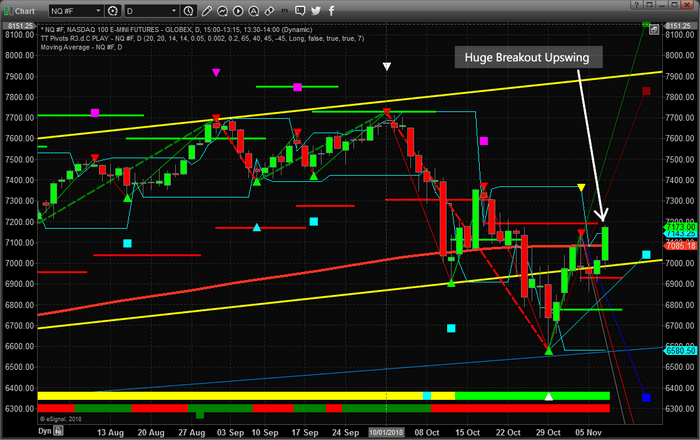
The NQ is currently +172.50 (+2.45%) and shows just how clearly investors are piling into technology, healthcare and bio-tech after the US elections. This is a real vote from investors that they believe President Trump will be able to navigate any issues going forward and that the US economy will continue to push out strong numbers.
Follow our analysis to read our most recent research posts. We have already positioned our members for this “ultimate bottom” that our predictive modeling systems suggest is in the midst of forming. We called this entire downside move, bottom rotation and the ultimate bottom pattern setting up near November 12th back on September 17. If you want to learn how we can help you find and execute better trades, visit TheTechnicalTraders.com to learn more.
EURUSD has rebounded from 1.1391 upwards and right now is still trading according to an alternative scenario to continue the correction towards 1.1486. Today, the pair may fall to reach 1.1440 and then form one more ascending structure towards 1.1486 to complete this correctional wave. After that, the instrument may consolidate near the lows and form a reversal pattern. If the market breaks the range to the downside, the price may resume trading inside the downtrend with the first target at 1.1320.
GBPUSD, “Great Britain Pound vs US Dollar”
GBPUSD is trading upwards to expand the consolidation range. Possibly, today the pair may form a new descending structure to reach 1.2952 and then grow towards 1.3020. Later, the market may resume falling to return to 1.2952 to break it and then continue trading inside the downtrend with the short-term target at 1.2750.
USDCHF, “US Dollar vs Swiss Franc”
USDCHF is still consolidating above 0.9986. Today, the pair may expand the range downwards to reach 0.9975. After that, the instrument may start another growth with the short-term target at 1.0106.
USDJPY, “US Dollar vs Japanese Yen”
After rebounding from 113.20, USDJPY has reached the upside target at 113.80 and almost completed the correction. Possibly, today the price may form a new descending structure to return to 113.20 to break it. The first target is at 112.58.
AUDUSD, “Australian Dollar vs US Dollar”
AUDUSD is consolidating at the top; it has expanded the range and reached a new high. Today, the pair may fall towards 0.7182 and then grow to reach 0.7221. Later, the market may start another decline with the target at 0.7090.
USDRUB, “US Dollar vs Russian Ruble”
USDRUB is trading downwards to reach 65.60. After that, the instrument may towards 66.02 and then resume falling with the short-term target at 64.69.
XAUUSD, “Gold vs US Dollar”
Gold is still being corrected and forming the Flag pattern. Today, the pair may form a new descending structure to reach 1221.57 resume growing towards 1229.10. If later the price breaks 1221.57 to the downside, the instrument may continue the correction towards 1206.05. However, if the market breaks 1230.00 to the upside, the price may continue trading inside the uptrend with the target at 1252.30.
BRENT
Brent is consolidating near the lows; it has completed the descending structure towards 71.40 and reached the first target of the entire descending wave. Possibly, today the price may grow to reach 74.67 and then fall towards 72.95. Later, the market may form one more ascending structure to break 74.67 and, as a result, start a new correction with the target at 80.37.
Attention! Forecasts presented in this section only reflect the author’s private opinion and should not be considered as guidance for trading. RoboForex LP bears no responsibility for trading results based on trading recommendations described in these analytical reviews.
The midterm elections result that has handed control of the lower house to the Democrats is likely to trigger a U.S. and global financial markets bounce, on relief that President Trump’s scope for waging trade wars will be limited by a divided Congress.
But gridlock in Washington will stall the White House’s bid to deregulate banking and industry, so limiting the relief rally.
Meanwhile, the Democrats gaining control of the House of Representatives is “unlikely to bother President Trump too much”.
This is the analysis from the CEO of one of the world’s largest independent financial advisory organizations following the Democrats flipping the lower house from red to blue.
Nigel Green, founder and chief executive of deVere Group, comments: “The Democrats gaining control of the House of Representatives is likely to drive a rally in U.S. financial markets into the year-end.
“This U.S. bounce can also be expected to positively impact global financial markets, given the high correlation between Wall Street and risk assets elsewhere.
“However, it can be reasonably assumed that this rally will be relatively short-lived as it could then be offset by legislative gridlock in Washington. This will halt deregulation legislation, which in turn will hurt sectors such as banking, energy, industrials, and smaller companies that stood to gain most from looser controls. Pharmaceuticals may suffer as the Democrats seek to bring down drug prices.
“The gridlock also means that fiscal policy will largely be maintained as it is, with no significant changes to spending or taxation.
He adds: “Portfolio diversification is the best way for investors to mitigate risks and take advantage of the opportunities that present themselves.
“Indeed, investors’ portfolios should be diversified enough to see any market outcomes as an opportunity. A well-diversified portfolio should always include several industrial sectors and asset classes, as well as geographical regions.”
The deVere CEO goes on to conclude: “This might look like a defeat for Donald Trump, but the reality is that he might not mind losing the House of Representatives too much.
“In this situation he could feasibly then attribute blame towards the Democrats should the economy falter and they refuse to pass more tax cuts to boost demand.”
About:
deVere Group is one of the world’s largest independent advisors of specialist global financial solutions to international, local mass affluent, and high-net-worth clients. It has a network of more than 70 offices across the world, over 80,000 clients and $12bn under advisement.
The technical pattern on the EUR/USD currency pair is ambiguous. Quotes are consolidating. At the moment, the local support and resistance levels are 1.14350 and 1.14750, respectively. Positions should be opened from these marks. Financial market participants took a wait-and-see position before the two-day Fed meeting.
The news feed on the economy of the Eurozone and the US is calm.
The price has fixed above 50 MA and 200 MA, which indicates the power of buyers.
The MACD histogram is in the positive zone, above the signal line, which gives a strong signal to buy EUR/USD.
Stochastic Oscillator is in the neutral zone, the %K line has started crossing the %D line. There are no signals at the moment.
Trading recommendations
Support levels: 1.14350, 1.14000, 1.13700
Resistance levels: 1.14750, 1.15300
If the price fixes above the resistance level of 1.14750, the EUR/USD quotes are expected to grow. The movement is tending to 1.15250-1.15500.
Alternative option. If the price fixes below 1.14350, it is necessary to look for entry points to the market to open short positions. The movement is tending to 1.14000-1.13700.
The GBP/USD currency pair
Technical indicators of the currency pair:
Prev Open: 1.30330
Open: 1.29981
% chg. over the last day: +0.55
Day’s range: 1.30222 – 1.30286
52 wk range: 1.2662 – 1.4378
There is the bullish sentiment on the GBP/USD currency pair. During yesterday’s and today’s trading, the growth of quotes exceeded 100 points. At the moment, the key support and resistance levels are 1.30900 and 1.31600, respectively. Demand for the pound is still high amid optimistic news about Brexit. The GBP/USD quotes have the potential for further growth.
The news feed on the UK economy is quite calm.
Indicators point to the power of buyers: the price has fixed above 50 MA and 200 MA.
The MACD histogram is in the positive zone and continues to rise, which gives a signal to buy GBP/USD.
The stochastic oscillator is in the neutral zone, the %K line is crossing the %D line. There are no accurate signals.
Trading recommendations
Support levels: 1.30900, 1.30400, 1.29600
Resistance levels: 1.31600, 1.32000
If the price fixes above the resistance level of 1.31600, further growth of the GBP/USD currency pair is expected. The movement is tending to 1.32000-1.32200.
An alternative may be a drop in the GBP/USD quotes to 1.30500-1.30200.
The USD/CAD currency pair
Technical indicators of the currency pair:
Prev Open: 1.31087
Open: 1.31209
% chg. over the last day: +0.05
Day’s range: 1.31068 – 1.31090
52 wk range: 1.2248 – 1.3387
There is a variety of trends on the USD/CAD currency pair. Investors expect additional drivers. At the moment, the local support and resistance levels are 1.31000 and 1.31300, respectively. Positions should be opened from these marks. We recommend paying attention to the dynamics of oil prices.
At 17:00 (GMT+2:00) the Ivey PMI will be published in Canada.
Indicators do not send accurate signals: 50 MA is crossing 200 MA.
The MACD histogram is near the 0 mark.
Stochastic Oscillator is in the neutral zone, the %K line has crossed the %D line. There are no signals at the moment.
Trading recommendations
Support levels: 1.31000, 1.30700, 1.30500
Resistance levels: 1.31600, 1.32000
If the price fixes below the round level of 1.31000, the USD/CAD quotes are expected to fall. The movement is tending to 1.30700-1.30500.
An alternative may be the USD/CAD currency pair growth to the round level of 1.32000.
The USD/JPY currency pair
Technical indicators of the currency pair:
Prev Open: 113.192
Open: 113.400
% chg. over the last day: +0.13
Day’s range: 112.947 – 113.102
52 wk range: 104.56 – 114.74
The technical pattern on the USD/JPY currency pair is ambiguous. Trading instrument is consolidating. Investors expect additional drivers. At the moment, the local support and resistance levels are 112.900 and 113.350, respectively. Positions should be opened from these marks. The USD/JPY quotes are tending to decline.
Today, the publication of important news from Japan is not expected.
Indicators do not send accurate signals: the price is being traded between 50 MA and 200 MA.
The MACD histogram has moved to the negative zone, indicating the bearish sentiment.
The Stochastic Oscillator is located near the oversold zone, the %K line has crossed the %D line. There are no accurate signals.
Trading recommendations
Support levels: 112.900, 112.600, 112.300
Resistance levels: 113.350, 113.800
If the price fixes below the support of 112.900, the USD/JPY quotes are expected to decline. The movement is tending to 112.600-112.300.
An alternative may be the growth of the USD/JPY currency pair to 113.800-114.000.
On Wednesday morning, USDJPY is trading a little bit to the downside; investors are interested in “safe haven” assets.
The Japanese Yen is once again in demand against the USD. The current quote for the instrument is 113.12.
The statistics published by Japan this morning were no surprise. The Average Cash Earnings increased up to 1.1% y/y in September, which is worse than expected (1.2% y/y), but better than in the previous month (0.8% y/y).
The Leading Economic Index dropped up to 103.9 points, the same as expected, after being 104.5 points the month before.
However, investors’ attention is not being focused on the statistics right now, but on political news, namely from the USA. At the moment, the country is counting the votes of the midterm elections. It is already quite clear that the Democrats swept into control of the House of Representatives. This is exactly what was the most intriguing thing of these elections – will Donald Trump’s party be able to keep charge of the Congress? Now, when this is all over, politicians might go back to discussing important topics that were put on hold, such as anti-Russia sanctions or the Iran situation.
In this light, investors are increasing their demand for “safe haven” assets, including the Yen.
Attention! Forecasts presented in this section only reflect the author’s private opinion and should not be considered as guidance for trading. RoboForex LP bears no responsibility for trading results based on trading recommendations described in these analytical reviews.
The US currency weakened slightly against a basket of major currencies. Yesterday, a report on the JOLTS job openings was published, the figure counted to 7.009M and was worse than the expected value of 7.100M. The dollar index (#DX) closed in the negative zone (-0.05%). Investors have taken a wait-and-see attitude before the Fed meeting, which will begin today and last two days. Tomorrow, the regulator will have to decide on a key interest rate. Experts expect that the regulator will leave the figure at the same level of 2.00%-2.25%.
Yesterday, reports on the labor market of New Zealand were also published. Thus, the “employment change” figure increased by 1.1% in the third quarter, while investors expected +0.5%. The unemployment rate declined to 3.9% in the third quarter instead of 4.4%. Today, the Reserve Bank of New Zealand will decide on the interest rate. Experts forecast that the interest rate will remain unchanged at 1.75%. The pound shows positive dynamics against optimistic news about Brexit.
The “black gold” prices have declined significantly. At the moment, futures for the WTI crude oil are testing a mark of $61.80 per barrel. At 17:30, a report on the US crude oil inventories will be published.
Market Indicators
Yesterday, the main US stock indices showed positive dynamics: #SPY (+0.63%), #DIA (+0.69%), #QQQ (+0.67%).
At the moment, the 10-year US government bonds yield is at the level of 3.19-3.20%.
The news feed on 07.11.2018:
– Ivey PMI in Canada at 17:00 (GMT+2:00); – RBNZ interest rate decision at 22:00 (GMT+2:00).
On Tuesday the 6th of November, trading on the euro closed higher. Market activity was low, pending the results of the US Congressional elections. Market participants tried to take into account the outcome of the elections, but to no avail. Trading closed at 1.1400. The dollar periodically came under pressure because investors were afraid of a victory by Democrats in the House. With the Democrats taking control of the House, it will be more difficult for the Trump administration to push forward legislation. Volatility increased during Asian trading when the votes began to come in. The euro rose 1.1473 and from there it dropped to 1.1395. It is currently at 1.1453.
My expectations for yesterday were met. Today’s forecast for the euro consists of a rollback to 1.1417, followed by a rebound to 1.1450. I would not count on strong growth on the euro/dollar pair because apart from Italy, the EU has yet another problem. Due to the conflict with Brussels, Poland may withdraw from the EU (Polexit), President of the European Council Donald Tusk stated. However, this issue will be put on the backburner until the last of the results of the US Congressional elections come in.
The price is at the resistance (67 degrees and the upper line of the channel). If the day closes according to my forecast, then on Thursday I will consider a weakening of the euro.
Let’s not forget that the US Fed will announce its interest rate decision today. A rate hike is not expected, so the market should respond calmly to this event without a press conference by the Fed head.
Today is the day that most of the world, and certainly all investors/traders, are watching as the US mid-term elections play out. The news channels and just about everyone is talking about how the results of these elections will potentially change or alter the US and global economies. Many are prognosticating that a solid red or blue result will drive investor sentiment and capital shifts for many months – which is correct.
Capital is very fluid and actively hunts for the safest and best returns. Over the past two+ years, our researchers, at www.TheTechnicalTraders.com, have authored countless articles highlighting our belief that a massive capital shift was taking place where global cash was rushing into the US markets after the 2016 Presidential election in an effort to ride the increased share price valuations and a safe-harbor element provided by US equities. This current election may change this perception a bit based on the final outcome of the elections, but we continue to believe the US equities markets and economy will continue to drive renewed growth and opportunity for at least 3~4 more years.
We, certainly, believe that valuations within certain sectors may become a concern over the next 24 months or so. Yet, we don’t believe the continue capital shift where cash has been rushing into the US markets and supporting the US Dollar is going to change dramatically with this current election cycle. We believe the US economy is firing on nearly all cylinders right now and it would take a massive blow to the political, economic and geopolitical landscape to unravel the US economy as it sits currently.
If you’ve been following our research posts, you already know that we called a market bottom near October 15th – yes, a bit early – we get it. Our proprietary indicators did not foresee the Fed/housing data news that resulted in the extended pricing pressure, lower, to the ultimate lows near October 25th. Yet, with October behind us and the US mid-term elections playing out, we are certain many of you want to know what we see in the future for the markets. So, here we go…
The reality is that our analysis has not changed much since we posted, on Sept 17th, our warning that the US stock market would likely experience a 5~8% price correction on or after September 21 and find an ultimate price bottom near November 8~12th before beginning a new upside price rally. These predictions were made nearly 60 days ago and our analysis has been quite accurate since we made our predictions (yes, we know we missed the extended downside move near October 25). When you consider the fact that we made these predictions using our proprietary price modeling and adaptive learning systems many months ago, one has to ask the question “if they can predict the markets with this type of accuracy, what else can they predict?”
The answer is quite simple, our analysis models and predictive learning systems are capable of identifying high probability price trends and key “price anomaly” structures before they happen – in some cases, many months before price rotates. Right now, the most important aspect of our predictive modeling that we urge all of our readers to understand is that an ultimate price bottom should be set up between Nov 8 and Nov 12. After that time, we expect a new price rally to begin sometime near after Nov 15th. We will continue to alert our followers with new predictive modeling as these key dates/predictions play out.
Now, let’s take a look at some charts to highlight what we believe will take place over the next few weeks.
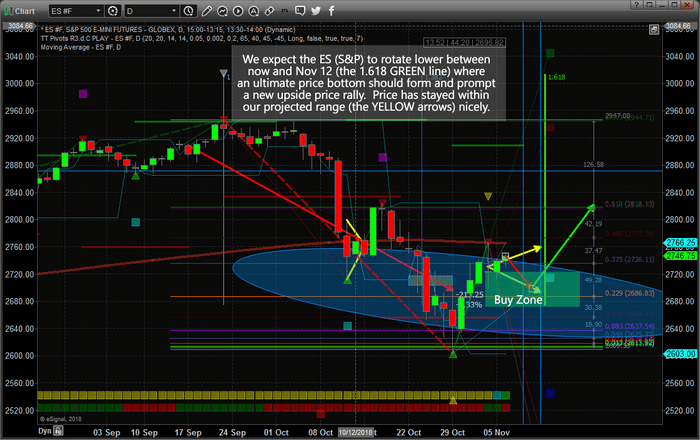
This Daily ES (S&P) chart shows our ongoing research and predictions from the week ending Nov 2 and earlier. At that time, we predicted the future price activity of the ES would stay within the YELLOW ARROWS range headed into the US elections and through our ultimate bottom price date range between Nov 8 and Nov 12. The vertical thin blue lines highlight those two key dates. The heavy GREEN LINE (1.618) reflects a key Fibonacci time/price cycle that is occurring on or near Nov 12. This is a very important indicator that a key price inflection point is likely to drive a massive price rotation near this date. Our expectations are that price will rotate and likely fall into the BUY ZONE over the next 5+ days, setting up a very important opportunity for skilled traders. As we move closer to the Nov 8~12 ultimate bottom date, we expect the price to begin a moderate rally higher and eventually breakout to the upside targeting the 2830~2840 level initially.
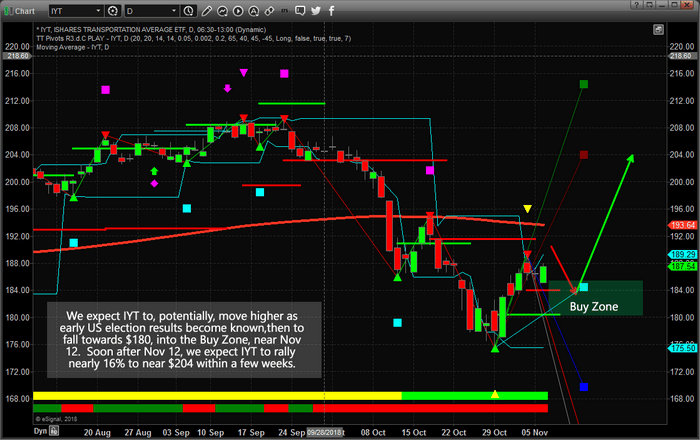
We expect the Transportation Index (IYT) to mimic the ES, to some degree, and present a new opportunity for skilled traders near the BUY ZONE. We believe this rotation will be the result of shifting perspectives and expectations as the election data is released. We’ve read that the true final outcome of the US mid-term elections may not be known for many weeks after the elections are completed, today. This means we could see an extended period of uncertainty in the US and global markets over the next few weeks. Additionally, we believe the general outcome will become known on or after November 15th. Thus, we believe our predictive modeling systems are accurately suggesting the final outcome of this election cycle will result in a positive outcome for the markets – likely a result of the continued strength of the US economy and the expectations of a Christmas Rally unfolding.
This IYT BUY ZONE presents a very clear opportunity for skilled traders to target a 10~15% upside potential if our predictions play out as expected. Get ready for some great trades to set up over the next 5+ months.
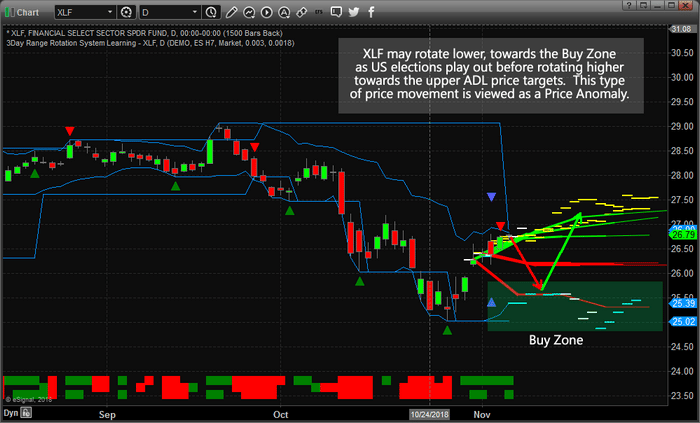
Saving the best for last, this XLF Daily chart (financials) highlights our Adaptive Dynamic Learning (ADL) predictive price modeling system at work. The interesting thing about this predictive modeling tool is that it can show us where we should expect the price to go well out into the future, but it can also highlight what we call “Price Anomalies” where price MAY rotate in a way that is counter to our predictive models. When this happens, we consider it an Anomaly where price is moving against predictive norms and, thus, is likely to and may “revert” back to the predicted price levels.
In the XLF example, below, you can see one of our predictive models suggested prices may move in a lower price range than the other predictive models. This is an “anomaly price range” and the way we interpret it is “if price does rotate lower, near the lower ADL price targets, then this sets up a potential for a very good Reversion Trade where price will attempt to move back towards the higher ADL prices” – roughly +5 to +8% or more. Therefore, if the price of the XLF falls below the GAP high, on Oct 30, of $25.94, we believe this sets up a very high probability “reversion trade” for a move back to near $26.90 or higher.
By this time, you should be seeing a common theme within our analysis. If you were paying attention, you will notice that we are suggesting the US equity markets will likely rotate a bit lower over the next 5+ days before finding and setting up for our predicted “ultimate price bottom” near November 8~12. These predictions allow for skilled traders to set up and position their portfolios for some incredible opportunities headed into the end of 2018.
We believe the outcome of the US mid-term elections may change some perspective of the economy and expectations a bit, but overall the US economy will continue to push along and drive greater expectations of capital growth and improving outcomes. Our opinion is that a massive price, and potentially global price destructive event, would have to take place to derail the current capital shift that is taking place throughout the planet. This current capital shift will not last forever, nor should we expect it to continue as it has for the past 24+ months at the same, or similar, levels. Yet, as of right now, we believe the outcome of the US mid-term elections will not dramatically alter the future pricing and valuation predictions of the US stock market going forward for at least 5+ months.
In closing, if you value the research, analysis and trading signals we share with you, as well as the effort we take to make sure you are keenly aware of our expectations and pricing models, then do yourself and our research team an favor and visit TheTechnicalTraders.com and consider subscribing to our services as a member. Our followers and members have commented that we are “the only team that can accurately predict prices and price rotation many months into the future” and we believe our proprietary predictive modeling tools are the best on the planet. If you like our research and have profited from our efforts to help you find and execute better trades, then please consider supporting our work by visiting TheTechnicalTraders.com. Get ready to make 2019 a fantastic year with great trades.
Generally speaking, October was pretty bad for the euro. We are not only talking about the main pair (USD) here, but about the broad market. Things may be changing, though, as EURCHF could bring us an element of hope.
It seems that the pair is getting ready for a major upswing. Until recently, we’ve been quite negative about the future of this instrument, but the recent price movements are pointing in the other direction. Our pessimistic sentiment was based on the fact that the price was in a downtrend and bounced from 38.2% Fibonacci. What is more, EURCHF broke the lower line of the flag pattern. The drop did not last too long though. Seven out of the last 8 days have been positive, and the price is targeting 38.2% Fibo again. That allowed the price to create an inverse head and shoulders pattern (blue).
As long as we stay below the Fibo mentioned above, sentiment will remain negative, but a breakout here will give us a proper buy signal. On the other hand, if there is a breakout at 23.6% Fibo, it will cancel the iH&S scenario, thus opening the way to new lows.