As we can see in the H4 chart, the short-term uptrend has reached the retracement of 50.0%. The next targets may be the retracements of 61.8% and 76.0% at 6571.00 and 6656.00 respectively. The current movement may be considered as a pullback towards the support level at 6342.00.
As we can see in the H1 chart, the divergence made the pair reverse and start a new correctional downtrend, which has already reached the retracement of 38.2%. The next downside target may be the retracements of 50.0% and 61.8% at 6371.70 and 6331.40 respectively.
ETHUSD, “Ethereum vs. US Dollar”
As we can see in the H4 chart, after testing the key high, ETHUSD has started a new correctional downtrend. The next upside targets are still inside the post-correctional extension area between the retracements of 138.2% and 161.8% at 230.44 and 237.08 respectively. The support level is at 191.01.
In the H1 chart, the divergence made the pair start a new downtrend, which has already reached the retracement of 38.2%. In the future, this decline may continue towards the retracements of 50.0% and 61.8% at 207.08 and 203.24 respectively.
Attention! Forecasts presented in this section only reflect the author’s private opinion and should not be considered as guidance for trading. RoboForex LP bears no responsibility for trading results based on trading recommendations described in these analytical reviews.
EURUSD is still falling. Today, the pair may fall to reach 1.1320 and then start a new correction towards 1.1383. After that, the instrument may resume trading inside the downtrend with the short-term predicted target at 1.1255.
GBPUSD, “Great Britain Pound vs US Dollar”
GBPUSD is forming the first descending impulse. Possibly, today the pair may reach 1.2990 and then grow towards 1.3077. Later, the market may resume falling to reach 1.2850. The main target of this descending structure is at 1.2654.
USDCHF, “US Dollar vs Swiss Franc”
USDCHF is still growing towards 1.0038. Today, the pair may reach 1.0094 and then start a new decline with the target at 1.0060. After that, the instrument may form one more ascending structure towards 1.0140. The first target of this ascending structure is at 1.0173.
USDJPY, “US Dollar vs Japanese Yen”
USDJPY is trading upwards; it has almost completed this wave. Possibly, today the price may consolidate near the highs. If later the pair breaks 113.80 to the downside, the instrument may form a new descending structure towards 112.60. Later, the market may; be corrected with the target at 113.30.
AUDUSD, “Australian Dollar vs US Dollar”
AUDUSD has completed the ascending channel. Today, the pair may fall to reach 0.7210 and then start a new correction towards 0.7256. Later, the market may resume trading inside the downtrend with the target at 0.7121.
USDRUB, “US Dollar vs Russian Ruble”
USDRUB has reached 66.40. Possibly, today the price may form one more descending structure towards 65.60. After that, the instrument may start another growth to reach 66.00 and then resume falling with the target at 64.70.
XAUUSD, “Gold vs US Dollar”
Gold has broken 1221.50. Possibly, the price may fall to reach 1216.60 and then resume growing to return to 1221.50. Later, the market may resume trading inside the downtrend with the target at 1206.04.
BRENT
Brent is still falling and reaching new lows; it has completed the first descending wave and right now is forming an extension. Possibly, today the price may reach 71.88 and then fall towards 70.11. After that, the instrument may start another growth with the target at 75.05.
Attention! Forecasts presented in this section only reflect the author’s private opinion and should not be considered as guidance for trading. RoboForex LP bears no responsibility for trading results based on trading recommendations described in these analytical reviews.
Yesterday, the bearish sentiment was observed on the EUR/USD currency pair. The Fed, as the experts expected, kept the range of the key interest rate at the same level of 2.00-2.25%. The regulator noted a stable growth of the economy and a strong labor market. The Central Bank plans to adhere to a gradual increase in interest rates. At the moment, the local support and resistance levels are 1.13250 and 1.13550, respectively. Positions should be opened from these marks. The trading instrument has the potential for further decline.
The news feed on 09.11.2018:
– Producer price index in the US at 15:30 (GMT+2:00).
Indicators point to the power of sellers: the price is being traded below 50 MA and 200 MA.
The MACD histogram is in the negative zone and below the signal line, which gives a strong signal to sell EUR/USD.
The Stochastic Oscillator is located near the oversold zone, the %K line is crossing the %D line. There are no signals at the moment.
Trading recommendations
Support levels: 1.13250, 1.13000
Resistance levels: 1.13550, 1.13800, 1.14000
If the price fixes below the support level of 1.13250, a further fall in the EUR/USD quotes is expected. The movement is tending to 1.13000-1.12750.
Alternative option. If the price fixes above the 1.13550 mark, it is necessary to look for entry points to the market to open long positions. The movement is tending to 1.13800-1.14000.
The GBP/USD currency pair
Technical indicators of the currency pair:
Prev Open: 1.31227
Open: 1.30607
% chg. over the last day: -0.46
Day’s range: 1.30045 – 1.30209
52 wk range: 1.2662 – 1.4378
The GBP/USD currency pair has been declining. During yesterday’s and today’s trading, the drop in quotes exceeded 120 points. At the moment, the key support and resistance levels are 1.29800 and 1.30400, respectively. We recommend following the current information regarding Brexit. Positions should be opened from the key levels.
The news feed on 09.11.2018:
– Data on the UK GDP at 11:30 (GMT+2:00);
– The volume of production in the UK manufacturing industry at 11:30 (GMT+2:00).
Indicators do not send accurate signals: the price is being traded between 50 MA and 200 MA.
The MACD histogram is in the negative zone, below the signal line, which gives a strong signal to sell GBP/USD.
Stochastic Oscillator is in the oversold zone, the %K line is below the %D line, which gives a weak signal to sell GBP/USD.
Trading recommendations
Support levels: 1.29800, 1.29400, 1.29000
Resistance levels: 1.30400, 1.31000, 1.31500
If the price fixes below the support level of 1.29800, a further drop in the GBP/USD quotes is expected. The movement is tending to 1.29400-1.29000.
An alternative may be the GBP/USD currency pair growth to the level of 1.30500-1.30750.
The USD/CAD currency pair
Technical indicators of the currency pair:
Prev Open: 1.31130
Open: 1.31552
% chg. over the last day: +0.24
Day’s range: 1.31932 – 1.31945
52 wk range: 1.2248 – 1.3387
Aggressive purchases are observed on the USD/CAD currency pair. During yesterday’s and today’s trading, quotes have risen by more than 100 points. At the moment, local support and resistance levels are 1.31700 and 1.32000, respectively. Positions should be opened from these marks. We recommend paying attention to the dynamics of oil prices. Trading instrument has the potential for further growth.
The news feed on the economy of Canada is quite calm.
Indicators point to the power of buyers: the price has fixed above 50 MA and 200 MA.
The MACD histogram is in the positive zone and above the signal line, which indicates the bullish sentiment.
The Stochastic Oscillator is located near the overbought zone, the %K line is above the %D line, which gives a weak signal to buy USD/CAD.
Trading recommendations
Support levels: 1.31700, 1.31400, 1.31000
Resistance levels: 1.32000, 1.32300
If the price fixes above the round level of 1.32000, we recommend considering purchases of USD/CAD. The movement is tending to 1.32300-1.32500.
An alternative may be a decrease in the USD/CAD currency pair to 1.31400-1.31200.
The USD/JPY currency pair
Technical indicators of the currency pair:
Prev Open: 113.400
Open: 114.057
% chg. over the last day: +0.38
Day’s range: 113.779 – 113.809
52 wk range: 104.56 – 114.74
Yesterday, the bullish sentiment was observed on the USD/JPY currency pair. At the moment, the technical pattern is ambiguous. Local support and resistance levels are 113.700 and 114.000, respectively. Positions should be opened from these marks. In the near future, technical correction is not excluded. We recommend paying attention to the economic reports from the United States.
Today, the publication of important news from Japan is not expected.
Indicators point to the power of buyers: the price is being traded above 50 MA and 200 MA.
The MACD histogram is in the positive zone, but below the signal line, which gives a weak signal to buy USD/JPY.
Stochastic Oscillator is in the neutral zone, the %K line is below the %D line, which indicates the bearish sentiment.
Trading recommendations
Support levels: 113.700, 113.400, 113.150
Resistance levels: 114.000, 114.350
If the price fixes below the support of 113.700, correction of the USD/JPY quotes is expected. The movement is tending to 113.400-113.150.
An alternative may be the USD/JPY currency pair growth to 114.350-114.500.
The US currency has been growing against the basket of major currencies. Yesterday, the Fed meeting was held, at which the regulator decided on the interest rate. As the experts expected, the interest rate remained unchanged at the level of 2.00-2.25%. The Fed also said that the US economy and labor market were strong, and it intends to adhere to a further gradual increase in interest rates. The next meeting and decision on the Fed interest rate will be held in December. The US dollar index (#DX) has updated the weekly high and closed in the positive zone (+0.71%).
Investors’ attention is also focused on Brexit. The European Commission intends to prepare for a tough version of the UK exit from the EU if London and Brussels do not reach an agreement. Starting from November 20, the European Commission will organize special seminars for EU member states. In total, there will be 12 such seminars. Today, investors expect important economic statistics from the UK and the US.
The “black gold” prices have fallen significantly. At the moment, futures for the WTI crude oil are testing a mark of $60.50 per barrel.
Market Indicators
Yesterday, there was a variety of trends in the US stock market: #SPY (-0.18%), #DIA (+0.12%), #QQQ (-0.64%).
At the moment, the 10-year US government bonds yield is at the level of 3.21-3.22%.
The news feed on 09.11.2018:
– Data on the UK GDP at 11:30 (GMT+2:00); – The volume of production in the UK manufacturing industry at 11:30 (GMT+2:00); – Producer price index in the US at 15:30 (GMT+2:00).
On Thursday the 8th of November, trading on the euro closed down. The euro fell markedly against the US dollar after the publication of the European Commission’s report, which is expected to slow the Eurozone economy in 2019. The European Commission lowered the GDP forecast in the Eurozone from 2% to 1.9%.
After the meeting, the US Federal Reserve’s Open Market Committee (FOMC) accelerated the pair’s descent. As expected, the FOMC decided to leave key interest rates in the country in the range of 2.00%-2.25%. The Committee confirmed its forecast for a gradual increase in interest rates. The statement that risks would remain balanced was present in the September statement, and remains intact. The next meeting is scheduled for December. Another rate hike is expected later this year.
Day’s news (GMT+3):
10:45 France: industrial output (Sep).
12:30 UK: GDP (Q3), total business investment (Q3), industrial production (Sep), trade balance (Sep), construction (Sep).
16:00 UK: NIESR GDP estimate (Oct).
16:30 US: PPI (Oct).
18:00 US: Michigan CSI (Nov).
21:00 US: Baker Hughes US oil rig count.
Fig 1. EURUSD hourly chart
Current situation:
Our forecast for the high and low was accurate. I did not consider the jump from the high (1.1447). I expected a fall to the trend line on Friday, while sellers passed this yesterday. In addition, there was a breakout of the upwards channel and the area around the 112th-135th degree acted as a support.
I did not make a forecast for Friday due to the conflicting situation we have. The price may fall to 1.1313, or via a correctional movement under the trend line. There is no important news scheduled for today for the euro, and should the euro strengthen to 1.1375, that could cancel the bearish scenario.
Ethereum, currently the second largest cryptocurrency after Bitcoin, will experience a “monumental, defining global breakout” when smart contracts can accept outside data.
The bullish prediction from influential technology expert, Ian McLeod of Thomas Crown Art, the world’s leading art-tech agency, comes as Ethereum’s price jumped 4 per cent on Monday, adding some 8 per cent over the last week, to trade at highs of $210.
Mr McLeod comments: “Ethereum is back in bull territory and is on track to enjoy considerable gains before year-end.
“I maintain that we can expect Ethereum to hit $500 by the end of 2018 and go on an overall upward trajectory throughout 2019.
“However, what will be the monumental, defining driver for its global breakout? Oracles.
“Oracles link Ethereum-run smart contracts to the real world and will be responsible for the digital currency to enter an entirely new phase of mass adoption.”
Oracles are trusted data feeds that deliver information into the smart contract, thereby taking away the requirement for smart contracts to directly access information outside their network. Typically, oracles are usually supplied by third parties which are authorised by the organisations that use them.
Ian McLeod continues: “Oracles are a massive step forward in the practical utilisation of smart contracts. They allow smart contracts to accept outside data to decide upon an action – and this has a myriad of highly-demanded, real-world use-cases in almost every sector.
“For instance, they can help insurance companies with pay-outs on flight delays, sports betting firms with result information coming from various trusted sources, and can help us in the art world by conclusively proving the provenance of artwork quickly and easily.”
He adds: “Using a blockchain to authenticate artwork is an ideal use-case for smart contracts. They provide the ability to store a permanent, immutable record of artwork at the point of creation which can be used to authenticate registered works. Oracles will further enhance this concept and lighten smart contracts’ work processes.”
The tech expert concludes: “When Ethereum-based smart contracts are fed a robust and reliable information through oracles to make precise and correct judgements, Ethereum’s price will explode.”
Last month, Mr Mcleod noted: “We can expect Bitcoin to lose 50 per cent of its cryptocurrency market share to Ethereum, its nearest rival, within five years.
“Ethereum is already light years ahead of Bitcoin in everything but price – and this gap will become increasingly apparent as more and more investors jump into crypto. ”
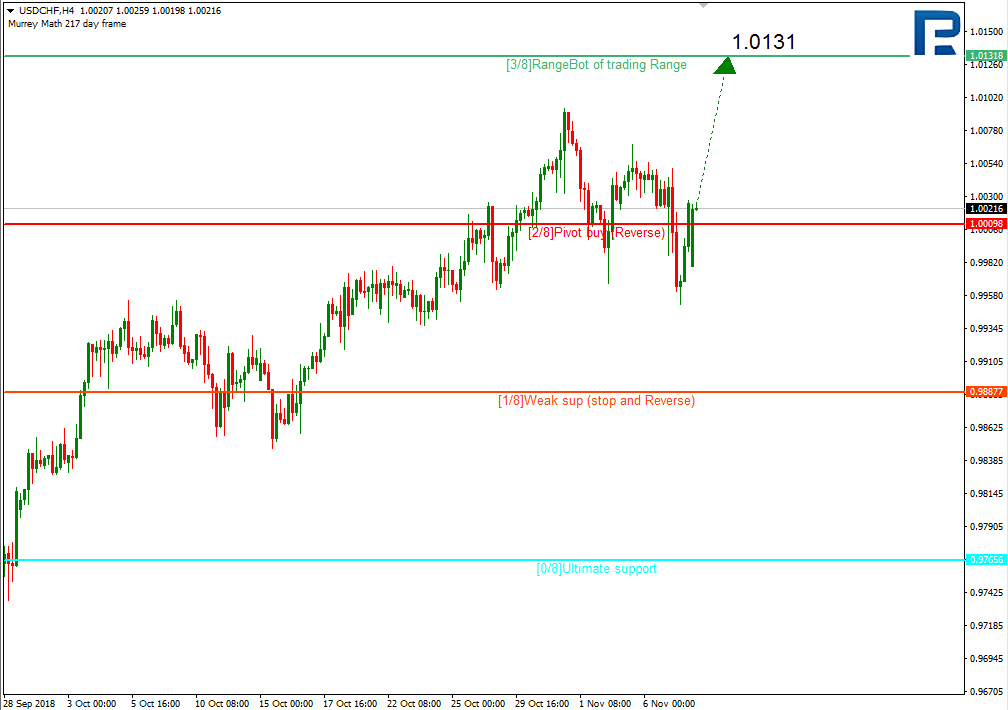
In the H4 chart, USDCHF is expected to continue growing to reach the resistance at the 3/8 level.
In the H1 chart, USDCHF is no longer trading inside the “oversold zone” and may continue trading upwards to reach the resistance at the 3/8 level.
As we can see in the M15 chart, the pair has broken the upside line of the VoltyChannel indicator and, as a result, may continue moving upwards.
XAUUSD, “Gold vs US Dollar”
As we can see in the H4 chart, XAUUSD is consolidating. In this case, the price is expected to resume trading downwards to reach the support at the 3/8 level.
In the H1 chart, the pair is trading below the 3/8 level and may continue falling towards the support at the 1/8 one.
As we can see in the M15 chart, the pair has broken the downside line of the VoltyChannel indicator and, as a result, may continue moving downwards.
Attention! Forecasts presented in this section only reflect the author’s private opinion and should not be considered as guidance for trading. RoboForex LP bears no responsibility for trading results based on trading recommendations described in these analytical reviews.
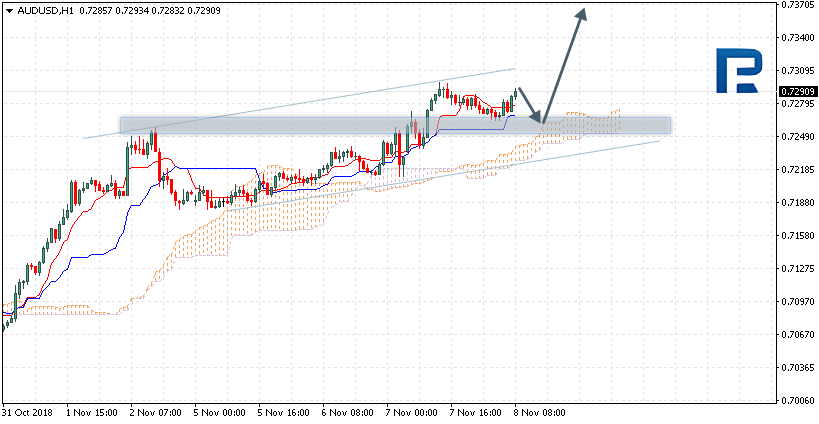
AUDUSD is trading at 0.7290; the instrument is moving above Ichimoku Cloud, thus indicating an ascending tendency. The markets could indicate that the price may test the upside border of the cloud at 0.7255 and then resume moving upwards to reach 0.7370. Another signal to confirm further ascending movement is the price’s rebounding from the support level. However, the scenario that Implies further growth may be cancelled if the price breaks the downside border of the cloud and fixes below 0.7220. In this case, the pair may continue falling towards 0.7125.
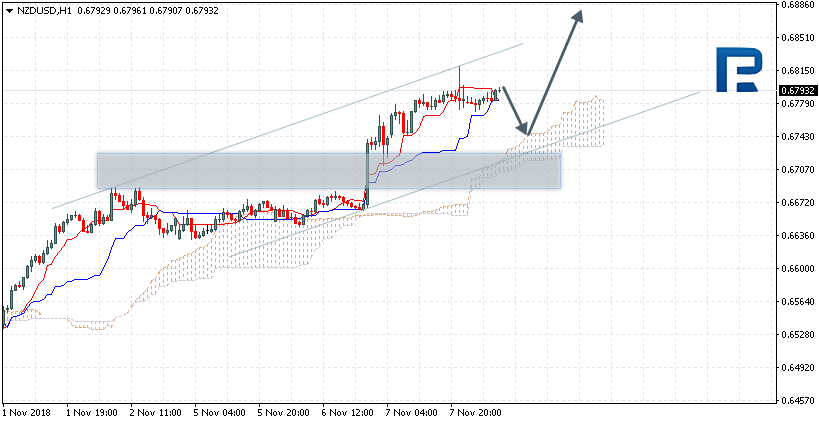
NZDUSD, “New Zealand Dollar vs US Dollar”
NZDUSD is trading at 0.6793; the instrument is moving above Ichimoku Cloud, thus indicating an ascending tendency. The markets could indicate that the price may test the upside border of the cloud at 0.6745 and then resume moving upwards to reach 0.6875. Another signal to confirm further ascending movement is the price’s rebounding from the channel’s downside border. However, the scenario that Implies further growth may be cancelled if the price breaks the downside border of the cloud and fixes below 0.6700. In this case, the pair may continue falling towards 0.6625.
USDCAD, “US Dollar vs Canadian Dollar”
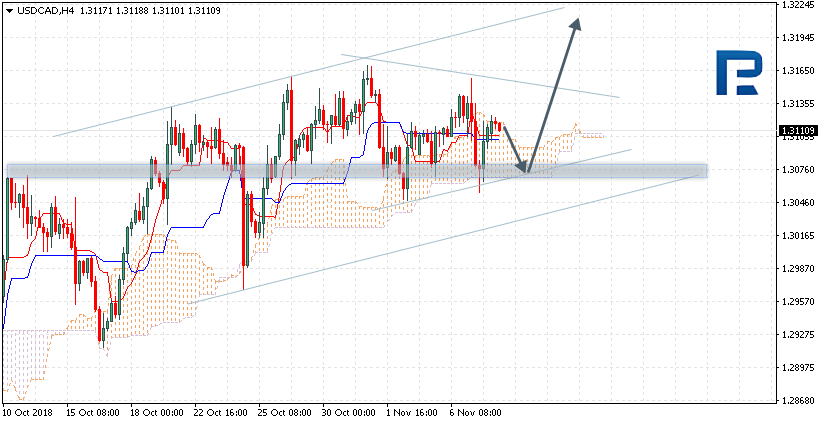
USDCAD is trading at 1.3110; the instrument is moving inside Ichimoku Cloud, thus indicating a sideways tendency. The markets could indicate that the price may test the downside border of the cloud at 1.3075 and then continue moving upwards to reach 1.3215. Another signal to confirm further ascending movement is the price’s rebounding from the support level. However, the scenario that implies further growth may be cancelled if the price breaks the downside border of the cloud and fixes below 1.3050. In this case, the pair may continue falling towards 1.2965. After breaking the upside border of the Triangle pattern and fixing above 1.3165, the price may continue moving upwards.
Attention! Forecasts presented in this section only reflect the author’s private opinion and should not be considered as guidance for trading. RoboForex LP bears no responsibility for trading results based on trading recommendations described in these analytical reviews.
Yesterday, the trends on the EUR/USD were highly ambiguous. At the moment, the quotes are consolidating. The local support and resistance levels are 1.14200 and 1.14500 respectively. Positions should be opened from these levels. The market participants are waiting for the Federal Reserve decision regarding the key interest rate.
At 21:00 (GMT+2:00) the Federal Reserve will determine the key interest rate.
Indicators do not provide precise signals, the price is trending between 50 MA and 200 MA.
The MACD histogram is in the negative and below the signal line, which provides a strong signal towards the purchase of EUR/USD.
The Stochastic Oscillator is near the overbought zone, the %K line crosses the %D line. There are no signals at the moment.
Trading recommendations
Support levels: 1.14200, 1.13900, 1.13600
Resistance levels: 1.14500, 1.14750, 1.15000
If the price holds above the resistance level 1.14500, we can expect further growth. The movement will tend toward 1.15000-1.15250.
Alternatively, the price fixes below 1.14200, and you should look for the market entry points to open the short positions. The movement will tend toward 1.13750-1.13500.
The GBP/USD currency pair
Technical indicators of the currency pair:
Prev Open: 1.29981
Open: 1.31227
% chg. over the last day: +0.22
Day’s range: 1.31366 – 1.31440
52 wk range: 1.2662 – 1.4378
GBP/USD is showing an ambiguous technical picture. The GBP is trading in flat. The key support and resistance levels are 1.31000 and 1.31600, respectively. The GBP/USD quotes have a potential for further growth. We recommend you watch out for the relevant data regarding Brexit.
The Economic News Feed for Great Britain is calm.
The indicators do not provide precise signals, the price is testing 50 MA.
The MACD histogram is near 0.
The Stochastic Oscillator is around the overbought zone, the %K line is above the %D line, which provides a weak signal for purchase.
Trading recommendations
Support levels: 1.31000, 1.30500, 1.30000
Resistance levels: 1.31600, 1.32000
If the price fixes above the resistance level 1.31600, we can expect further growth. The movement will tend toward 1.32000-1.32200.
Alternatively, the GBP/USD quotes can fall to 1.30500-1.30200.
The USD/CAD currency pair
Technical indicators of the currency pair:
Prev Open: 1.31209
Open: 1.31130
% chg. over the last day: -0.05
Day’s range: 1.30989 – 1.31059
52 wk range: 1.2248 – 1.3387
The USD/CAD currency pair is showing a variety of trends. Yesterday, Ivey published the Purchasing Managers’ Index for October in Canada, which reached 61.8 instead of the expected 50.9. The key support and resistance levels are 1.30900 и 1.31300, respectively. Positions should be opened from these levels. We recommend you keep an eye on the oil quotes.
The Economic News Feed for Canada is calm.
The indicators do not provide precise signals: 50 МА is over 200 МА.
The MACD histogram is near 0.
The Stochastic Oscillator is near the overbought zone, the %K line is below the %D line, which indicates a bearish sentiment.
Trading recommendations
Support levels: 1.30900, 1.30600, 1.30300
Resistance levels: 1.31300, 1.31600, 1.32000
If the price fixes above 1.30900, we recommend you to sell USD/CAD. The movement will tend toward 1.30600-1.30300.
Alternatively, the currency pair can grow towards 1.31600-1.31800.
The USD/JPY currency pair
Technical indicators of the currency pair:
Prev Open: 113.400
Open: 113.400
% chg. over the last day: +0.11
Day’s range: 112.947 – 113.102
52 wk range: 104.56 – 114.74
The USD/JPY is showing a bullish sentiment. During today’s and yesterday’s trading, the quotes have updated the local maximums. The local support and resistance levels are 113.500 and 113.800 respectively. Positions should be opened from these levels. The USD/JPY quotes have prospects for further growth. We recommend you keep an eye on the 10-year US government bonds yield.
The Economic News Feed for Japan is calm.
The indicators show the buyers’ power: the price is trading above the 50 MA and 200 MA.
The MACD histogram is in the positive zone and above the signal line, which provides a strong signal toward the purchase of USD/JPY.
The Stochastic Oscillator is in the neutral zone, the %L line crosses the %D line. There are no price signals.
Trading recommendations
Support levels: 113.500, 113.200, 113.000
Resistance levels: 113.800, 114.000, 114.500
If the price fixes below the support 113.500, we should expect the descend. The movement will tend toward 113.000. Alternatively, the currency pair can grow toward 114.200-114.500.
The USD weakened against the basket of major currencies. The USD Index (#DX) closed in the red (-0.11%). Democrats have won the House of the Representatives in the US while the Republicans are holding onto the Senat. The investors are waiting for the Federal Reserve to determine the new key interest rates. Watch out for the comments and the polemics by the Federal Reserve representatives.
A number of important economic reports was published yesterday. Canada released a Purchasing Managers’ Index by Ivey for October, which reached 61.8 instead of expected 50.9. The Reserve Bank of New Zeland left the key interest rate at 1.75%, as was expected. Today, during the Asian trading session, China has released positive data regarding their trade balance. For example, the volume of export rose in October to 15.6%, while the volume of import – to 21.4% instead of the expected 11% and 14% respectively.
The prices on oil started to recover. At the moment, the WTI futures are at 62 USD/barrel.
Market Indicators
The US stock market has been showing some aggressive buy-outs lately: #SPY (+2,14%), #DIA (+2,17%), #QQQ (+3,14%).