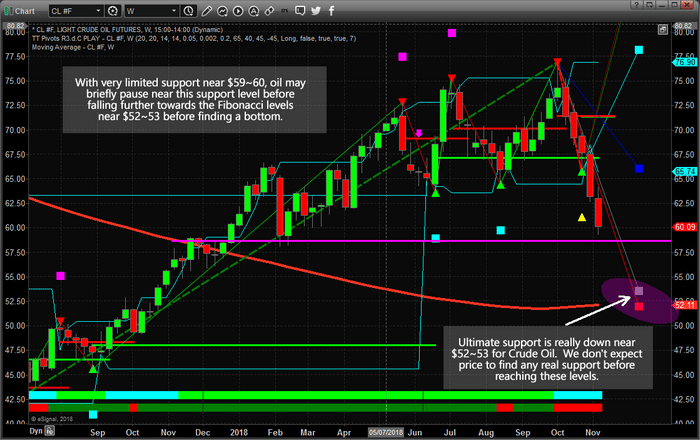
Our research team warned of this move in Crude Oil back on October 7, 2018. At that time, we warned that Oil may follow a historical price pattern, moving dramatically lower and that lows near $65 may become the ultimate bottom for that move. Here we are with a price below that level and many are asking “where will it go from here?”.
We believe the support near $65, although clearly broken, may eventually become resistance for a future upside price move. Our proprietary Fibonacci price modeling system is suggesting a new target near $52~53 and we believe this downside move in Oil is far from over at this point.
The current global climate for Oil is that suppliers are pumping more and more oil into the market at a time when, historically, prices should continue to decline. One of our research tools includes the ability to identify overall bias models for each week, month or quarter. Historically, Oil is dramatically weaker in the month of November and relatively flat for the month of December.
Analysis for the month of November = 11
Total Monthly Sum : -44.52000000000001 across 36 bars
Analysis for the month of December = 12
Total Monthly Sum : -0.699999999999922 across 36 bars
We believe the price of oil will continue to drift lower to target the $52~53 Fibonacci support level before attempting to find any real price support. This equates to an addition -6 to -8% price decline for skilled traders. We will alert you with a new research post as this downward price move continues or new research becomes available.
We have been calling these types of market moves all year and recently called the top in the US Equity markets nearly 40 days before it happened. Want to know what we think is going to happen for the rest of 2018 and into early 2019? Visit www.TheTechnicalTraders.com/FreeResearch/ to read all of our public research posts. Isn’t it time you invested in a team of researchers and tools to assist you in finding greater trading success?
As we can see in the H4 chart, after reaching the retracement of 38.2%, XAUUSD has started a new descending impulse. The possible targets may be the retracements of 61.8% and 76.0% at 1191.94 and 1180.24 respectively. However, the key short-term target is the low at 1160.13. The local resistance is the high at 1243.41. If the price breaks it, the instrument may continue growing to reach the retracement of 50.0% at 1262.50.
In the H1 chart, the pair is trading downwards to reach the retracement of 50.0% at 1201.84.
USDCHF, “US Dollar vs Swiss Franc”
As we can see in the H4 chart, after being corrected by 23.6%, USDCHF has started a new rising impulse. If the price breaks the high at 1.0095 and fixes above it, the instrument may continue trading towards the post-correctional extension area between the retracements of 138.2% and 161.8% at 1.0149 and 1.0184 respectively.
In the H1 chart, the pair is testing the high. Possibly, the price may break it and then continue growing towards the post-correctional extension area between the retracements of 138.2% and 161.8% at 1.0149 and 1.0184 respectively.
Attention! Forecasts presented in this section only reflect the author’s private opinion and should not be considered as guidance for trading. RoboForex LP bears no responsibility for trading results based on trading recommendations described in these analytical reviews.
EURUSD is forming the fifth descending wave; it has already reached the target of this wave’s first structure. Possibly, the price may be corrected towards 1.1380 and then resume falling with the short-term predicted target at 1.1265. After that, the instrument may test 1.1300 from below and then resume trading inside the downtrend with the main target at 1.1150.
GBPUSD, “Great Britain Pound vs US Dollar”
GBPUSD is also forming the fifth descending wave; it has already reached the target of this wave’s first structure. Possibly, today the pair may start a new correction to 1.3053 and then resume falling to reach the short-term predicted target at 1.2800. Later, the market may test 1.2913 from below and then resume trading inside the downtrend towards the main target at 1.2655.
USDCHF, “US Dollar vs Swiss Franc”
USDCHF is still growing; it is forming the first structure of the fifth ascending wave. The target is at 1.0170. After that, the instrument may be corrected towards 1.0063 and then start another growth to reach the short-term target at 1.0266.
USDJPY, “US Dollar vs Japanese Yen”
USDJPY has reached the target of the fifth ascending structure. Possibly, today the price may consolidate near the highs. If later the pair breaks 113.64 to the downside, the instrument may form a new descending structure with the first target at 112.57. Later, the market may resume growing towards 113.64.
AUDUSD, “Australian Dollar vs US Dollar”
AUDUSD is forming the first descending wave with the target at 0.7205. After that, the instrument may start a new correction to reach 0.7252 and then resume trading inside the downtrend with the short-term target at 0.7137.
USDRUB, “US Dollar vs Russian Ruble”
USDRUB is still growing. Possibly, the price may be corrected towards 68.10. Today, the pair may consolidate near the current levels. If later the instrument breaks this range to the downside, the market may form one more descending structure to reach 66.50 and then resume growing to return to 68.10.
XAUUSD, “Gold vs US Dollar”
Gold is falling towards 1206.30. After that, the instrument may resume growing to reach 1220.20 and then start another decline with the target at 1200.00. The market is expected to form the five-wave Flag correctional pattern.
BRENT
Brent has returned to 71.38. Today, the pair may fall to reach 70.30, thus forming a new consolidation range. If later the instrument breaks this range to the upside, the price may start a new correction to reach 73.50; if to the downside – expand the range towards 68.50.
Attention! Forecasts presented in this section only reflect the author’s private opinion and should not be considered as guidance for trading. RoboForex LP bears no responsibility for trading results based on trading recommendations described in these analytical reviews.
The EUR/USD currency pair is showing an aggressive sell-off. Today during the Asian trading session the quotes have fallen by more than 80 points. EUR has updated the annual minimums. At the moment, the local support and resistance levels are 1.12400 and 1.12800. The demand for the USD remains high. The trading instrument can descend further.
Today the Economic News Feed for 12.11.18 is calm.
The indicators point towards the power of the buyers: the price is over 50 МА and 200 МА.
The MACD histogram is in the negative zone and below the signal line, which indicates a bearish mood.
The Stochastic Oscillator is in the overbought zone, the %K line is below the %D line, which gives a weak signal towards the sale of EUR/USD.
Trading recommendations
Support levels: 1.12400, 1.12000
Resistance levels: 1.12800, 1.13000, 1.13400
If the price fixes below the local support of 1.12400, we can expect further sales of the EUR/USD quotes. The movement will tend towards 1.12000.
Alternatively, the price fixes above 1.12800 and you should look for the market entry points to open long positions. The movement will tend towards 1.13000-1.13400.
The GBP/USD currency pair
Technical indicators of the currency pair:
Prev Open: 1.30607
Open: 1.29182
% chg. over the last day: -0.65
Day’s range: 1.28403 – 1.29466
52 wk range: 1.2662 – 1.4378
The GBP/USD currency pair shows a negative trend. Today the descend of the quotes have exceeded 100 points. The trading instrument has updated the local maximums. At the moment, the key support and resistance levels are 1.28400 and 1.29000 respectively. Positions should be opened from these levels. We recommend you track the relevant data regarding Brexit.
Today the Economic News Feed for 12.11.18 is calm.
The indicators show the buyer’s strength: the price fixed below 50 MA and 200 MA.
The MACD histogram is in the negative zone, below the signal line, which gives a strong signal towards the sale of GBP/USD.
The Stochastic Oscillator is in the overbought zone, the %L line crossed the %D line. There are no signals at the moment.
Trading recommendations
Support levels: 1.28400, 1.27800
Resistance levels: 1.29000, 1.29500, 1.30300
If the price fixes below the local support 1.28400, we can expect further descend of the GBP/USD currency pair. The movement will tend toward 1.28000-1.27800.
Alternatively, the quotes can recover to the mirror support level of 1.29500.
The USD/CAD currency pair
Technical indicators of the currency pair:
Prev Open: 1.31552
Open: 1.32034
% chg. over the last day: +0.45
Day’s range: 1.31827 – 1.32113
52 wk range: 1.2248 – 1.3387
The USD/CAD is showing a bullish sentiment. At the moment, it is consolidating around the monthly maximums. Local support and resistance levels are 1.31800 and 1.32100 respectively. Positions should be opened from these levels. The USD/CAD quotes can grow further.
Today the Economic News Feed for 12.11.18 is calm.
The price fixed above 50 MA and 200 MA, which signals the buyers’ strength.
The MACD histogram is in the positive zone, but below the signal line, which gives a weak signal towards the purchase of USD/CAD.
The Stochastic Oscillator is near the overbought zone, the %K line crosses the %D line. There are no precise signals.
Trading recommendations
Support levels: 1.31800, 1.31450, 1.31200
Resistance levels: 1.32100, 1.32300
If the price fixes above 1.32100, we recommend you look into purchasing USD/CAD. The movement will tend toward 1.32400-1.32600.
Alternatively, the USD/CAD currency pair can descend to 1.31600-1.31400.
The USD/JPY currency pair
Technical indicators of the currency pair:
Prev Open: 114.057
Open: 113.794
% chg. over the last day: -0.20
Day’s range: 113.785 – 114.207
52 wk range: 104.56 – 114.74
The USD/JPY quotes show a positive trend. At the moment, the trading instrument is testing the local resistance 114.200. 113.800 is the nearest support. The demand for the USD is at the same level. The currency pair can grow further. We recommend you keep an eye on the US government bonds’ yield. Positions should be opened from the key levels.
Today the Economic News Feed for 12.11.18 is calm.
The price fixed above 50 MA and 200 MA, which indicates the buyers’ power.
The MACD histogram is in the positive zone and above the signal line, which provides a strong signal towards the purchase of USD/JPY.
The Stochastic Oscillator is in the neutral zone, the %L line is below the %D line, which indicates a bearish sentiment.
Trading recommendations
Support levels: 113.800, 113.400, 113.000
Resistance levels: 114.200, 114.500
If the price fixes above the support level 114.200, we can expect the growth of the quotes. The movement will tend toward 114.500-114.750.
Alternatively, the USD/JPY currency pair can descend toward 113.600-113.400.
The USD keeps strengthening against the basket of world currencies. The USD index (#DX) has updated the annual maximums and went over 97. The demand for the USD is kept by the prospects of increasing the key interest rate. At the moment, more than 75% of the market participants are sure that it will happen in December. Additional support is provided by the positive economic reports. October’s Producer Price Index reached +0.6%, which is above the expectations of +0.2%.
EUR and GBP are still under pressure due to the conflicts regarding the budget of Italy and the Brexit conundrum. The investors are waiting for the new information regarding the US and China trading conflict. The key events this week are the statement by the Head of the Federal Reserve and a series of economic reports from the US.
The quotes on oil are recovering after a long fall. Currently, the WTI futures are trading at $61.15.
Market Indicators
This Friday the US stock market was showing a bearish sentiment: #SPY (-0,98%), #DIA (-0,77%), #QQQ (-1,69%).
The 10-year US government bonds yield is 3.18-3.19%.
On Friday the 9th of November, trading on the EURUSD pair closed down. The euro took a dive on the back of a broadly stronger dollar, along with a weakening pound and Canadian dollar, which dragged the market down with it.
Today, the euro dropped from 1.1369 to 1.1316. The British pound has fallen to 1.2958. This drop came after reports of UK Minister for London Jo Johnson’s resignation, who left his post saying that he cannot support the government’s Brexit deal.
Day’s news (GMT+3):
12:00 Eurozone: ECB Vice President Luis de Guindos speech.
22:30 US: FOMC member Daly speech.
24-hr US: Veterans Day.
Fig1. EURUSD daily chart.
Current situation:
On Monday, the dollar continued on its upwards trajectory against the majors, including the euro. The pound is falling and dragging all other currencies down with it. The dollar is being propped up by expectations of further interest rate hikes.
The EURUSD pair has dropped to 1.1269 today. I’ve shown the daily chart above in order for you get a better idea of the bigger picture. The trend line was broken through on the 24th of October. The bulls tried, and failed, to get the rate back to this level. The rate instead dropped to 1.1268, and is currently sitting around the lower line of the B-B channel.
The economic calendar is virtually empty today. There’s a small chance of a rebound from the line. If we look at the bigger picture, the euro looks poised to drop to 1.1050. 1.1160 will provide some intermediate resistance.
EURAUD continues to be in my crosshairs – the breakdown of the 200-day moving average last week has continued to roll through and with the economic data due this week likely to see a dampener on the EUR and a positive on the AUD I expect the downside movement in the pair to continue.
The Economic events –
European inflation: CPI
• CPI in the EU remains flat at around 1.2% to 1.4% year on year. The ECB makes CPI out to be positive ‘enough’ to justify ending its QE programs. However, it is still an on way from its target 2% level, particularly when you look at the overall tone of EU growth.
• The ‘renaissance’ that was expected of Europe this year just hasn’t materialized, as possible negative trade issues with the US flared and the EU periphery continued to flounder. This year has also been compounded by the Italian elections and populist movements in Germany, France, and Spain threatening EU stability across the board.
• Even Germany the largest economy in the EU is flattening, and that is despite the fact its ‘engine room’ Bavaria, has seen inflation hitting around 2.4%, as the ‘perfect storm’ hits its high-end manufacturing plays (automakers) and the services sectors flatline.
Inflation, therefore, is unlikely to gap up anytime soon leaving the ECB with no choice but to continue with its high accommodative monetary policy stance.
EUR likely to weaken.
AUD – Labour booming and unemployment falling
• Labour force market is booming: over the past year Australia has added 291,000 jobs or 2.4% in the past 52 weeks, it is over 500,000 if we look back at the past 2 years. 186,000 full term jobs have been created over the year to October with over 310,000 in the 24 months to October. Come Thursdays the expected change in the labor force figures is for 20,000 jobs created according to the latest Reuters poll – AUD positive initially.
• The unemployment rate has been falling steadily since peaking in October 2014. However, that fall has begun to steepen this year as the slack in the employment market tightened. The structural 0.3% move seen this year is strong, sustained and is steepening – Thursday’s unemployment rate is forecasted to be 5.1% on a trend basis down from 5.2% according to the Reuters poll this would confirm my AUD bias in EURAUD.
• The final part of the employment puzzle is hours worked, this has been rising solidly. Increased hours is a sign that employees are working and looking to work more – it has a strong correction to wages, the increase in hours should mean an increase in wages. This is a CPI inflator, and an AUD positive.
Therefore I suspect that this week EURAUD will be one of the more interesting pairs to watch, however when trading currencies off the back of economic releases it always prudent to have stopped in place and be wary of gapping.
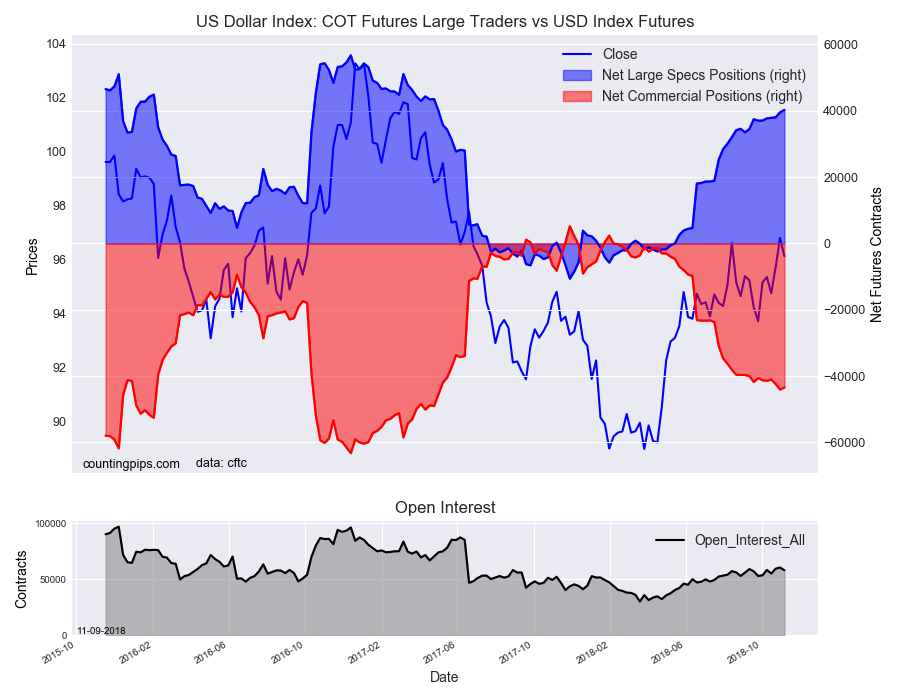
US Dollar Index speculator positions go higher once again this week
Large currency speculators continued to raise their bullish bets for the US Dollar Index futures markets while sharply cutting back on their Euro and Mexican peso bets this week, according to the latest Commitment of Traders (COT) data released by the Commodity Futures Trading Commission (CFTC) on Friday. See full article
The non-commercial contracts of WTI crude futures totaled a net position of 403,783 contracts, according to data from this week. This was a slide of -28,855 contracts from the previous weekly total. See full article
The large speculator contracts of gold futures totaled a net position of 19,026 contracts. This was a weekly advance of 5,832 contracts from the previous week. See full article
The large speculator contracts of 10-year treasury note futures totaled a net position of -539,186 contracts. This was a weekly reduction of -36,347 contracts from the previous week. See full article
The large speculator contracts of S&P500 Mini futures totaled a net position of 198,022 contracts. This was a decrease of -64,986 contracts from the reported data of the previous week. See full article
The non-commercial contracts of silver futures totaled a net position of -2,470 contracts, according to data from this week. This was a weekly gain of 6,000 contracts from the previous totals. See full article
The large speculator contracts of copper futures totaled a net position of 6,386 contracts. This was a weekly boost of 5,719 contracts from the data of the previous week. See full article
The Commitment of Traders report data is published in raw form every Friday by the Commodity Futures Trading Commission (CFTC) and shows the futures positions of market participants as of the previous Tuesday (data is reported 3 days behind).
US Dollar Index speculator positions go higher once again this week
Large currency speculators continued to raise their bullish bets for the US Dollar Index futures markets while sharply cutting back on their Euro and Mexican peso bets this week, according to the latest Commitment of Traders (COT) data released by the Commodity Futures Trading Commission (CFTC) on Friday.
The non-commercial futures contracts of US Dollar Index futures, traded by large speculators and hedge funds, totaled a net position of 40,282 contracts in the data reported through Tuesday November 6th. This was a weekly rise of 759 net contracts from the previous week which had a total of 39,523 net contracts.
This week’s net position was the result of the gross bullish position tumbling by -1,564 contracts to a weekly total of 48,295 contracts but being more than offset by the gross bearish position which saw a decline by -2,323 contracts for the week to a total of 8,013 contracts.
The speculative US Dollar Index position continued to steadily rise for a sixth straight week and has now advanced higher for the twenty-seventh time out of the past twenty-nine weeks. The current bullish standing is above the +40,000 net contract level for the first time since May of 2017.
Individual Currencies Data this week: Euro and Peso bets fall sharply
In the other major currency contracts data, we saw two substantial changes (+ or – 10,000 contracts) in the speculators category this week.
Euro bets fell sharply this week by over -14,000 contracts and have gone lower for six consecutive weeks. The current standing for the euro is now at the most bearish level since March 7th of 2017 when the net position totaled -59,501 contracts.
The Mexican peso contracts continued to decline sharply by over -26,000 contracts this week. The peso bets have dropped lower for four straight weeks and by a total of -67,413 over that time period. Despite these recent shortfalls, the peso does still remain in a small bullish position (+7,036 contracts) but is now at the lowest bullish standing of the past eighteen weeks.
Overall, the major currencies that improved this week were the US Dollar Index (759 weekly change in contracts), Japanese yen (2,498 contracts), Canadian dollar (7,023 contracts), Australian dollar (3,967 contracts) and the New Zealand dollar (9,305 contracts).
The currencies whose speculative bets declined this week were the euro (-14,181 weekly change in contracts), British pound sterling (-4,317 contracts), Swiss franc (-5,426 contracts) and the Mexican peso (-26,773 contracts).
Other Notables for the week:
Canadian dollar positions improved this week by 7,023 contracts and have now seen improvements for six out of the past seven weeks. The current speculative standing is now at the lowest bearish level since March 20th of 2017. The CAD position remains in a very small bearish standing (-2,632 contracts) and could cross over into bullish territory soon.
The New Zealand dollar position rebounded this week with one of the best weeks in a long time. NZD net positions rose by 9,305 contracts this week which was the most in 33 weeks and brought the overall bearish standing under the -30,000 contract level for the first time since the beginning of September.
See the table and individual currency charts below.
Table of Weekly Commercial Traders and Speculators Levels & Changes:
Currency
Net Commercials
Comms Weekly Chg
Net Speculators
Specs Weekly Chg
EuroFx
21,552
6,947
-46,843
-14,181
GBP
69,869
-2,301
-56,799
-4,317
JPY
113,442
5,980
-89,122
2,498
CHF
40,694
5,842
-19,948
-5,426
CAD
921
-7,551
-2,632
7,023
AUD
83,824
-9,578
-66,445
3,967
NZD
29,252
-9,846
-25,726
9,305
MXN
-8,641
26,777
7,036
-26,773
This latest COT data is through Tuesday and shows a quick view of how large speculators or non-commercials (for-profit traders) as well as the commercial traders (hedgers & traders for business purposes) were positioned in the futures markets. All currency positions are in direct relation to the US dollar where, for example, a bet for the euro is a bet that the euro will rise versus the dollar while a bet against the euro will be a bet that the dollar will gain versus the euro.
Weekly Charts: Large Trader Weekly Positions vs Price
EuroFX:
British Pound Sterling:
Japanese Yen:
Swiss Franc:
Canadian Dollar:
Australian Dollar:
New Zealand Dollar:
Mexican Peso:
*COT Report: The weekly commitment of traders report summarizes the total trader positions for open contracts in the futures trading markets. The CFTC categorizes trader positions according to commercial hedgers (traders who use futures contracts for hedging as part of the business), non-commercials (large traders who speculate to realize trading profits) and nonreportable traders (usually small traders/speculators). Find CFTC criteria here: (http://www.cftc.gov/MarketReports/CommitmentsofTraders/ExplanatoryNotes/index.htm).
The Commitment of Traders report is published every Friday by the Commodity Futures Trading Commission (CFTC) and shows futures positions data that was reported as of the previous Tuesday (3 days behind).
Each currency contract is a quote for that currency directly against the U.S. dollar, a net short amount of contracts means that more speculators are betting that currency to fall against the dollar and a net long position expect that currency to rise versus the dollar.
(The charts overlay the forex closing price of each Tuesday when COT trader positions are reported for each corresponding spot currency pair.) See more information and explanation on the weekly COT report from the CFTC website.
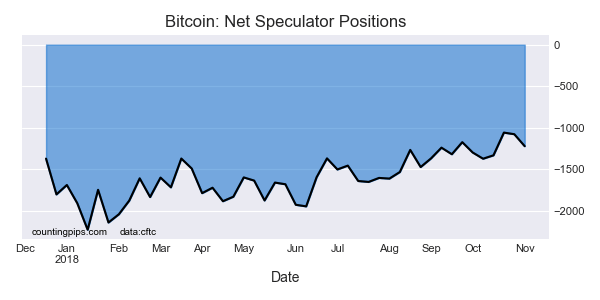
Large cryptocurrency speculators pushed their bearish net positions higher in the Bitcoin futures markets this week, according to the latest Commitment of Traders (COT) data released by the Commodity Futures Trading Commission (CFTC) on Friday.
The non-commercial futures contracts of Bitcoin futures, traded by large speculators and hedge funds, totaled a net position of -1,221 contracts in the data reported through Tuesday November 6th. This was a weekly change of -144 net contracts from the previous week which had a total of -1,077 net contracts.
This week’s net position was the result of the gross bullish position falling by -183 contracts to a weekly total of 1,492 contracts compared to the gross bearish position total of 2,713 contracts which saw a reduction by just -39 contracts for the week.
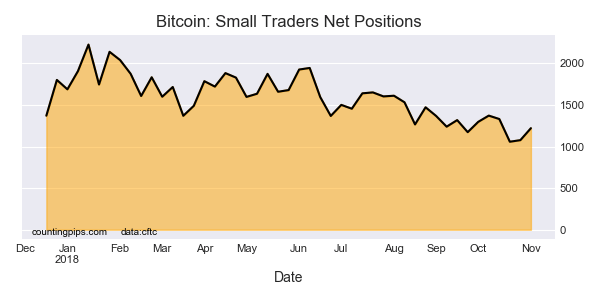
The speculative Bitcoin position has now had increasing bearish net positions for two straight weeks. The spec position, despite two weeks of rising bearish bets, remains to be at the lower end (less bearish) of its range since the beginning of bitcoin futures trading. Meanwhile, the small traders position, which is on the opposite side of this market from the speculators, raised their existing bullish positions higher this week by an equally offsetting 144 contracts to a current bullish level of 1,221 net contracts.
Bitcoin Futures COT Data is Speculators vs Small Traders
The Bitcoin futures data is in its forty-seventh week since the start of the cryptocurrency futures data releases on December 19th 2017. The data includes trader classifications of only speculators and small traders and without any commercial traders (typically business hedgers or producers of a commodity).
Speculators started off and have remained on the bearish side since the beginning of the bitcoin data releases while the small traders have continued to be on the bullish side of this cryptocurrency market.
Bitcoin Futures:
Over the same weekly reporting time-frame, from Tuesday to Tuesday, the Bitcoin Futures (Front Month) closed at approximately $6415 which was a rise of $170 from the previous close of $6245, according to crypto marketing agency data.
*COT Report: The COT data, released weekly to the public each Friday, is updated through the most recent Tuesday (data is 3 days old) and shows a quick view of how large speculators or non-commercials (for-profit traders) as well as the commercial traders (hedgers & traders for business purposes) were positioned in the futures markets. The CFTC categorizes trader positions according to commercial hedgers (traders who use futures contracts for hedging as part of the business), non-commercials (large traders who speculate to realize trading profits) and nonreportable traders (usually small traders/speculators). Find CFTC criteria here: (http://www.cftc.gov/MarketReports/CommitmentsofTraders/ExplanatoryNotes/index.htm).