In this piece, we will describe the situation on EURCHF, where a week ago we were waiting for a buy signal. We did not say that there’d be a buy signal right now, but we acknowledged the possibility: “As long as we stay below the Fibo mentioned above, sentiment will remain negative, but the breakout of this line will give us a proper buy signal.” This is what we wrote back then.
Patience is the virtue of every trader. Usually, you need to wait for the proper signal. In this case, it did not happen and the price dipped lower. Thursday was decisive here. The price broke the lower line of the flag and the short-term horizontal support. That gave a boost to the sellers and cleared the way south. Monday is bringing us a breakout of the green line connecting the bottom of the head and the right shoulder. That represents the total cancellation of the positive sentiment and opens the way for us towards new yearly lows.
The sell signal will be cancelled when there is a breakout at the black line. That resistance has been connecting the most important lower highs since April. The chances of that are rather slim.
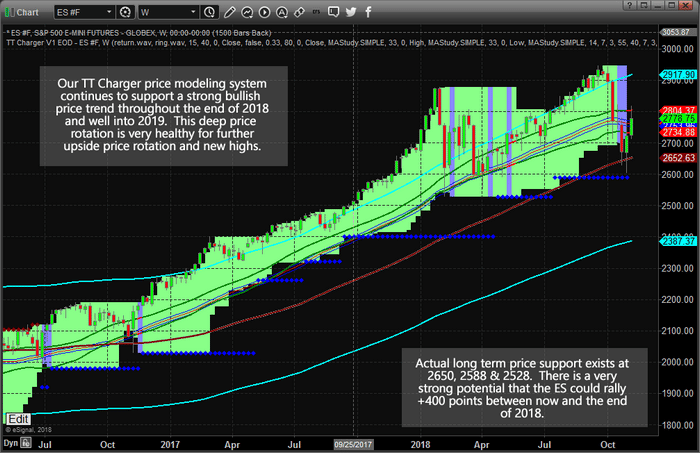
We are pleased to bring this new analysis to everyone’s attention because we strongly believe the bears and the shorts are in for a wild ride throughout the rest of 2018. Our research team, at www.TheTechnicalTraders.com, have gone over the chart using our advanced predictive and price modeling tools and we are going to show you why we believe the ES could rally +400 points or more before the end of 2018 – leaving the shorts/bears wishing they had read this research.
Before we get too carried away, we need to highlight one thing regarding the current price setup we are illustrating with these charts. A “Price Anomaly” has setup because of this deep October 2018 price correction. This move has resulted in many industry researchers calling for further downside price action as they fear the beginning of a far deeper price decline in the future. We believe this conclusion is absolutely false. The price anomaly is the result of effective price rotation within volatility ranges that are acceptable to continue the current upward/bullish price trend and our modeling/research applications are suggesting we are about to see a +400 point rally in the ES (+11% or more; likely targeting 3100 or higher).
Let’s get into the charts and the data.
First, our TT Charger price modeling tool on an ES Weekly chart shows how volatility and price work hand-in-hand to create acceptable ranges of price rotation while still maintaining price trends. At this point, on the hard right edge of the chart, we can see the Oct 2018 deep price rotation fell to near our support levels (near 2650 & 2588) before rebounding higher over the past two weeks. Within this type of Price Anomaly setup, it is not uncommon for the price to “over-shoot” the targets before rebounding back towards the target levels.
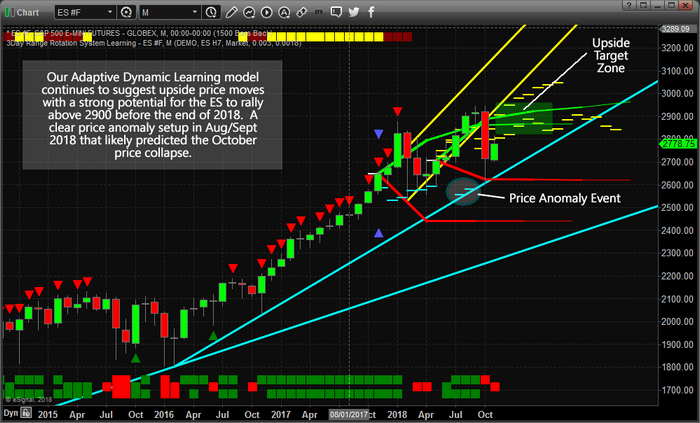
This chart showing out Adaptive Dynamic Learning price modeling system highlights the “Price Anomaly” event as well as highlights the upside price ranges/targets that we are expecting to play out over the next few months. Please pay special attention to the Aug/Sept 2018 price targets below 2600 that represent the Price Anomaly. When our predictive modeling systems identify outliers like this, it usually means there is a potential for a price anomaly event to occur. We call it a price anomaly event because the price may rotate and target these outlier areas in a broader price trend (in this case higher). This type of setup creates an incredible opportunity for skilled traders to trade the reversion price trend, higher in this case, after the price anomaly event is completed.
As you can see from this chart, we are expecting the price to recover quickly to near 2900 with a strong potential for higher prices in early 2019.
Before we continue, we want to share some data that supports our research and to alert you as to why we believe this upside price move could be dramatic and very profitable for skilled traders. One of the tools we use is a Probability Factoring Model while helps us understand what to expect in future price periods (Weeks, Months, Quarters). This tool helps us to understand if there is a predominant bias in price over a certain period of time or not. For example, it identified that October and November are typically very weak for Crude Oil and alerted us to the potential of falling oil prices in late September 2018. Right now, these are the results for November and December 2018.
– Total Monthly NEG : -121.5 across 4 bars – Avg = -30.38
– Total Monthly POS : 542.25 across 17 bars – Avg = 31.90
By reviewing this analysis, we can see that for the month of November 2018, the bias is clearly positive (17 bars positive vs. 5 negative; 3:1 ratio) and the upside price activity clearly outperforms the downside price activity (+751.25 vs. -266.50). Resulting in a +484.75 upside bias result. For December 2018, the results are equally impressive. A 4:1 upside bias ratio with a +420.75 upside bias result.
Please keep in mind that these results DO NOT mean the ES is going to climb 900 points between now and the end of the year. What we can pull from these results is that there is a clear upside price bias for both months and that we should expect, roughly, at least 50% of this pricing bias to materialize. This means about 200~220 points in November and about 180~200 points in December – totaling about 400+ points overall. Anything beyond that would be considered an extended price move higher based on this research.
Additionally, we would like to disclose that these analysis tools do not guarantee anything in terms of future price activity. We can’t attempt to guarantee any future price moves or activity based on our research. We simply attempt to use our proprietary tools to assist our members and followers in an attempt to stay ahead of these market moves so we can profit from them.
It is our opinion that the markets are poised for an incredible upside price advance from the correlative and combined research presented by our proprietary price modeling and adaptive learning systems. It is hard to argue the facts that the price anomaly predicted this downside price rotation when we called this move on September 17th (nearly 45 days before it actually happened). At that time, we called for an “ultimate price bottom” to occur between November 8 and November 12. After that, we expected the markets to rally into the end of 2018 and well into 2019. You can read all of our public research by visiting www.TheTechnicalTraders.com/FreeResearch/.
Our members are kept aware of these trends, rotations, cycles, rotations, and setups every day with our Daily videos and other research posts. Additionally, we issue very clear trade alerts to our members so they can take advantage of timely trading signals for profits. Get ready for an incredible end to 2018 and a fantastic 2019 by joining our other members in creating greater success at TheTechnicalTraders.com.
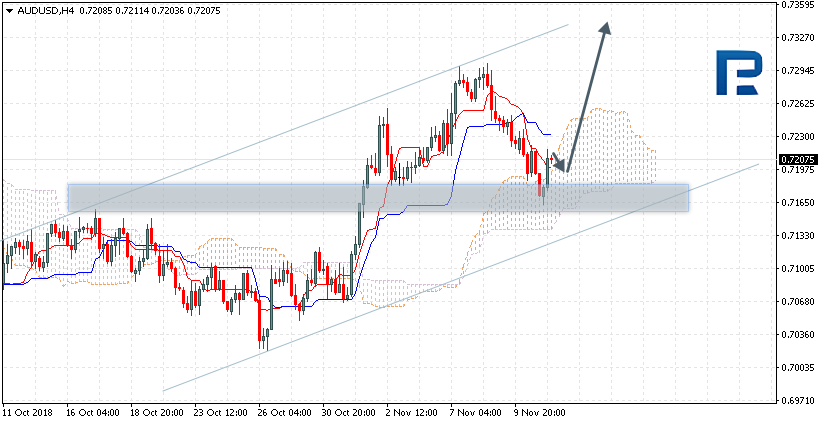
AUDUSD is trading at 0.7207; the instrument is moving above Ichimoku Cloud, thus indicating an ascending tendency. The markets could indicate that the price may test the upside border of the cloud at 0.7200 and then resume moving upwards to reach 0.7335. Another signal to confirm further ascending movement is the price’s rebounding from the support level. However, the scenario that Implies further growth may be cancelled if the price breaks the downside border of the cloud and fixes below 0.7130. In this case, the pair may continue falling towards 0.7025.
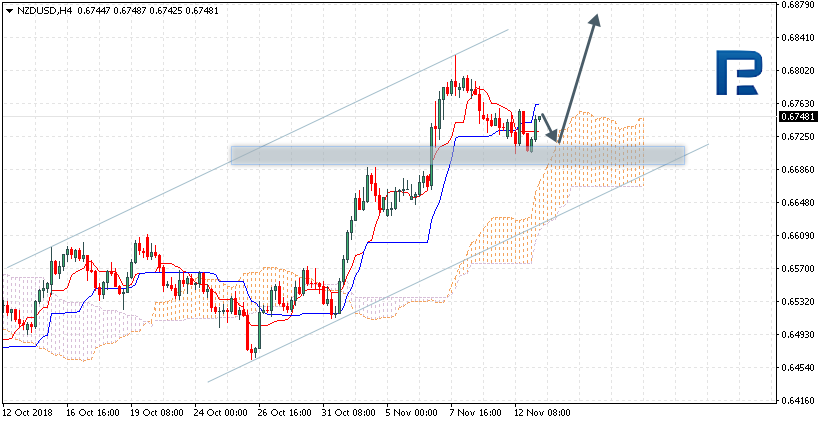
NZDUSD, “New Zealand Dollar vs US Dollar”
NZDUSD is trading at 0.6748; the instrument is moving above Ichimoku Cloud, thus indicating an ascending tendency. The markets could indicate that the price may test the upside border of the cloud at 0.6725 and then resume moving upwards to reach 0.6870. Another signal to confirm further ascending movement is the price’s rebounding from the support level. However, the scenario that Implies further growth may be cancelled if the price breaks the downside border of the cloud and fixes below 0.6645. In this case, the pair may continue falling towards 0.6555.
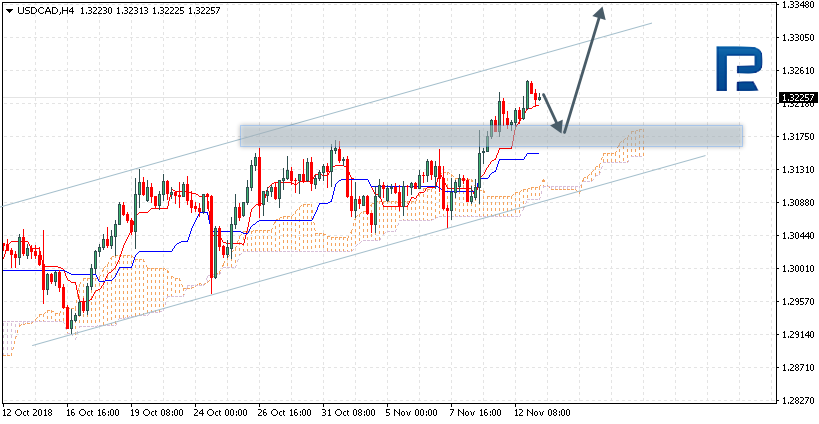
USDCAD, “US Dollar vs Canadian Dollar”
USDCAD is trading at 1.3225; the instrument is moving above Ichimoku Cloud, thus indicating an ascending tendency. The markets could indicate that the price may test Tenkan-Sen and Kijun-Sen at 1.3180 and then continue moving upwards to reach 1.3345. Another signal to confirm further ascending movement is the price’s rebounding from the support level. However, the scenario that implies further growth may be cancelled if the price breaks the downside border of the cloud and fixes below 1.3085. In this case, the pair may continue falling towards 1.2995.
Attention! Forecasts presented in this section only reflect the author’s private opinion and should not be considered as guidance for trading. RoboForex LP bears no responsibility for trading results based on trading recommendations described in these analytical reviews.
As we can see in the H4 chart, EURUSD is testing another support level and forming Hammer, Harami, and Inverted Hammer reversal patterns. Judging by the previous movements, at the moment it may be assumed that after finishing the pullback the instrument will continue trading downwards.
USDJPY, “US Dollar vs. Japanese Yen”
As we can see in the H4 chart, USDJPY is still testing the resistance level and forming Hanging Man, Doji, and Shooting Star reversal patterns. Judging by the previous movements, at the moment it may be assumed that after testing the level the instrument may continue its ascending tendency.
Attention! Forecasts presented in this section only reflect the author’s private opinion and should not be considered as guidance for trading. RoboForex LP bears no responsibility for trading results based on trading recommendations described in these analytical reviews.
EUR is consolidating around the annual minimums. The key support and resistance levels are 1.12200 and 1.12600. The conflict between the EU and Italy remains in the spotlight. Nonetheless, a technical correction is possible soon. You should open positions from the key levels.
At 12:00 (GMT+2:00) an Economic Sentiment Index by ZEW will be published in Germany.
The indicators show the buyers` strength: the price fixed below 50 MA and 200 MA.
The MACD histogram is in the red but above the signal line, which gives a weak signal towards a sell-off of EUR/USD.
The Stochastic Oscillator is in the neutral zone, the %K line is below the %D line, which indicates a bearish sentiment.
Trading recommendations
Support levels: 1.12200, 1.12000, 1.11500
Resistance levels: 1.12600, 1.13000, 1.13400
If the price fixes below the support line 1.12200, we can expect further descend of the EUR/USD quotes. The movement will tend toward 1.11750-1.11500.
Alternatively, the price fixes above 1.12600, we can expect a correction of the EUR/USD. The movement will tend toward the round 1.13000.
The GBP/USD currency pair
Technical indicators of the currency pair:
Prev Open: 1.29182
Open: 1.28475
% chg. over the last day: -0.65
Day’s range: 1.28349 – 1.28970
52 wk range: 1.2662 – 1.4378
GBP/USD shows an uncertain technical picture. The pound is being traded in flat. The local support and resistance are 1.28400 and 1.29000. Positions should be opened from the key levels. The market participants are waiting for important stats from GB and new data regarding the Brexit process.
At 11:30 (GMT+2:00) we expect a Labour Market report from Great Britain.
The indicators point towards the power of the buyers, the price fixed below 50 MA and 200 MA.
The MACD histogram is in the negative zone but above the signal line, which gives a weak signal towards the purchase of GBP/USD.
The Stochastic Oscillator is in the neutral zone, the %K line is below the %D line, which indicates a bearish sentiment.
Trading recommendations
Support levels: 1.28400, 1.27800
Resistance levels: 1.29000, 1.29500, 1.30300
If the price fixes below the local support 1.28400, we can expect further descend of the GBP/USD currency pair. The movement will tend toward 1.28000-1.27800.
Alternatively, the quotes can recover to the mirror support level of 1.29500.
The USD/CAD currency pair
Technical indicators of the currency pair:
Prev Open: 1.32034
Open: 1.32434
% chg. over the last day: +0.37
Day’s range: 1.32152 – 1.32481
52 wk range: 1.2248 – 1.3387
The USD/CAD currency pair keeps testing the monthly maximums. The local support and resistance are 1.32150 and 1.32500 respectively. The trading instrument has good growing prospects. Positions should be opened from the key levels. Also, keep an eye on the oil quotes` pricing.
The news feed for Canada is calm for today.
The indicators point towards the power of the buyers: the price fixed above 50 MA and 200 MA.
The MACD histogram is in the positive zone but below the signal line, which gives a weak signal towards the purchase of USD/CAD.
The Stochastic Oscillator is in the neutral zone, the %K line is above the %D line, which indicates a bullish sentiment.
Trading recommendations
Support levels: 1.32150, 1.31800, 1.31450
Resistance levels: 1.32500, 1.33000
If the price fixes above 1.32500 we recommend you to consider purchasing USD/CAD. The movement will tend toward the round 1.33000.
Alternatively, the currency pair can descend to 1.31800-1.31600.
The USD/JPY currency pair
Technical indicators of the currency pair:
Prev Open: 113.794
Open: 113.832
% chg. over the last day: -0.14
Day’s range: 113.580 – 114.130
52 wk range: 104.56 – 114.74
The last couple of sessions have had rather active USD/JPY trading. At the same time, there is no singular trend. The market participants are waiting for additional drivers. At the moment, the local support and resistance levels are 113.850 and 114.200. Positions should be opened from these levels.
No important economic statistics are expected from Japan today.
The price fixed above 50 MA and 200 MA, which indicates the power of the buyers.
The MACD histogram switched into the positive zone, which indicates a bullish sentiment.
The Stochastic Oscillator is in the neutral zone, the %K line has crossed the %D line. No signals are expected at the moment.
Trading recommendations
Support levels: 113.850, 113.600, 113.400
Resistance levels: 114.200, 114.500
If the price fixes above the resistance line 114.200 we can expect further growth towards 114.500-114750.
Alternatively the USD/JPY can descend towards 113.600-113.400.
The past few days for the euro have been pretty dramatic. All of the pairs with the euro as the base currency are in the red. In this piece, we will focus on the most popular instrument on the Forex market – EURUSD.
Last week was a real roller-coaster for this pair. In the first half of the week we received a buy signal, which was triggered by the inverse head and shoulders pattern (yellow) and the breakout of the neckline (upper blue). That bullish action got quickly denied and became a false breakout pattern. Instead of the iH&S formation, we finally got a flag (green lines). EURUSD broke the lower line of this pattern, which brought us a proper sell signal.
The beginning of this week brought us a further slide, which broke an important horizontal support – the psychological barrier at 1.13 (lower blue). As long as we stay below this line, sentiment will remain negative. According to the price action rules, that area could soon be tested as a new resistance. Any bearish price action on the blue line should be treated as an invitation to go south.
During the yesterdays’ trading, the USD has strengthened against the basket of major currencies once more. The USD index (#DX) set the new annual maximums and closed in the positive zone (+0.67%). Nonetheless, a technical correction is highly possible, since the investors can start fixing the positions. The financial market participants are waiting for the statement by the Head of the Federal Reserve and the publication of the important economic reports from the US.
A political conflict between the EU and Italy remains in the spotlight. On October 23, the EU refused to approve the Italian budget, and this week the official Rome will present a new one, which should fit better. The pound remains under pressure due to the uncertainty regarding Brexit. We are expecting important reports from Great Britain and Germany.
The oil market is showing an aggressive sell-off. The WTI futures are being traded at 59.25 USD/barrel.
Market Indicators
The US stock indices closed the trading session in the red: #SPY (-1,87%), #DIA (-2,26%), #QQQ (-3,03%).
The 10-year US government bonds yield is 3.18-3.19%.
The Economic News Feed for 13.11.2018:
– Labour Market Report (GB) – 11:30 (GMT+2:00);
– ZEW Indicator of Economic Sentiment (GER) – 12:00 (GMT+2:00).
Also keep an eye on the statements by the FOMC representatives.
In the past two years, crude oil has steadily advanced, supported by global recovery. But in just 10 days, oil has posted the longest losing streak since mid-1984 – thanks to overcapacity and the Trump trade wars.
Half a year ago, crude oil prices were expected to climb from $53 per barrel in 2017 to $65 per barrel by the year-end and to remain around that level through 2019. By mid-October, crude had soared to $75 and the rise was expected to continue.
Yet, in just 10 days oil has fallen to less than $60. Oil prices are in a bear market one month after four-year highs. The question is: Why?
Oil’s short-term fluctuations
The simple answer is that until mid-October the escalation of US-Sino trade tensions, despite President Trump’s vocal rhetoric, seemed to be manageable, which supported global prospects. Yet, the US mid-term elections have contributed to growing volatility and uncertainty.
Trump’s illicit decision to withdraw from the Iran nuclear deal (JCPOA) contributed to the upward oil trajectory, along with the expected supply disruptions in Venezuela which is amid domestic economic turmoil and US efforts at regime change.
As US-China tensions continue to linger and bilateral talks have not resulted in tangible results, expectations have diminished regarding the anticipated Trump-Xi meeting in late November. Consequently, global recovery no longer seems as solid as analysts presumed only recently. Even signs that OPEC and other oil producers including Russia could soon cut output have not put a floor under the market.
Also, Trump’s concession, after heavy pressure by Brussels, to allow Iran to remain connected to SWIFT, which intermediates the bulk of the world’s cross-border dollar-denominated transactions, has contributed to more subdued oil price trajectory.
Another supply-side force involves US crude inventories that have been swelling. These stockpiles rose by 5.7 million barrels toward the end of October, although gasoline and distillate supplies shrunk, according to American Petroleum Institute. US production is reportedly rising faster than previously projected.
But whether these near-term forces will prevail depends on longer-term structural conditions.
Global crisis and post-crisis fluctuations
At the eve of the global financial crisis in summer 2008, crude oil reached an all-time high of $145.31. As the bubbles burst, crude plunged to a low of $40; a level it first reached at the turn of the ‘80s, amid Iran’s Islamic Revolution.
During the global crisis in 2008-9, the US Fed and other central banks in the major advanced economies cut the interest rates to zero, while resorting to rounds of quantitative easing. Meanwhile, policymakers in advanced economies deployed fiscal stimulus packages to re-energize their economies. So, crude rose again until the mid-2010s, when the price still hovered above $100 per barrel.
That trajectory came to an abrupt end, when the Fed initiated the rate hikes and normalization policies, which strengthen the US dollar, whereas oil prices, which remain denominated in dollars, took a dramatic plunge. By early 2016, crude prices fell to less than $30 – below the crisis low only eight years before.
Crude prices were also hit by the “oil glut”, or surplus crude oil around 2014-15, thanks to critical volumes by the US and Canadian shale oil production, geopolitical rivalries among oil-producing nations, the eclipse of the “commodity super-cycle,” and perceived policy efforts away from fossil fuels. As meetings by the Organization of the Petroleum Exporting Countries (OPEC) failed to lower the ceiling of oil production, the result was a steep oil price meltdown.
Eventually, the 13-member oil cartel was able to agree on a ceiling. At the eve of the OPEC talks in Vienna in spring 2017, oil prices rose to $55. Riyadh needed stability to cope with domestic economic challenges and the war against Yemen. So it permitted Iran to freeze output at pre-sanctions levels. Russia supported the cuts because it remains dependent on oil revenues. The extension also benefited shale and gas producers in the US and the Americas.
Crude prices began to climb, but thanks to the OPEC agreement to cut production.
Oil’s longer-term structural prospects
Crude markets are under secular transformation. Bargaining power has shifted from advanced economies to emerging nations. US is producing record levels of shale. Renewables are capturing more space. Due to sluggish demand, further cuts loom in horizon as prices remain subdued.
Moreover, when dollar goes up, oil tends to come down. Oil is denominated in US dollars, whose strength is intertwined with the Fed’s policy rate. As long as the Fed will continue to hike rates, this will contribute to further turbulence, particularly in emerging economies amid energy-intensive economic development (Figure).
Figure How US Dollar Undermined Crude Gains, 2008-2018
In November 2017, OPEC agreed to extend oil supply cuts until the end of 2018. That fueled crude from low-$50s in spring 2017 to more than $70 last mid-October. In effect, crude mirrored the elusive global recovery, along with the prime indicators of global economic integration.
It was these positive horizons of world trade, investment and finance that contributed to steady gains of crude prices until mid-October – but then the fragile recovery crumbled.
When President Trump showed no inclination toward US-Sino reconciliation, hopes associated with world trade, investment and finance finally dissipated. And as the prospects of global recovery turned elusive, crude prices began a steady fall.
In the short-term, the status quo could change, but that would require effective reconciliation in US-Sino friction and the reversal of US sanctions and energy policies, among other things. In the long-term, significant changes would require sustained OPEC production ceilings, economic malaise in leading emerging economies, dramatic reversal in world trade, investment and finance and – most importantly – the end of the dollar-denominated oil regime and thus the eclipse of US-Saudi military-energy alignment.
Some of these changes are not economically viable. Some are desperately needed internationally. Still others are not likely to materialize without significant conflicts and geopolitical realignments.
Ironically, there was nothing inevitable about the dramatic reversal of oil prices in October. It was not based on economics. Rather, it was the effect of overcapacity and the Trump trade wars fueled by hollow dreams of an ‘America First’ 21st century.
That’s America’s policy mistake, but global economy will pay the bill.
About the Author:
Dr Dan Steinbock is an internationally recognized expert of the multipolar world and the founder of Difference Group Lt. He has served at India China and America Institute (USA), Shanghai Institutes for International Studies (China) and the EU Center (Singapore). For more, see https://www.differencegroup.net
On Monday the 12th of November, trading on the EURUSD pair closed down. The euro shed 1% against the greenback to reach 1.1216. This was facilitated by a strengthened dollar, in addition to increased demand for the safe haven assets. Investors are concerned over US-Sino trade relations, as well as the uncertainty over Italy and Brexit. The UK has failed to reach a breakthrough concerning the Irish border, while Italy remains defiant over its 2019 budget.
Since there were national holidays in the US and Canada, bond markets were closed. Activity was low on the Forex market. The major US indices took a dive, while the US dollar index made gains.
During Monday’s European session, our pair dropped to the D3 MA line (SMA with a period of 55 and a deviation of 1%). The pair rebounded from this line, but this was short-lived, and with a thin market given the day off in the US and Canada, the drop then continued with renewed vigour.
From 1.1216, the euro recovered to 1.1252. Considering that the stochastic indicator is up, I’m expecting a new wave of sales ahead of the US session. If the bears do everything right, I see nothing stopping them from reaching 1.1207.
If we draw a line through the minima 1.1240 and 1.1216, then the target for sellers is 1.1190. The targets on the daily timeframe are 1.1150 and 1.1025.
The European currency continues falling against the USD. Investors have been selling the pair for the fourth week in a row without making any significant pauses. On Monday, November 12th, EURUSD is testing the low close to 1.1250, the level it last reached on June 28th, 2017 and may probably continue trading downwards.
The key risks for the European currency remain the same. First of all, an unresolved problem with the Italian budget. From Italy’s point of view, everything is fine, but the European Commission is not comfortable with the budget deficit, which is increasing due to the expansion of expense items. Secondly, investors are very actively responding to an article in The Times about possible Brexit complications in the United Kingdom. The article said that several ministers were ready to resign from their positions and leave offices due to sharp differences in opinions and plans with the Prime Minister Theresa May.
These two things increase investors’ demand for “safe haven” assets with the USD being one of them.
At the same time, one should remember that the American currency is supported by strong labor market data along with the intention of the US Federal Reserve to increase the key interest rate for the fourth time this year in December.
At the beginning of the week, the USA is celebrating the Veterans Day. In this light, the economic calendar is almost empty and investors have to use existing drivers in their trading.
From the technical point of view, one should pay attention to several different timeframes and levels of the current tendency. The first thing worth mentioning is that a new descending impulse has broken the key low, thus indicating a continuation of the long-term downtrend. At the moment, the short-term downtrend is testing the support line of the main channel; it is moving towards the support level at 1.1175. After reaching it, the price may start a new correctional uptrend to reach the resistance line at 1.1355.
Disclaimer
Any predictions contained herein are based on the authors’ particular opinion. This analysis shall not be treated as trading advice. RoboForex shall not be held liable for the results of the trades arising from relying upon trading recommendations and reviews contained herein.