Author Archive for InvestMacro – Page 317

Global Economic Outlook after Trump-Xi Timeout

By Dan Steinbock  

As many hoped, the highly anticipated Trump-Xi meeting in the Buenos Aires G20 Summit resulted in a truce. The devil is in the details.

As the G20 Summit ended in Buenos Aires, the G20 official summit statement acknowledged flaws in global commerce, called for reforming the World Trade Organization (WTO) and deleted the word “protectionism” after U.S. resistance.

The statement was completed only after hours of diplomatic bargaining over the night. As far as the European Union (EU) was concerned, the U.S. was the lone holdout on almost every issue in Buenos Aires, particularly in climate change.

The G20 economies preferred a diluted final statement to further G20 division.

Tango in Buenos Aires

Following the summit’s close, Presidents Trump and Xi and their top aides met in a highly-anticipated dinner, which lasted longer than expected. Either there was magic dust in their grilled sirloin steaks paired with a malbec from the Argentine winery Catena Zapata. Or perhaps, just perhaps, reason finally prevailed.

Before Buenos Aires, Trump threatened to impose tariffs on an additional $267 billion in Chinese goods. He also indicated he would raise the existing tariff rate on $250 billion in Chinese imports from 10% to 25% on January 1.

According to early reports, U.S. and China agreed to put on hold new tariff increases. Following Buenos Aires, the White House said that, after a “highly successful meeting”, Trump had agreed to leave tariffs on U.S. products at a 10% rate after January 1, while China agreed to buy a substantial amount of products from the U.S.

The White House also said that China has agreed to start purchasing substantial U.S. agricultural, energy, industrial and other products from the U.S. to reduce the trade imbalance; and that the US and China agreed to try to reach an agreement on several trade issues “within the next 90 days.”

The first impression is that the Trump-Xi Summit may have achieved a critical truce, de-escalation of tensions, and possibly a path toward a long-term compromise.

The timeout came at the 11th hour.

Three trade-war scenarios

Last October, Roberto Azevêdo, Director of the World Trade Organization (WTO), said that the trade war between the U.S. and China was far from over. The speech preceded the release of the WTO Indicator, which suggested that trade growth is likely to slow further into the fourth quarter of 2018 and below-trend trade growth in the coming months.

After a sharp upswing in 2017, both exports and imports in Asia had held up very well year-to-date, with continued double-digit growth in many economies. But since the onset of Trump’s tariff wars in spring, elevated uncertainty has haunted the global economy.

According to WTO, merchandise trade volume growth was expected to reach 4.4% in 2018, which is still below the 2017 level. But as Trump’s tariffs have escalated tensions, a fall in business confidence and revised investment decisions may soften the outlook. Moreover, a full trade war could derail trade recovery for years.

According to the UN, global investment flows were projected to resume growth in 2017 and surpass $1.8 trillion in 2018. Thanks to U.S. neo-protectionism, they fell to $1.5 trillion last year. The current status quo looks even gloomier; especially with the trade tensions and central banks’ planned normalization.

Three scenarios illustrate the rising economic stakes of Trump’s tariff wars that have rapidly expanded from a bilateral trade conflict to a potential global trade war.

Last July, U.S. and China imposed 25% tariffs on $34 billion of the other’s imports and levies on another $16 billion. In this $50 billion Muddling Through Scenario, the tariff’s economic impact would have been limited to 0.1% of Chinese GDP and 0.2% of U.S. GDP, respectively.

Recently, Trump has threatened with further tariff escalation. In the ‘America First’ Scenario, the stakes will quadruple to $200 billion, with soaring collateral damage. In China, it could shave off 0.4% of GDP; in the U.S., 0.8% of GDP. 

If the stakes of the White House’s tariff war would escalate to $500 billion – Trump’s pre-Buenos Aires goal – the potential collateral damage would increase tenfold from the first scenario. In this Global Trade War Scenario, China’s GDP could take a hit of 1%, but the U.S. GDP would suffer a 2% impact.

How will these trade war scenarios impact global growth prospects?

Three global scenarios

As the global economy has passed its peak, thanks to rising interest rates and global trade tensions, each trade war scenario implies different growth prospects (Figure).

Figure   Trade War Scenarios: Risks to Global Outlook 

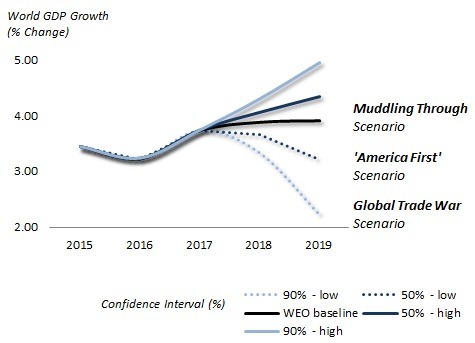
Sources: Difference Group (WEO/IMF growth data)


In the Muddling Through Scenario, both full trade war and ‘America First’ prospects are avoided. A good start would be a bilateral tariff truce starting in early 2019. But it is predicated on successful bilateral diplomacy that will lead to positive prospects in the second half of 2019. In this case, global growth prospects would remain close to the OECD/IMF baselines at around 3.5%-3.9% – possibly even higher.

In the ‘America First’ Scenario, neither truce nor diplomacy would prevail. After spring 2019, continued friction would result in progressive escalation and spillovers in global economy. As a result, global prospects would dampen as world GDP growth in 2019 would sink to 3% or worse.

In the Global Trade War Scenario, diplomacy would fail, while ‘America First’ escalation would spread across the world economy. Risks to global outlook would overshadow world GDP growth, which would plunge to 2%-2.5% for several years to come – which would translate to plunging world trade and investment, and new geopolitical conflicts.

High stakes

After Buenos Aires, the Global Trade War scenario has been temporarily suspended. Yet, the ‘America First’ scenario has not been fully reversed.

We’ve been there before. After the Trump-Xi Florida summit in April 2017, U.S. and China announced a 100-day action plan to improve strained trade ties. Yet, only two weeks later, Trump issued a memorandum, which directed Commerce Secretary Wilbur Ross to investigate the effects of steel imports on national security – and that became the first shot in the bilateral trade war last spring.

With the truce, the Muddling Through scenario prevails momentarily but it can easily reverse back toward escalation, even global trade war.

If the White House and the Congress fail to achieve a decent compromise in the Trump trade wars, the complications would degrade global economic outlook for years to come.

The stakes are historical. Failure should not be an option.

About the Author:

Dan Steinbock is the founder of Difference Group and has served as research director of international business at the India, China and America Institute (US) and a visiting fellow at the Shanghai Institute for International Studies (China) and the EU Center (Singapore). For more, see http://www.differencegroup.net/  

Based on Dr. Steinbock’s briefing on the Trump-Xi meeting and its impact on global growth prospects on December 2, 2018


Forex Technical Analysis & Forecast 05.12.2018 (EURUSD, GBPUSD, USDCHF, USDJPY, AUDUSD, USDRUB, GOLD, BRENT)

Article By RoboForex.com

EURUSD, “Euro vs US Dollar”

EURUSD has quickly rebounded from 1.1414. Possibly, today the pair may continue falling to reach 1.1310. Later, the market may start another growth towards 1.1330 and then trade downwards to reach 1.1295, thus forming a new consolidation range around 1.1310. If later the instrument breaks this range to the downside, the price may continue trading inside the downtrend with the target at 1.1220.

EURUSD
Risk Warning: the result of previous trading operations do not guarantee the same results in the future

GBPUSD, “Great Britain Pound vs US Dollar”

GBPUSD has rebounded from 1.2828. Possibly, the pair may continue falling inside the downtrend towards 1.2655 and then trade upwards to reach 1.2777. After that, the instrument may form a new descending structure with the target at 1.2622.

GBPUSD
Risk Warning: the result of previous trading operations do not guarantee the same results in the future

USDCHF, “US Dollar vs Swiss Franc”

USDCHF is growing towards 1.0007. Today, the pair may reach this level and break it. The short-term target at 1.0040. Later, the market may test 1.0007 from above and then continue trading inside the uptrend with the short-term target at 1.0100.

USDCHF
Risk Warning: the result of previous trading operations do not guarantee the same results in the future

USDJPY, “US Dollar vs Japanese Yen”

USDJPY has reached the short-term downside target; right now, it is forming another descending structure towards 112.40. Possibly, today the pair may be corrected to test 113.20 from below and then continue trading inside the downtrend with the first target at 112.40.

USDJPY
Risk Warning: the result of previous trading operations do not guarantee the same results in the future

AUDUSD, “Australian Dollar vs US Dollar”

AUDUSD has broken the consolidation channel downwards; right now, it is forming the first descending impulse with the target at 0.7256. After that, the instrument may be corrected towards 0.7323 and then resume falling inside the downtrend to reach 0.7222.

AUDUSD
Risk Warning: the result of previous trading operations do not guarantee the same results in the future

USDRUB, “US Dollar vs Russian Ruble”

USDRUB is consolidating around 66.47 without any particular direction. Today, the pair may fall to break 65.60 and then continue trading inside the downtrend with the short-term target at 64.64.

USDRUB
Risk Warning: the result of previous trading operations do not guarantee the same results in the future

XAUUSD, “Gold vs US Dollar”

Gold has reached another upside target. However, today the instrument isn’t traded. After the market opening on Thursday, the pair may form a new descending structure with the first target at 1216.20.

GOLD
Risk Warning: the result of previous trading operations do not guarantee the same results in the future

BRENT

Brent is consolidating close to 61.50. However, today the instrument isn’t traded as well. After the market opening on Thursday, the instrument may form one more ascending structure with the target at 65.80.

BRENT
Risk Warning: the result of previous trading operations do not guarantee the same results in the future

Article By RoboForex.com

Attention!
Forecasts presented in this section only reflect the author’s private opinion and should not be considered as guidance for trading. RoboForex LP bears no responsibility for trading results based on trading recommendations described in these analytical reviews.

Bitcoin and Taxes: What You May Not Know

This article by Valerie Rind first appeared on TaxAct.

You might be aware that your Bitcoin or other cryptocurrency transactions have a possible taxable impact. However, you might not know exactly how to report them. You can use this bitcoin tax calculator or read on for more guidance on cryptocurrency taxes.

What is Bitcoin?

Bitcoin is a worldwide payment system where users buy virtual currency using an exchange. The Bitcoins are stored in a digital wallet and can be transferred using a mobile app. No bank or other intermediary institution is involved.

Bitcoins can be used as a digital currency to send or receive funds, pay for goods or services, or simply for investment.  Transactions are anonymous and are tracked only via the digital wallet identifiers on a public ledger. Originally used by illicit operators, mainstream companies such as Overstock.com now accept Bitcoin as payment.

Enter the IRS

The Internal Revenue Service (IRS) isn’t blind to Bitcoin and provided guidance about “convertible virtual currency” in its Notice 2014-21.

The IRS defined convertible virtual currency as virtual currency that has an equal value in real currency, or that is a substitute for real currency.

The IRS specifically referred to Bitcoin as a type of convertible virtual currency that can be digitally traded. In addition, you can buy or exchange virtual convertible currencies into U.S. dollars or other real or virtual currencies. However, virtual currency itself does not have legal tender status in the U.S.

Tax Liability

“Though cryptocurrencies seem like a brand-fangled new investment, one with which our, by comparison, antiquated tax system can’t compete, they are actually taxed like pretty much any other mundane item,” emailed Mark Durrenberger, Certified Financial Planner®, Enrolled Agent and author of The Modern Day Millionaire.

If you sell, exchange, or use convertible virtual currency to pay for goods or services, you might have a tax liability. For tax purposes, the IRS treats convertible virtual currencies as property. If you receive Bitcoin as payment for goods or services you provide, then when you compute your gross income, you must include the fair market value of Bitcoin in U.S. dollars as of the date you received the Bitcoins.

Durrenberger gave the following example:

“If you buy Bitcoin for $100, and later sell it for, say, $1,000, [y]ou would owe capital gains taxes on that $900 gain. If you held that Bitcoin for less than one year, the tax rate would be whatever rate you pay on your regular income. If you held it for longer than one year before you sold, you are taxed at the more favorable (i.e., lower) long-term capital gains rates,” Durrenberger said.

Fair Market Value

How would you determine the fair market value of Bitcoin? “It can get a bit tricky as the value of Bitcoin jumps and dips constantly and those changes can be quite drastic at times,” emailed David Hryck, a tax lawyer, and partner at Reed Smith in New York City. “You will have to convert the Bitcoin value to U.S. dollars as of the date each payment is made.”

In this world of anonymous payments, recordkeeping of your transactions might be a challenge. “Make sure you keep careful records of the dates and value,” Hryck said.

Independent Contractors

If a company or individual pays you in Bitcoins for services you performed as an independent contractor, you might wonder if it constitutes self-employment income.

According to the IRS, self-employment income includes all gross income from any trade or business you engage in, other than as an employee. The fair market value of Bitcoins you receive for your services (measured in U.S. dollars as of the date you receive payment) is self-employment income and consequently is subject to self-employment tax.

Reporting to the IRS

You might wonder how to report your Bitcoin or other cryptocurrency transactions on your annual tax return.

The basic tax rules that are applicable to property transactions apply to transactions using virtual currency. The IRS has made it clear that Bitcoin is a type of property and your transactions must be reported.

You should file Form 8949, Sales and Other Dispositions of Capital Assets and Schedule D (1040), Capital Gains and Losses, with your annual tax return to reflect your cryptocurrency transactions.

Failure to Report

What will happen if you skip reporting your Bitcoin or other digital currency transactions on your tax returns? Will the IRS know?

The fact that in 2014 the IRS issued a comprehensive notice including a Q&A section shows that the IRS is well aware that Bitcoin and other cryptocurrency transactions are more than a passing fad. As with any tax law or IRS rules, you assume certain risks if you fail to comply.

This article by Valerie Rind first appeared on TaxAct

Source: https://blog.taxact.com/bitcoin-and-taxes/


Fibonacci Retracements Analysis 05.12.2018 (GBPUSD, EURJPY)

Article By RoboForex.com

GBPUSD, “Great Britain Pound vs US Dollar”

As we can see in the H4 chart, after breaking the previous low, GBPUSD stopped moving sideways and right now is still trading downwards. The downside targets are inside the post-correctional extension area between the retracements of 138.2% and 161.8% at 1.2646 and 1.2597 respectively. At the same time, there is a convergence on MACD, which may indicate a new pullback after the instrument reaches its short-term downside targets.

GBPUSD1
Risk Warning: the result of previous trading operations do not guarantee the same results in the future

The H1 chart shows more detailed structure. There is a convergence on MACD. The current movement looks like the Divergent Triangle pattern, which is another signal of a possible pullback in the nearest future.

GBPUSD2
Risk Warning: the result of previous trading operations do not guarantee the same results in the future

EURJPY, “Euro vs. Japanese Yen”

As we can see in the H4 chart, EURJPY is trading towards the local support at 127.50 and trying to break the long correctional channel. If the above-mentioned level is broken, the price may fall to reach the key low at 126.63, which is inside the post-correctional extension area between the retracements of 138.2% and 161.8% at 126.82 and 126.40 respectively.

EURJPY1
Risk Warning: the result of previous trading operations do not guarantee the same results in the future

In the H1 chart, the pair got very close to the low at 127.50 and then started a new short-term correction towards the retracement of 50.0%.

EURJPY2
Risk Warning: the result of previous trading operations do not guarantee the same results in the future

Article By RoboForex.com

Attention!
Forecasts presented in this section only reflect the author’s private opinion and should not be considered as guidance for trading. RoboForex LP bears no responsibility for trading results based on trading recommendations described in these analytical reviews.

US stocks rebounded sharply last week, opening with a gap on Monday over G20 news and US-China tariff war ceasefire

By Roberto d’Ambrosio, Alpari

Last week we mentioned a few fundamental and technical reasons for a rebound of the US stocks, describing two long trades on the S&P500 and the NASDAQ indexes. That was a great call indeed as the US stock market made a great come back with the DJIA gaining 5.2% at 25538, the SP500 closing at 2760, a +4.8% on the previous week’s close, and the NASDAQ gained 5.6% closing at 7331.

Besides the general fundamental reasons we described last week, the rally was boosted by FED Chairman Powell’s reference to interest rates being close to neutral, contradicting his previous comments and suggesting a slowdown in interest rate hikes in future FOMC meetings.

A further, sizable boost to the upward movement was provided by the news coming from the G20 summit in Argentina, held over the weekend, during which the US administration announced that for the next 90 days, no new tariffs will be levied on 200 billion dollars’ worth of Chinese products. These tariffs were previously set to come into effect on the 1st of January, 2019. The possible easing of tensions regarding the trade dispute between the US and China added to the positive climate, even if the suspension does not necessarily imply a solution to the dispute, and the US stock indexes, as well as stock indexes in other areas, opened with a huge gap to the upside.

As you might remember, last week we opened two long trades on S&P500 and NASDAQ, indicating the first targets on which we would close half a position and then trail the rest. As expected, the first target was reached within the subsequent day and half of the position was closed, raising the stop loss to break even for both trades. Thereafter, we have been managing the trades, posting real time updates on Twitter and executing the strategy live during our seminars and client sessions in Lagos and Abuja.

We did the last update on Monday, the 3rd of December, after the big gap up we mentioned before. Besides the high probability that such a gap could be closed in a relatively short time (again, the tariff suspension is good news, but nothing final), we are witnessing a yield curve inversion after more than a decade on US bonds, and that is bad news, as such an occurrence has anticipated a recession in the past. Therefore, during our Alpari client session, we moved the stops and tweeted in real time:

Since then, the market moved toward closing the gap and took our stop profit on NASDAQ, while the trade on S&P500 is still open as we write these notes. Here is the situation on S&P500:

After the gap up, the index stopped right on the 61.8% retracement and on the same exact point it was rejected twice while attempting to climb above the 200 period’s moving average. There is also a doji there signaling uncertainty after the gap.

In this situation, we hold to on our short while the market is pretty close to take out our stop profit at 2765. I know that we are in the “Christmas rally” zone, and some window dressing might be going on by investment banks, but that inversion on the yield curve really points to the opposite direction, in a way confirming my underlying bearish view on stocks.

What I will be looking at is the nearest dynamic support which is a long term one. Should the price go down below again, a short even before the end of the year could make sense.

On the contrary, above the triple top, the price might test 2880 and beyond that head for September highs.

Here is the NASDAQ:

As mentioned, our trailing profit was hit after prices retraced from the gap up. As we can see, the index did not make it to climb above the 50% retracement and is still below the 200-period moving average.

In this situation, we will rather remain neutral. We brought our profits home and there is no graphical confirmation for any kind of trade. The gap could be closed in the next few hours with a test of the ex-dynamic resistance around 6920, while the run to the highs could happen if the price breaks convincingly above 7235.

This week we also managed our short trade on DAX which was some 800 points in the green. As we tweeted in real time, there is no point in giving back so much gain, even if the large head and shoulder is still very active:

The tweet is self-explanatory. As we write this note, the trade is still in place and prices are moving away from the stop profit:

The topic moment will be on the test of the ex-dynamic resistance. If it holds, the price will confirm the divergences on the indicators and will probably move toward the stop.

Here we are well below the 200-period moving average, and so far the reaction from the double bottom has not been convincing. We will hold on to our stop profit and will consider managing it as the situation unfolds this week.

Let’s now have a look at our home run short trade on Brent Oil. The run was closed on Monday after having lowered the stop profit further:

We made an insane amount of profit on this trade and I really hope some of you took our view and traded this sharp drop.

Now we have the OPEC meeting coming this week and we will steer off this commodity for the time being, as volatility induced by the organization’s decision might induce false signals. Odds are that production cuts will be decided and therefore we could assist to pressure to the upside as the chart seems to confirm:

We can notice the breakout of the second dynamic resistance confirming the divergence on the indicators. If we are correct regarding the production cuts, the movement could extend to 64.20, and then 66.

As for EURUSD, last week we were waiting for an inverse head and shoulder pattern to be finalized, confirming the divergences on the indicators before taking a long trade.

And that was a wise decision, as the pattern was not complete, and the cross went back below 13 before starting to rise again. This is further confirmation that trades are to be made only when all elements constituting the set up are in place, avoiding rushed decisions.

Here is the situation:

We still think a long trade can be taken above the resistance area marked in blue, which would also mean the breakout of the dynamic resistance which has been driving prices down since June 2018.

This is all for this week. Apart of the mentioned OPEC meeting which will be held on Thursday, we need to pay attention to the GDP announcement in Australia and ECB President Draghi’s speech on Wednesday, Bank of Canada’s Governor Poloz’s, and FED Chair Powell’s speeches on Thursday, the German industrial production, the GDP announcement in the eurozone, and the Non-Farm Payrolls on Friday.

Have a great trading week!

The Analytical Overview of the Main Currency Pairs on 2018.12.05

Analytics by JustForex

The EUR/USD currency pair

Technical indicators of the currency pair:
  • Prev Open: 1.13523
  • Open: 1.13413
  • % chg. over the last day: -0.11
  • Day’s range: 1.13168 – 1.13462
  • 52 wk range: 1.1299 – 1.2557

Yesterday’s trading in major currency majors was very active. At the same time, a unidirectional trend was not observed. The dollar index (#DX) closed the trading session with a slight decrease (-0.07%). Participants of financial markets are concerned about the inversion of the US government bonds yield curve and the risks of a trade war. At the moment, the EUR/USD currency pair is consolidating in the range of 1.13200 and 1.13450. Positions must be opened from these marks.

At 11:00 (GMT+2:00) a number of indices on economic activity in the eurozone will be published.

EUR/USD

Indicators do not send accurate signals: 50 MA has begun to cross 200 MA.

The MACD histogram is in the negative zone and below the signal line, indicating the bearish sentiment.

Stochastic Oscillator has started to go out of the oversold zone, the %K line is above the %D line, which gives a signal to buy EUR/USD.

Trading recommendations
  • Support levels: 1.13200, 1.12800
  • Resistance levels: 1.13450, 1.13700, 1.14000

If the price fixes below the support level of 1.13200, it is necessary to consider selling EUR/USD. The movement is tending to 1.12800-1.12600.

An alternative could be the recovery of the EUR/USD quotes to the level of 1.13700-1.14000.

The GBP/USD currency pair

Technical indicators of the currency pair:
  • Prev Open: 1.27232
  • Open: 1.27080
  • % chg. over the last day: -0.04
  • Day’s range: 1.26717 – 1.27276
  • 52 wk range: 1.2662 – 1.4378

The technical pattern on the GBP/USD currency pair is still ambiguous. At the moment, quotes are testing key support and resistance levels: 1.26800 and 1.27250, respectively. Investors expect relevant information regarding the Brexit process. Optimistic statistics on the UK business provides additional support for the pound. We recommend opening positions from key levels.

At 11:30 (GMT+2:00) the index of economic activity in the UK services sector will be published.

GBP/USD

Indicator signals are different. The price has approached 50 MA, which is a strong dynamic resistance.

The MACD histogram is in the negative zone, but above the signal line, which gives a weak signal to sell GBP/USD.

Stochastic Oscillator is in the neutral zone, the %K line is above the %D line, which indicates the bullish sentiment.

Trading recommendations
  • Support levels: 1.26800, 1.26500
  • Resistance levels: 1.27250, 1.27750, 1.28250

If the price fixes above the resistance level of 1.27250, the GBP/USD quotes are expected to grow. The movement is tending to 1.27750-1.28000.

An alternative could be a decrease in the GBP/USD currency pair to 1.26500-1.26300.

The USD/CAD currency pair

Technical indicators of the currency pair:
  • Prev Open: 1.31967
  • Open: 1.32578
  • % chg. over the last day: +0.45
  • Day’s range: 1.32523 – 1.32924
  • 52 wk range: 1.2248 – 1.3387

The USD/CAD currency pair recovered most of its losses after a sharp decline on Monday, December 3. During yesterday’s and today’s trading, the growth of the USD/CAD quotes amounted to almost 100 points. At the moment, Loonie is consolidating near the local resistance of 1.32900. The mark of 1.32600 is already a “mirror” support. Investors took a wait and see attitude before a meeting of the Bank of Canada. It is expected that the regulator will maintain the basic parameters of the monetary policy. Positions must be opened from the key levels.

At 17:00 (GMT+2:00), the Bank of Canada will announce its decision on the key interest rate.

USD/CAD

The price has fixed above 50 MA and 200 MA, which indicates the power of buyers.

The MACD histogram is in the positive zone and above the signal line, which gives a strong signal to buy USD/CAD.

The Stochastic Oscillator is in the neutral zone, the %K line is above the %D line, which indicates a drop in the USD/CAD quotes.

Trading recommendations
  • Support levels: 1.32600, 1.32200, 1.31850
  • Resistance levels: 1.32900, 1.33200, 1.33550

If the price fixes above the local resistance of 1.32900, further growth of the USD/CAD quotes is expected. The movement is tending to 1.33200-1.33500.

Alternative option. If the price fixes below 1.32600, we recommend looking for market entry points to open short positions. The movement is tending to 1.32300-1.32000.

The USD/JPY currency pair

Technical indicators of the currency pair:
  • Prev Open: 113.604
  • Open: 112.753
  • % chg. over the last day: -0.86
  • Day’s range: 112.896 – 113.657
  • 52 wk range: 104.56 – 114.74

The USD/JPY currency pair is consolidating after a sharp decline during yesterday’s trading. The technical pattern is ambiguous. Local levels of support and resistance are 112.900 and 113.150, respectively. Positions must be opened from these marks. We recommend paying attention to the dynamics of the yield of US government bonds. The USD/JPY currency is tending to decline.

The news feed on the Japanese economy is calm.

USD/JPY

The price has fixed below 50 MA and 200 MA, which indicates the power of sellers.

The MACD histogram is close to the 0 mark. There are no accurate signals.

The Stochastic Oscillator is in the neutral zone, the %K line is below the %D line, which gives a signal to sell USD/JPY.

Trading recommendations
  • Support levels: 112.900, 112.650
  • Resistance levels: 113.150, 113.300, 113.450

If the price fixes below the support level of 112.900, it is necessary to consider selling USD/JPY. The movement is tending to 112.650-112.500.

An alternative could be the growth of the USD/JPY quotes to 113.300-113.500.

Analytics by JustForex

The Major Currencies Are Showing a Variety of Trends

by JustForex

Yesterday, the trade on the major currency pairs was very active, although there wasn’t a unified trend. The USD was slightly weakened against the other major currencies due to the inversion of the US government bonds yield curve. Investors are still worried about the US/China trading war, especially since Donald Trump announced that he might still increase the fees on the Chinese wares if China and the US wouldn’t be able to reach a compromise. This compromise must be reached in the next 90 days of truce. The USD index (#DX) closed in the red (-0.07%).

Yesterday the UK published some positive reports. For example, the construction PMI reached 53.4 while the investors were expecting 52.5. The British pound remains under pressure due to the debates in the British parliament concerning Brexit, which will last for five days.

During the Asian trading session, Australia published weak GDP reports. The indicator for the third quarter is +0.3% while the experts expected +0.6%. The financial market participants are waiting for the Bank of Canada to decide on the key interest rate.

Prices on oil started to descend. The WTI futures are testing the 52.25 USD/barrel mark.

Market Indicators

There were some aggressive sales on the US stock market yesterday: #SPY (-3,24%), #DIA (-3,09%), #QQQ (-3,84%).

The 10-year US government bonds yield keeps lowering. At the moment it is at 2.91-2.92%.

The Economic News Feed for 05.12.2018:
  • – Service PMI (UK) – 11:30 (GMT+2:00);
  • – A decision on the key interest rate in Canada – 17:00 (GMT+2:00);
  • – Beige Book – 21:00 (GMT+2:00).

by JustForex

Japanese Candlesticks Analysis 04.12.2018 (EURUSD, USDJPY)

Article By RoboForex.com

EURUSD, “Euro vs. US Dollar”

As we can see in the H4 chart, EURUSD is testing the resistance level again and forming Hammer, Doji, and Harami reversal patterns. Judging by the previous movements, at the moment it may be assumed that after finishing the correction the instrument may continue moving to the upside.

EURUSD
Risk Warning: the result of previous trading operations do not guarantee the same results in the future

USDJPY, “US Dollar vs. Japanese Yen”

As we can see in the H4 chart, USDJPY has rebounded from the resistance level once again and formed Doji and Hanging Man reversal patterns. Judging by the previous movements, at the moment it may be assumed that after completing the pullback the instrument may continue its ascending tendency.

USDJPY
Risk Warning: the result of previous trading operations do not guarantee the same results in the future

Article By RoboForex.com

Attention!
Forecasts presented in this section only reflect the author’s private opinion and should not be considered as guidance for trading. RoboForex LP bears no responsibility for trading results based on trading recommendations described in these analytical reviews.

Ichimoku Cloud Analysis 04.12.2018 (AUDUSD, NZDUSD, USDCAD)

Article By RoboForex.com

AUDUSD, “Australian Dollar vs US Dollar”

AUDUSD is trading at 0.7372; the instrument is moving above Ichimoku Cloud, thus indicating an ascending tendency. The markets could indicate that the price may test the upside border of the cloud at 0.7355 and then resume moving upwards to reach 0.7465. Another signal to confirm further ascending movement is the price’s rebounding from the support level. However, the scenario that Implies further growth may be cancelled if the price breaks the downside border of the cloud and fixes below 0.7320. In this case, the pair may continue falling towards 0.7255.

AUDUSD
Risk Warning: the result of previous trading operations do not guarantee the same results in the future

NZDUSD, “New Zealand Dollar vs US Dollar”

NZDUSD is trading at 0.6957; the instrument is moving above Ichimoku Cloud, thus indicating an ascending tendency. The markets could indicate that the price may test Tenkan-Sen and Kijun-Sen at 0.6940 and then resume moving upwards to reach 0.7020. Another signal to confirm further ascending movement is the price’s rebounding from the channel’s downside border. However, the scenario that Implies further growth may be cancelled if the price breaks the downside border of the cloud and fixes below 0.6910. In this case, the pair may continue falling towards 0.6825.

NZDUSD
Risk Warning: the result of previous trading operations do not guarantee the same results in the future

USDCAD, “US Dollar vs Canadian Dollar”

USDCAD is trading at 1.3175; the instrument is moving below Ichimoku Cloud, thus indicating a descending tendency. The markets could indicate that the price may test the downside border of the cloud at 1.3205 and then resume moving downwards to reach 1.3095. Another signal to confirm further descending movement is the price’s rebounding from the resistance level. However, the scenario that implies further decline may be cancelled if the price breaks the upside border of the cloud and fixes above 1.3255. In this case, the pair may continue growing towards 1.3365.

USDCAD
Risk Warning: the result of previous trading operations do not guarantee the same results in the future

Article By RoboForex.com

Attention!
Forecasts presented in this section only reflect the author’s private opinion and should not be considered as guidance for trading. RoboForex LP bears no responsibility for trading results based on trading recommendations described in these analytical reviews.

The Analytical Overview of the Main Currency Pairs on 2018.12.04

Analytics by JustForex

The EUR/USD currency pair

Technical indicators of the currency pair:
  • Prev Open: 1.13499
  • Open: 1.13523
  • % chg. over the last day: +0.11
  • Day’s range: 1.13516 – 1.13982
  • 52 wk range: 1.1299 – 1.2557

On the EUR/USD currency pair, the bullish sentiment is observed. At the moment, quotes are consolidating. The key support and resistance levels are 1.13650 and 1.14000, respectively. Investors continue to evaluate the outcome of the G20 summit. The single currency is tending to recover. We recommend opening positions from the key levels.

Publication of important economic reports from the US and the eurozone is not planned.

EUR/USD

Indicators do not give accurate signals: 50 MA has crossed 200 MA.

The MACD histogram is in the positive zone and above the signal line, which indicates the growth of the EUR/USD quotes.

Stochastic Oscillator has moved from the overbought zone, the %K line is below the %D line, which gives a signal to sell EUR/USD.

Trading recommendations
  • Support levels: 1.13650, 1.13300, 1.13100
  • Resistance levels: 1.14000, 1.14350, 1.14500

If the price fixes above the round level of 1.14000, further growth of the EUR/USD currency pair is expected. The movement is tending to 1.14350-1.14500.

An alternative could be a reduction in the EUR/USD quotes to 1.13300-1.13100.

The GBP/USD currency pair

Technical indicators of the currency pair:
  • Prev Open: 1.27291
  • Open: 1.27232
  • % chg. over the last day: -0.21
  • Day’s range: 1.27194 – 1.27868
  • 52 wk range: 1.2662 – 1.4378

The GBP/USD currency pair is traded in the flat. The unidirectional trend is not observed. At the moment, the following key support and resistance levels can be identified: 1.27250 and 1.27750, respectively. Yesterday, positive statistics on economic activity in the UK manufacturing sector was published, which provides additional support to the pound. We recommend opening positions from the key levels. The GBP/USD quotes are tending to grow.

At 11:30 (GMT+2:00) the index of economic activity in the UK construction sector will be published.

GBP/USD

Indicators do not send accurate signals: the price has crossed 50 MA and 200 MA.

The MACD histogram has reached the 0 mark.

Stochastic Oscillator is in the neutral zone, the %K line has crossed the %D line. There are no signals at the moment.

Trading recommendations
  • Support levels: 1.27250, 1.27000
  • Resistance levels: 1.27750, 1.28250, 1.28600

If the price fixes above the resistance level of 1.27750, the GBP/USD quotes are expected to grow. The movement is tending to 1.28250-1.28400.

An alternative could be the reduction of the GBP/USD currency pair to the round level of 1.27000.

The USD/CAD currency pair

Technical indicators of the currency pair:
  • Prev Open: 1.32359
  • Open: 1.31967
  • % chg. over the last day: -0.43
  • Day’s range: 1.31693 – 1.32017
  • 52 wk range: 1.2248 – 1.3387

The USD/CAD currency pair is consolidating after aggressive sales during yesterday’s trading session. Currently, local support and resistance levels are 1.31650 and 1.31900, respectively. Loonie is supported by a correction in the market of “black gold”. The USD/CAD quotes are tending to decline. Positions must be opened from the key levels.

The news feed on the economy of Canada is quite calm.

USD/CAD

The price has fixed below 50 MA and 200 MA, which indicates the power of sellers.

The MACD histogram is in the negative zone and continues to decline, which gives a strong signal to sell USD/CAD.

The Stochastic Oscillator is in the oversold zone, the %K line has crossed the %D line. There are no signals at the moment.

Trading recommendations
  • Support levels: 1.31650, 1.31300, 1.31000
  • Resistance levels: 1.31900, 1.32200, 1.32500

If the price fixes below the support level of 1.31650, a further decline in the USD/CAD quotes is expected. The movement is tending to 1.31300-1.31000.

Alternative option. If the price consolidates above the level of 1.31900, we recommend looking for entry points to the market to open long positions. The movement is tending to 1.32200-1.32400.

The USD/JPY currency pair

Technical indicators of the currency pair:
  • Prev Open: 113.654
  • Open: 113.604
  • % chg. over the last day: -0.16
  • Day’s range: 112.896 – 113.657
  • 52 wk range: 104.56 – 114.74

The USD/JPY currency pair shows a negative trend. Today, the drop in quotes exceeded 70 points. Trading instrument updated local lows. Currently, the key range is 112.900-113.150. The USD/JPY currency pair is tending to decline. We recommend paying attention to the dynamics of the US government bonds yield. Positions must be opened from the key levels.

The news feed on the Japanese economy is calm.

USD/JPY

The price has fixed below 50 MA and 200 MA, which indicates the power of the sellers.

The MACD histogram is in the negative zone and below the signal line, which gives a strong signal to sell USD/JPY.

The Stochastic Oscillator is in the oversold zone, the %K line has crossed the %D line. There are no accurate signals.

Trading recommendations
  • Support levels: 112.900, 112.650
  • Resistance levels: 113.150, 113.300, 113.450

If the price fixes below the local support of 112.900, a further fall in the USD/JPY currency pair is expected. The movement is tending to 112.650-112.500.

An alternative could be the growth of the USD/JPY quotes to 113.250-113.400.

Analytics by JustForex